An audiogram is a graph that displays the results of a hearing test carried out in quiet. Hearing thresholds across different frequencies, or pitches are plotted on the audiogram. A hearing threshold is defined as the softest sound detected.

The horizontal axis (x-axis) represents frequency (pitch) from lowest to highest.
You can think of the frequency axis like the keys on a piano where the sounds become higher pitched as you progress from left to right. Frequency is measured in Hertz (Hz). Most speech falls between 250Hz to 6kHz. Vowel sounds are lower-pitched which give the volume to a voice. The consonants such as S, F, SH, CH, H, TH, T and K sounds are higher and give intelligibility/understanding to speech.

The vertical axis (y-axis) of the audiogram represents the intensity (loudness) of sound.
The volume of sound is measured in decibels (dB). The quietest levels are at the top of the graph. Although the top left of the chart is labelled -10 dB or 0 dB, that does not mean the absence of sound. Zero decibels actually represents the softest level of sound that the average person with normal hearing will hear, for any given frequency.
The severity of a hearing loss, or level of deafness is determined by where the symbols fall on the graph. Levels of deafness are usually classified as mild, moderate, severe or profound. There can also be other descriptor such as flat, sloping or rising to give more information about the deafness.
Testing with headphones is called air conduction testing because the sound must travel through the empty space of the ear canal to reach the inner ear.
- a red “o” marks the air conduction results for the right ear
- a blue “x” marks the air conduction results for the left ear
Each symbol on the chart represents the threshold for a given frequency. Once all of the thresholds are measured and plotted on the graph, they are connected to form easy-to-read lines for the left and right ears.
If the two lines are essentially overlapping, your hearing loss is considered symmetrical, the same in both ears. If the lines are not overlapping your hearing loss is considered asymmetrical, meaning your ears have differing degrees of deafness/hearing loss.
Even a mild level of hearing loss can cause a loss in speech clarity, leading to communication difficulties.
Hearing loss is highly unique. Audiogram results can vary widely and reveal different types of hearing loss.
Speech Banana
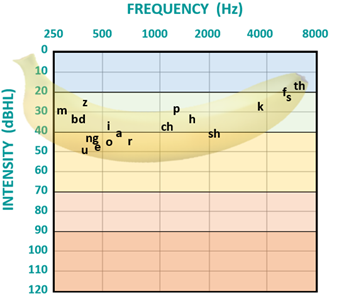
Some audiograms may show a ‘speech banana’, used to indicate where the volume/pitch of speech sounds occur.