Contents
Annex 2
Back to Main Menu Continue to Annex 3
1. Introduction
Included in the Council’s Strategic Plan for 2021-2025 is prioritising sustainable travel and transport, with emphasis on promoting opportunities for cycling and walking in the county. The desire for safe, serviceable, and sustainable footways is an essential part of the Strategy.
Footways have many benefits:
- They provide safe space for pedestrians, especially younger and elderly users,
- They separate pedestrians and traffic,
- They connect communities, schools, hospitals, and businesses,
- Walking promotes, wellness, active and sustainable travel, and
- Walking also helps us in reducing our carbon footprints.
Since the Government published its Gear Change plan in 2020, there has been additional focus and funding made available for active travel. £2 billion of funding has been committed for active travel over 5 years with the aim for 50% of all journeys in towns and cities to be walked or cycled by 2030. In support of these aims, local authorities are expected to produce Local Cycling and Walking Infrastructure Plans (LCWIPs) to enable a long-term approach to developing local cycling and walking networks.
In Devon, The Council is developing LCWIPs for the major urban growth areas where there is greatest scope to secure developer contributions to enable delivery of the scheme as well as for our leisure network of trails, which are an important part of improving peoples’ health and wellbeing and supporting our rural economy.
The development of LCWIPs will have an impact on the nature and maintenance requirements of the County’s footway asset group, and as such consultations with key stakeholders will continue to best understand this. Where possible the Council will also look for opportunities when undertaking planned maintenance to link into LCWIPs in order to maximise efficiencies and value for money.
2. Inventory
2.1 Inventory
A detailed highway inventory is an essential prerequisite of establishing a cost effective and adequate maintenance regime and is the starting point for valuation of the asset which is to be used for the Whole of Government Accounts (WGA) currently being implemented. The current Footway Gross Replacement Value (the cost of replacing the asset with its modern equivalent) is £421,406,000 and the Depreciated Replacement Cost (the cost of replacement of the highway in its current condition) is £333,513,100.
The inventory is the foundation on which asset management is built and when analysed in combination with other data, for example, condition, road casualties and traffic flows, it provides crucial decision supporting information.
2.2 Network Hierarchy
The development of a footway maintenance hierarchy is the foundation of a coherent consistent and auditable asset inventory as it provides the organisation structure to the inventory.
The hierarchy reflects the needs, priorities and actual use of each road and will be used as a tool in determining priorities maintenance standards, targets and performance.
A table of the Footway Maintenance Hierarchy and respective lengths of each hierarchy is shown below:
| Footway Maintenance Hierarchy | Hierarchy Description | Type of Footway / General Description | Length of Hierarchy | Percentage of Network |
| 1 | Primary Walking Route | Busy urban shopping and business area and main pedestrian routes. | 99 km | 3.5% |
| 2 | Secondary Walking Route | Medium usage routes through local areas feeding into primary routes, local shopping centres etc | 142 km | 5% |
| 3 | Link Footway | Linking local access footways through urban areas and busy rural areas. | 322 km | 11.5% |
| 4 | Local Access Footway | Footways associated with low usage, short estate roads to the main roads and Cul-De-Sac. | 2,244 km | 80% |
Fig.2.1: Footway Maintenance Hierarchy
3. Performance
3.1 Current and historical condition
The establishment of an effective regime of inspection, assessment and monitoring of asset condition is an essential component of an effective asset plan. The inspection types and condition assessment methods featured below are based on the national code of practice Well-managed Highway Infrastructure 2016. The guidance uses a risk-based approach to developing local practices.
Inspections are particularly important in the case of network safety where information may be crucial in respect to legal actions. A robust inspection regime therefore forms part of the Council’s defence against claims and legal proceedings.
Safety Inspections
The current safety inspection regime can be found in the current Highway Safety policy, a link to which can be found here.
The Council’s standards for the frequency of footway safety inspections considers current national guidelines such as:
- Well-managed Highway Infrastructure: A Code of Practice issued (October 2016),
- Well Managed Highway Liability Risk issued March 2017, and
- Highway Act 1980.
| Footway Maintenance Category | Hierarchy Description | Suggested frequency of inspections. |
| 1 | Primary walking route | monthly |
| 2 | Secondary walking route | 3 months |
| 3 | Link footway | 6 months |
| 4 | All other metalled footways | 12 months |
Fig.2.2: Categories, Description and Frequency of Inspection
Condition Surveys
Footway Network Surveys (FNS) are carried out yearly on all categories of footway. They provide a detailed visual inspection for footways which delivers a comprehensive survey of the condition to support effective asset management.
The purpose of condition assessment is to address the key objective of Network performance and to ensure that value for money is achieved when undertaking structural repairs.
By following asset management principles and providing information on the nature and severity of impairment, the timing and nature of appropriate treatments can be determined. Data from these surveys are also used in the production of National Indicators and repeatable condition surveys allow for analysis of trends within the network.
Condition data is used to identify and generate potential footway LACP (Local Asset Capital Programme) schemes.
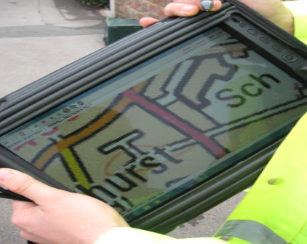
Fig. 2.3: Picture of surveyor on site, using OS maps on tablet to identify survey location.
Reporting by the public
A valuable source of condition data is the information the Council gather from the public when safety defects are reported. The provision of location of defects enables the contractor to optimise gangs in organising repairs in an efficient manner.
3.2 Current Performance
Condition surveys are primarily intended to identify deficiencies in the highway infrastructure which if untreated are likely to adversely affect the long-term performance and serviceability of the asset. They provide information on the nature and severity of deterioration which is used to determine appropriate maintenance treatments and inform the asset valuation process. These surveys are used to provide assessments of overall performance, maintenance requirements and relevant data for national performance indicators.
Safety Inspections
The table below shows the number of defects reported during safety inspections in recent years.
| Year | Defects | Notes |
| 2020/2021 | 9,141 | |
| 2021/2022 | 9,028 | |
| 2022/2023 | 6,418 | To Jan 2023 |
Fig.2.4: Defects from Safety Inspections
Condition Inspections
Fig. 2.5 shows results from FNS between 2016 and 2021. The graph presents the length of each Footway Hierarchy against each of the four bands for Footway Condition. These are: As New, Aesthetically Impaired, Functionally Impaired, and Structurally Impaired.
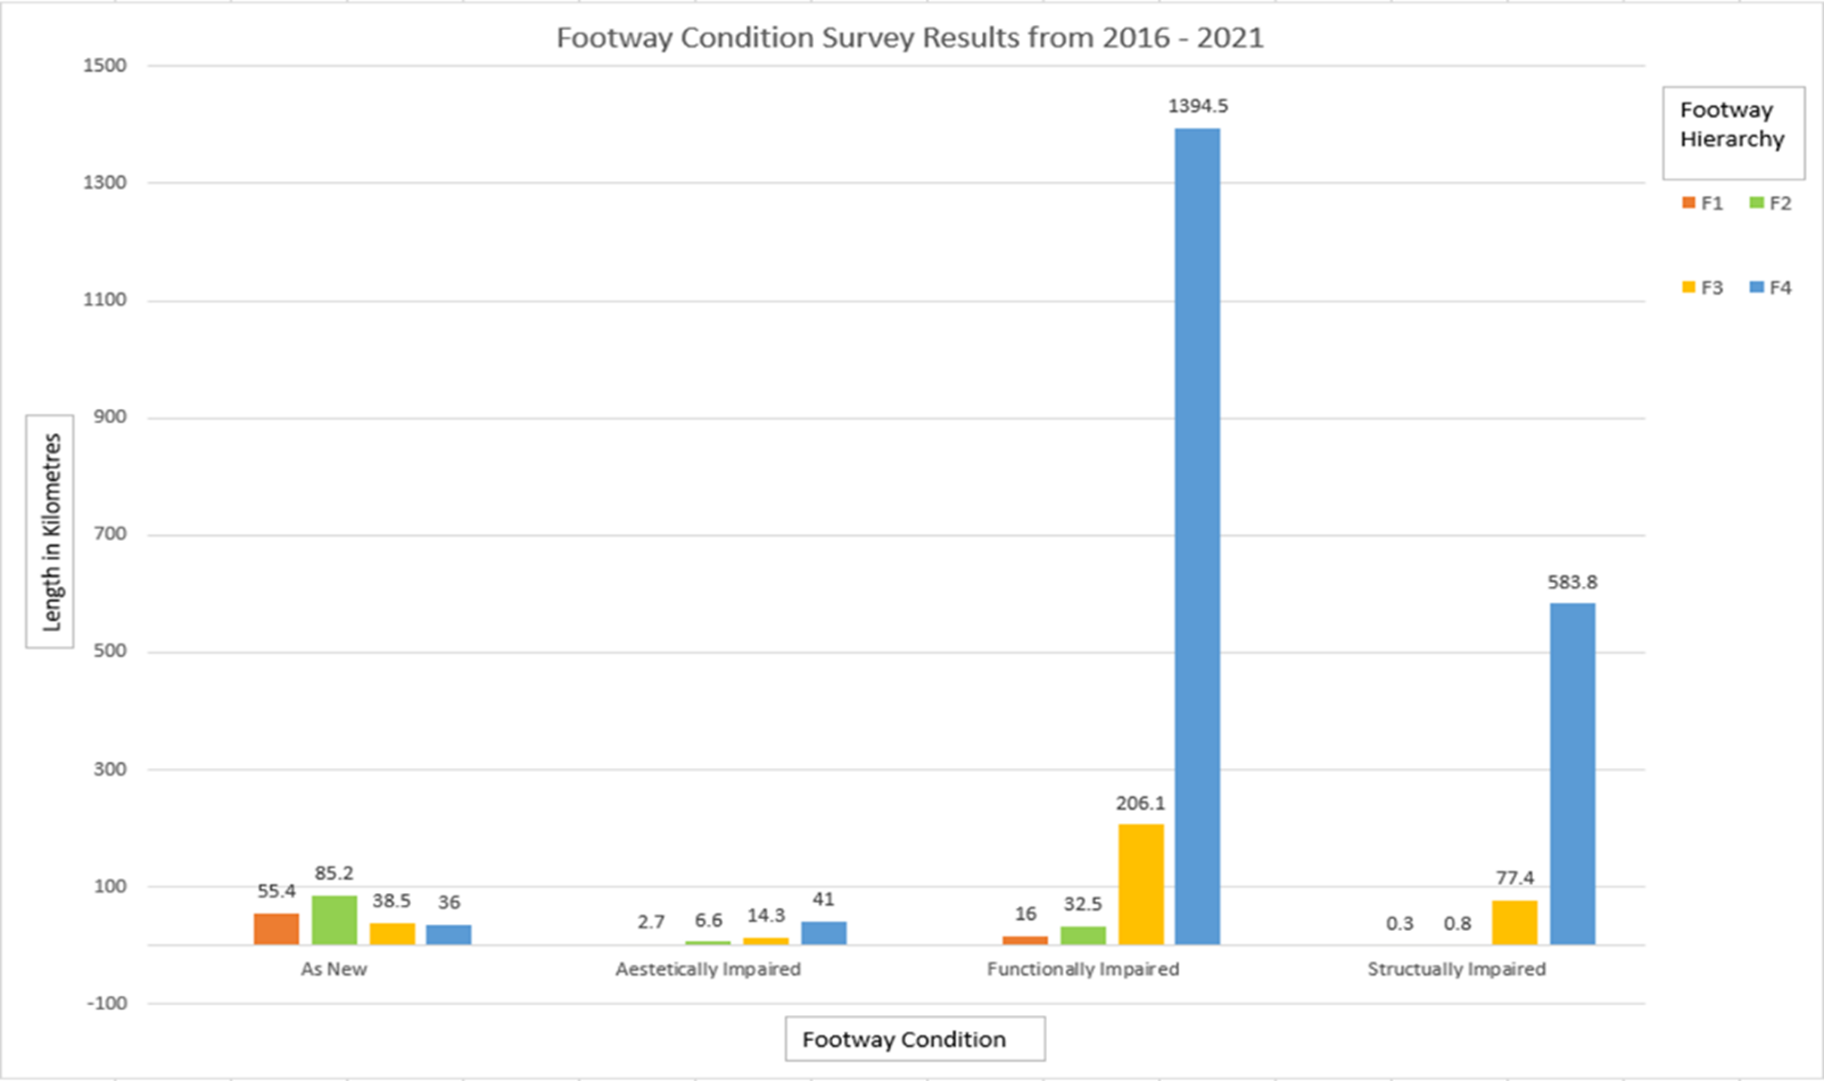
Fig. 2.5: Graph showing Footway Condition from FNS Inspections
The same data is represented in a tabular format in Fig 2.6 below, which shows the percentage of each footway category in each condition band.
| Footway Hierarchy | Condition | |||
| As New | Aesthetically Impaired | Functionally Impaired | Structurally Impaired | |
| F1 | 74.5% | 3.6% | 21.5% | 0.4% |
| F2 | 68.1% | 5.3% | 26.0% | 0.6% |
| F3 | 11.4% | 4.3% | 61.3% | 23.0% |
| F4 | 1.8% | 2.0% | 67.8% | 28.4% |
Fig. 2.6: Table showing Percentage of each Footway Category in each Condition Band
Reporting by the Public
For a number of years, the Council has taken part in the National Highway and Transport (NHT) annual survey. This is a public perception survey completed with a statistically representative number of residents for each authority taking part. The graph in the figure below shows the results for overall satisfaction with Pavements and Footways. Although overall satisfaction remains slightly above the 50% level, it indicates that public perception has remained above average in Devon compared with other Councils.
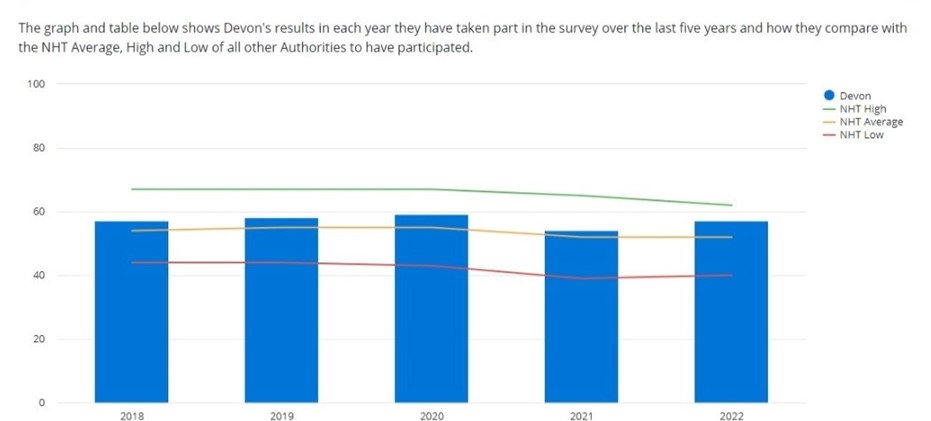
Fig. 2.7: NHT survey results. KBI 11 – Pavements and Footpaths (Overall)
4. Maintenance Strategy
4.1 Creation of a new asset
New footways are created in several ways including the following:
- When new highway infrastructure such as carriageways are built,
- As part of development works under sections 38, and 278 of the Highway Acts 1980,
- As part of major housing developments, and
- As part of the strategic plan to encourage active travel.
4.2 Planned Maintenance
Programmed work includes the following:
- Replacing or renewal of defective slabs,
- Patching and replacing paving blocks or bricks,
- As part of slurry seal programme,
- As part of resurfacing or reconstruction programme, and
- Programmes created following regular inspections.
Treatment Options
Selection of treatment types will take into consideration the performance requirement of the asset both in terms of fitness for purpose for users, numbers of users and the projected deterioration profile, and what subsequent treatment type can be considered for future interventions.
Below are some examples of the treatment types for footways that the Council makes use of. The way the treatments are selected is indicated in Section 4.6 below.
- Footway Flexible Reconstruction,
- Footway Flexible Patching,
- Footway Flexible Resurfacing,
- Footway Slurry Seal,
- Footway Proprietary Treatments and Specialist Surfacing,
- Footway Flags Reconstruction,
- Footway Flags Resetting,
- Footway Paviour Reconstruction,
- Footway Paviour Resetting, and
- Cobbles.
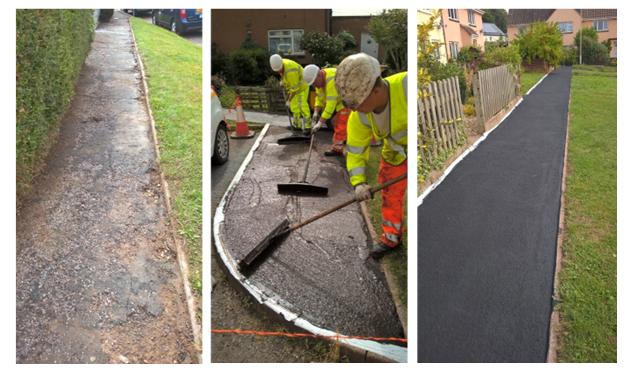
Fig. 2.8: Slurry seal being applied to a footway (Before, During and After)
4.3 Renewal or replacement
The Council will renew or replace footways on the following basis:
- Following recommendation from local teams.
- As part of Local Asset Capital Programme (LACP).
- Following inspection and other defect reports.
- As result of changes to the Council’s strategic plans.
- Availability of funding.
4.4 Decommissioning of the asset
It is rare for footway assets to be decommissioned. This usually only occurs when roads are closed (or ‘stopped up’) because of major highway improvements or realignments. As a result of this, it is possible that sections of footway may fall into disuse or be returned to the landowner of the subsoil beneath the highway.
4.5 Maintenance Service Standards
Maintenance Service Standards were developed which define the Council’s provision for each asset type based on four levels:
- Provision of safety related issues only,
- Safety and Minimal Level of Serviceability,
- Safety and Intermediate Level of Serviceability, or
- Safety, and Serviceability and Sustainability.
These are defined in simple terms of what a road user could expect to see. This is especially useful in understanding the level of service in the context of what is affordable. Maintenance Standards are informed by condition assessments if available, against the stated Levels of Service in the Plan and the Council’s Strategic Plan 2021-2025 to encourage sustainable travel and transport.
| Footways | Provision of safety related issues only | Provision of safety and minimal level of serviceability | Provision of safety and intermediate level of serviceability | Provision of safety, serviceability and sustainability issues |
| What a footway user would see | Surface uneven and rutted with multiple localised repairs. Some defects of a non-safety nature.
| Surface irregular. Limited evidence of recent resurfacing. Significant localised repairs. Some defects of a non-safety nature. | Surface generally well maintained. Limited localised repairs. Some defects of a non-safety nature. | Surface regular with very few localised repairs. Minimal defects of a non-safety nature. |
| Maintenance standards and activities. | Undertake limited condition surveys to inform of network valuation. Undertake minimum safety inspections and react to defects that represent an immediate or imminent hazard only. No routine or programmed maintenance.
| Undertake condition surveys to inform of network valuation & support asset management prioritisation within available budget. Undertake safety inspections and react to defects that represent an immediate or imminent hazard. Repairs mostly consisting of patching & dressing or spray patching. Limited routine & programmed maintenance dependant on budgets.
| Undertake condition surveys to inform of network valuation & to support asset management prioritisation within available budget. Undertake safety inspections and react to defects that represent an immediate or imminent hazard. Reduced routine & programmed maintenance. Repairs are usually patching & surface dressing with surfacing limited to high stress areas. | Undertake condition surveys to inform of network valuation. Some serviceability inspections to support the asset management approach for allocating resources for the management, operation, preservation, and enhancement of the carriageway to meet the needs of current and future customers. Routine & programmed maintenance undertaken to optimise future condition and to reduce the backlog of maintenance requirements. |
| Impact | Decline in structural residual life with increase in structural defects such as potholes, major cracking and rutting. | Decline in structural residual life with increase in structural defects such as potholes, major cracking and rutting. | Some structural defects such as potholes, cracking & rutting. | Minimal defects |
Fig. 2.9: Maintenance Standards for Footways
As pressures on budgets continue and become more restrictive, the ability of the Council to provide a service above that of safety is going to be severely impacted. This is illustrated in the tables below. Figure 2.10 illustrates the maintenance standards that can be expected on footways with current funding levels.
| Footway Hierarchy / Environment | Footway |
| F1 Rural | |
| F2 Rural | |
| F3 Rural | |
| F4 Rural |
| Footway Hierarchy / Environment | Footway |
| F1 Urban | |
| F2 Urban | |
| F3 Urban | |
| F4 Urban |
Fig. 2.10: Maintenance Standards expected on Footways
4.6 Treatment Selection
In conjunction with the maintenance service standards, the Council has also produced a treatment matrix which acts as a guide to the most appropriate materials/treatments to be used on the various categories of footway.
The matrix can be seen in Fig. 2.11 below.
The matrix uses a colour coding system to indicate the approved treatments for each category:
- Green = Approved treatment,
- Amber = Can be used with approval from Asset team, and
- Red = Not to be considered on category of carriageway.
| Note | Safety defects to safety policy. Safety defect repair must take priority and may, in some circumstances override the content of this schedule. | To be read in conjunction with the current policy and term maintenance contract specification | Approved DHB 9th July 2015 Version 3.1 | ||||||||||||
| National Category | Devon Maintenance Category | Footway Flexible Reconstruction | Footway Flexible Patching | Footway Flexible Resurfacing | Footway Slurry Seal | Footway Proprietary Treatments and Specialist Surfacing | Footway Flags Reconstruction | Footway Flags Resetting | Footway Paviour Reconstruction | Footway Paviour Resetting | Cobbles | ||||
| 1(a) / 1 | F1 | Type F1 or Type F2 | Type F1A or Type F9 | Type F1A or Type F9 | e.g.
high friction or coloured surfacing, any form of imprinting into the surface or stick on surfacing | Standard size flags or PS/B or PS/C | Standard flags or PS/A | BP/1 | BP/1 | CP/1 or CP/2 | |||||
| 2 | F2 | Type F1 or Type F2 | Type F1A or Type F9 | Type F1A or Type F9 | Clause 918 | Standard size flags or PS/B or PS/C | Standard flags or PS/A | BP/1 | BP/1 | CP/1 or CP/2 | |||||
| 3 | F3 | Type F1 or Type F2 | Type F1A or Type F9 | Type F1A or Type F9 | Clause 918 | Standard size flags or PS/B or PS/C | Standard flags or PS/A | BP/1 | BP/1 | CP/1 or CP/2 | |||||
| 4 | F4 | Type F1A or Type F9 | Type F1A or Type F9 | Clause 918 | Standard flags or PS/A | BP/1 | CP/1 or CP/2 | ||||||||
| Only in exceptional circumstances and after Materials Laboratory approval | |
| Permissible option | |
| Flags, paviours, and cobbles replaced outside Conservation areas with flexible materials after consultation with stakeholders |
Fig. 2.11: Treatment Selection for Footways
5. Levels of Service and Investment Strategy
5.1 Levels of Service
The detailed levels of service for the footway asset have been defined in a Levels of Services Table which shows how they each link to the core service levels. When developing the footway levels of service, it was important to not only consider statutory responsibilities but to also take account of customer satisfaction and views of the Council. Budget constraints also help determine levels of service as it is important to manage the expectations of service delivery standards.
| Measure | Responding to the climate emergency
| Be ambitious for children and young people
| Support sustainable economic recovery
| Tackle poverty and inequality
| Improve health and wellbeing
| Help communities to be safe, connected and resilient
|
| Inspect footways and cycleway at set frequencies and prioritise repairs to safety defects in accordance with the Highway Safety Inspection Policy. | √ | √ | √ | √ | √ | √ |
| Using condition data and community feedback to develop and deliver an annual programme of footway and cycleway maintenance repairs. | √ | √ | √ | √ | √ | √ |
Fig. 2.12: Levels of Service
5.2 Investment strategy
Although a robust asset deterioration model exists for carriageways a similar model has not been developed for footways. This is in line with the relatively low risk and low historical spend on footways however development of a less complex model may assist in determining budget splits for footway spending. Footway spending is based more on historical spend assessments and on network length.
6. Programme Development
6.1 Identifying Schemes for an Initial Works Programme
When identifying schemes for an initial Works Programme, the following are some of the factors that are considered:
- Local needs identified by the Neighbourhood Teams as part of the Local Asset Capital Programme (LACP) process.
- Inspection reports from Neighbourhood officers and Data Technicians.
- Following complaints or claims, and
- Programmed or planned asset renewal works.
This is represented in the diagram below.
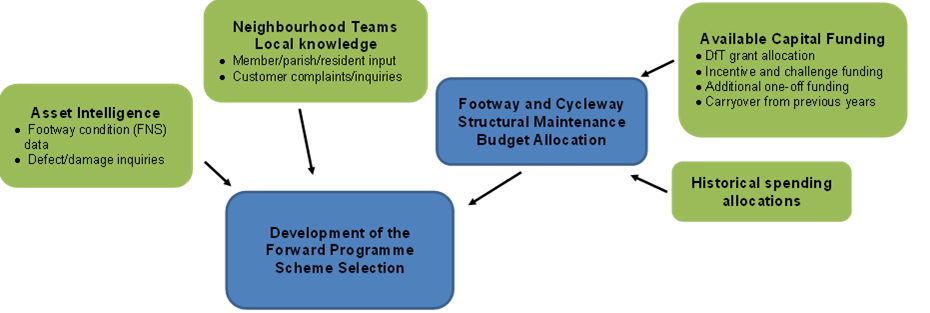
Fig. 2.13: Identifying Schemes for an Initial Works Programme
6.2 Selecting and Optimising Schemes for the Forward Programme
Funding for footway improvement schemes is available through the LACP programme. Sites are considered alongside other schemes in the LACP programme, taking footway hierarchy into account.
7. Risks
Issues which may prevent asset management objectives being achieved include:
- Funding and overall prioritisation are the main challenge in achieving our maintenance objectives. Currently there is insufficient investment overall so footways are likely to deteriorate if funding is not increased.
- Availability of suitable surfacing materials with correct Polished Stone Values (PSV).
- Climate change with more rainfalls and frequent storm events may cause accelerated damage to our footways.
- Increasing costs of materials and labour.
Other risks with funding availability to maintain footways include:
- Financial claims for compensation, increased complaints, public dissatisfaction, and damage to the reputation of the council.
8. Improvement Actions
Alongside the Highway Infrastructure Asset Management Plan, this Annex is a live document. It will be subject to continuous improvement and ongoing development with input from Council Officers and Stakeholder feedback. Areas for improvement are identified within the Annex which are summarised as Improvement Actions in this section. These Actions are aligned with Strategic Goals and are assessed as part of a wider cross-asset prioritisation process that prioritises their implementation taking account of the framework of funding and resource availability.
The actions that have been identified as being required to ensure the Footways asset management objectives are achieved are:
- Development of a risk-score matrix to better inform and justify decision making.
- Review use of latest technology for improved data collection.
- Develop an investment strategy for the footway asset.
Version Control
| Version | Date | Summary of Changes |
| 1.0 | 12 April 2023 |