May 2024
Contents
1. Introduction
1.1 National and local waste planning policy (in the form of the National Planning Policy for Waste and the Devon Waste Plan) require that waste materials are managed sustainably through application of the ‘waste hierarchy’, which identifies disposal of waste through landfilling as the least preferable option. While policy and fiscal measures encourage the reuse, recycling and recovery of waste, including inert materials generated through construction, demolition and excavation activity (an explanation of terms is provided in section 20), disposal continues to be an option that is pursued, notably for materials such as subsoils that have little value for alternative uses.
1.2 As indicated in section 3 of this Statement, the pattern of inert waste disposal has evolved over the last 20 years due to changing economic and regulatory circumstances, to a position where Devon currently has four operational inert landfill sites, each of which also undertakes recycling of waste. Due to the limited spatial distribution of these sites and their decreasing capacity, Devon County Council has recently received a number of pre-application enquiries and planning applications to develop new landfill capacity.
1.3 To inform consideration of future planning applications for inert landfill capacity, this Position Statement will review available data for arisings and management of inert waste materials1 and capacity of inert landfill sites2 in Devon. Following publication of waste data for 2022, the Statement has been updated, and will be further revised as new data become available.
1.4 Section 2 of this Position Statement explains relevant terms and concepts, while Section 3 reviews the pattern of inert waste landfill in Devon to the time of adoption of the Devon Waste Plan in 2014. An outline of the approach of the Devon Waste Plan to the management of inert waste is provided in Section 4, together with the findings of subsequent monitoring of the Plan.
1.5 Section 5 of this Statement provides a detailed account of the pattern of inert waste generation and management in Devon since adoption of the Devon Waste Plan at a general and site-specific level and considers factors that may have influenced this pattern, with particular attention to the landfilling and recovery of inert waste.
1.6 A review of available inert landfill capacity is provided in Section 6, including consideration of operational facilities and other sites that have received planning permission but which are not yet operational. Section 7 then models a range of potential scenarios for future requirements for
inert landfill capacity.
1.7 Finally, Section 8 reviews the preceding sections and provides some
concluding observations.
1 Data obtained from the Environment Agency’s annual Waste Data Interrogator datasets at https://www.data.gov.uk/dataset/d8a12b93-03ef-4fbf-9a43-1ca7a054479c/2021-waste-datainterrogator
2 Data obtained from the Environment Agency’s annual Remaining Landfill Capacity datasets at https://www.data.gov.uk/dataset/237825cb-dc10-4c53-8446-1bcd35614c12/remaininglandfill-capacity
2. Terms and Concepts Used in the Position Statement
2.1 Waste materials can be classified by reference to their physical
properties or their source, while there is a hierarchy of management
methods for waste.
2.2 There are three categories of waste materials that can be defined in
terms of their physical properties:
Inert: defined in the Devon Waste Plan as “waste which is not
chemically or biological reactive and will not decompose”.
Non-hazardous: waste materials that are not hazardous, including
inert materials.
Hazardous: defined in the Devon Waste Plan as “waste that is harmful
to human or animal health or the environment, either immediately or
over an extended period of time”.
2.3 Waste materials can also be classified by reference to their source, and the three main categories are:
Local authority collected waste [LACW]: waste collected and
managed by local authorities, including waste collected from
households and some other premises, and waste taken to the County
Council’s Household Waste Recycling Centres.
Commercial and industrial waste [CIW]: waste from premises used
mainly for the purposes of trade, business, sport or entertainment, or
generated during industrial processes.
Construction, demolition and excavation waste [CDEW]: waste
generated during construction, demolition and excavation processes,
including masonry, wood, subsoil, rubble and surplus building materials
and packaging.
2.4 While much inert waste is generated through CDEW, the two terms are not interchangeable. Inert waste can be classed as LACW or CIW, for example rubble that is taken by a member of the public to a household
waste recycling centre, or broken items produced by a brick or
ceramics manufacturer. It is also the case that CDEW will include a
range of biodegradable materials such as timber, plastics and
vegetation that cannot be classed as ‘inert’.
2.5 For all waste materials, the waste hierarchy provides the following
means of managing waste, in decreasing order of preference:
- minimisation of waste
- reuse
- recycling
- recovery
- disposal
2.6 Looking specifically at inert waste, there is scope to minimise its generation through careful design (including limiting excavation of slopes), specification and procurement. Harder inert waste materials such as concrete, stone and bricks can be crushed to produce recycled aggregates, while soils are capable of recovery as fill materials, for example in quarry restoration or to raise site levels to facilitate development. The final option, which should be limited to materials for which recycling or recovery is impractical, is disposal through landfill.
2.7 In calculating the volume of inert waste by reference to its weight, this Position Statement will use the conversion factor of 1.5 [i.e., 1 cubic
metre = 1.5 tonnes] provided in HMRC’s Excise Notice LFT1: A
General Guide to Landfill Tax3.
3 Available at https://www.gov.uk/government/publications/excise-notice-lft1-a-general-guide-to-landfill-tax
3. The Pattern of Inert Waste Landfill in Devon 2000 to 2014
3.1 Since the start of this century, the pattern of inert landfill provision in Devon has changed considerably in terms of the number and size of facility and the activity undertaken.
3.2 In 2000, Devon had around 30 operational inert landfill sites distributed around the county, including in areas away from the main settlements. The majority of these sites were small and serving a limited catchment area, and most solely undertook disposal of inert materials with no segregation or recycling of the waste.
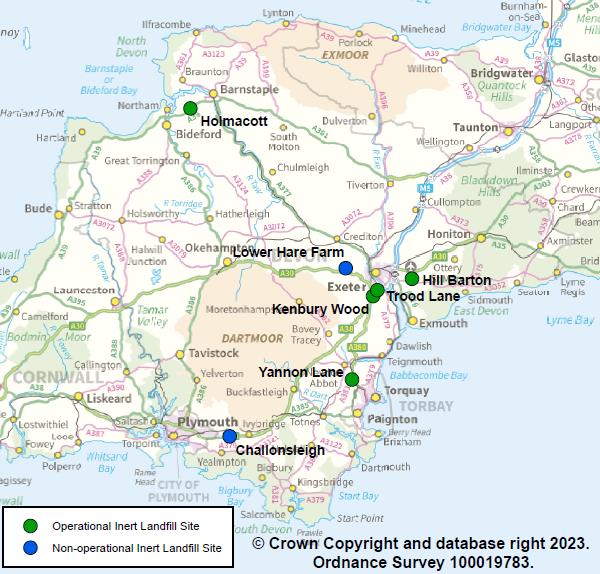
3.3 By 2003, around half of these sites had closed, often due to the introduction of new licensing arrangements by the Environment Agency, and some remaining sites closed in the years to 2010. By the time of adoption of the Devon Waste Plan in December 2014, the number of operational inert landfill sites had reduced to five, each of which had recycling plant for the screening and crushing of materials:
- Hill Barton, Clyst St Mary
- Holmacott, Instow
- Kenbury Wood, Kennford
- Trood Lane, Exeter
- Yannon Lane, Kingskerswell
4. The Devon Waste Plan
4.1 As indicated above, the Devon Waste Plan [DWP] was adopted in December 2014, following an iterative process of evidence gathering, consultation and inquiry. To inform this Position Statement, it is useful
to review the data and assumptions that underpinned the Plan’s approach to the management of inert waste.
4.2 Chapter 2 of the DWP presented waste data in terms of the source of materials [LACW / CIW / CDEW] rather than their physical properties [inert / non-hazardous / hazardous]. Although acknowledging that limited data existed, paragraph 2.3.15 of the DWP indicated that, from 2001 to 2005, the annual quantity of CDEW in Devon declined from 2.46 million tonnes to 1.95 million tonnes but, over the period 2006 to 2008, increased to 2.06 million tonnes. Subsequent lower annual figures of CDEW were recorded for 2009 [1.34 million tonnes and 2010 [1.2 million tonnes], with Table 2.1 of the DWP indicating that 87% of the latter year’s materials being recycled and 13% being disposed of.
4.3 The DWP provided the following forecasts for the annual quantity of
CDEW generated over milestones for the Plan period, with the assumption made that the proportion being disposed of would reduce from 13% to 10% over this period4 :
2011 1,175,500 tonnes
2016 1,035,700 tonnes
2021 912,600 tonnes
2026 804,000 tonnes
2031 708,500 tonnes
Based on the target in Policy W5 of the DWP of 10% of CDEW requiring disposal, it was anticipated that the disposal requirement in 2031 would amount to 70,800 tonnes.
4.4 It was forecast that, over the DWP period to 2031, the disposal need would amount to 1.92 million cubic metres. As available capacity in 2011 was 2.68 million cubic metres, it was anticipated that there was no overall requirement for inert landfill capacity over the Plan period.
Notwithstanding the availability of adequate disposal capacity, Policy W7 Waste Disposal) of the DWP allowed for new capacity for the disposal of inert waste where required to achieve a significant reduction in transportation distances, and where materials being disposed of are limited to non-recyclable waste.
4.5 Following adoption of the DWP, annual Monitoring Reports5 have been published to monitor the extent to which the Plan’s objectives and targets have been met. In respect of inert landfill capacity, Indicator 2.3 monitors the remaining capacity against the forecast requirements, and states that immediate review of Plan required if capacity falls below target”.
4.6 From 2017/18 onwards, the Monitoring Reports have noted for Indicator 2.3 that inert landfill capacity had fallen below the target for the year being reported on:
2017/18: a shortfall of 39,000 cubic metres
2018/19: a shortfall of 138,000 cubic metres
2019/20: a shortfall of 320,000 cubic metres
2020/21: a shortfall of 300,000 cubic metres
4.7 The monitoring reports from 2019/20 have noted the planning permissions for new inert landfill sites that have been granted [see paragraphs 6.13-6.14 of this Statement], the capacity at which has not been included for Indicator 2.3 as they are not yet operational.
4.8 A review of the DWP was completed in September 20206, following consideration of the annual Monitoring Reports, consistency of the Plan with national policy, a review of the spatial strategy, the implications of the Climate Emergency Declaration and engagement with other planning authorities.
4.9 In relation to Policy W7 (Waste Disposal), the review noted that “in respect of inert landfill, available capacity has been below the target for last two years” but indicated that “proposals for additional landfill capacity have been forthcoming”. The review therefore concluded that “Policy W7 provides an effective framework to support the positive determination of planning applications for waste disposal” and therefore did not need to be updated.
4 As explained in section 4.4 of Waste Topic Paper 1 (July 2014) available in Evidence Documents at https://www.devon.gov.uk/planning/planning-policies/minerals-and-waste-policy/devon-waste-plan/
5 Monitoring reports available on the ‘Monitoring’ tab at https://www.devon.gov.uk/planning/planning-policies/minerals-and-waste-policy/
6 The report of the review and supporting evidence are available under Item 106 at Agenda for Development Management Committee on Wednesday, 23rd September, 2020, 2.15 pm – Democracy in Devon
5. Inert Waste Management in Devon 2014-2022
5.1 The Environment Agency’s annual Waste Data Interrogator datasets provide data on the quantities of waste materials that are managed at facilities in Devon, and these are published in the Autumn for the preceding calendar year (so the dataset for 2023 will be published in Autumn 2024).
The Quantity of Inert Waste Generated and Managed in Devon
5.2 Table 1 presents data for the total quantity of inert waste that was generated and managed in Devon from the year of adoption of the Devon Waste Plan, 2014, to the latest year for which data are available, 2022. The quantity of waste that is generated in Devon will include some materials that are moved out of Devon for management, while the quantity of waste managed in Devon will include materials that were generated outside the county, and the final two columns of Table 1 show the net balance of these movements.
| Year | Total Inert Waste Generated in Devon (tonnes) | Total Inert Waste Managed in Devon (tonnes) | Net Inert Waste Imported to Devon (tonnes) | Net Inert Waste Exported from Devon (tonnes) |
|---|---|---|---|---|
| 2014 | 1,014,930 | 1,107,563 | 92,633 | |
| 2015 | 1,248,364 | 1,285,561 | 37,197 | |
| 2016 | 1,128,724 | 1,204,399 | 75,675 | |
| 2017 | 1,319,187 | 1,377,353 | 58,166 | |
| 2018 | 1,512,376 | 1,713,416 | 201,0407 | |
| 2019 | 1,690,969 | 1,712,498 | 21,529 | |
| 2020 | 1,527,770 | 1,519,485 | 8,285 | |
| 2021 | 1,203,431 | 1,131,975 | 71,456 | |
| 2022 | 1,187,484 | 1,053,064 | 134,420 |
5.3 Table 1 indicates that Devon was a net importer of inert waste from 2014 to 2019, with the quantity of waste managed within the county being greater than the amount that it generated. From 2020, more inert waste has been taken from Devon than has been imported to it, with the quantity exported increasing each year. The level of net inert waste exported from Devon in 2022 exceeded imports for all but one of the years from 2014 to 2019, with 32,675 tonnes being exported for landfill.
5.4 As indicated in paragraph 4.3, the Devon Waste Plan assumed a steady downward trend in the quantity of CDEW over the Plan period. While CDEW and inert waste are not interchangeable terms, it would be expected that each category would show a similar trend; however, as indicated in Figure 2, actual quantities of inert waste generated and managed in Devon vary significantly from the DWP’s predicted arisings of CDEW.
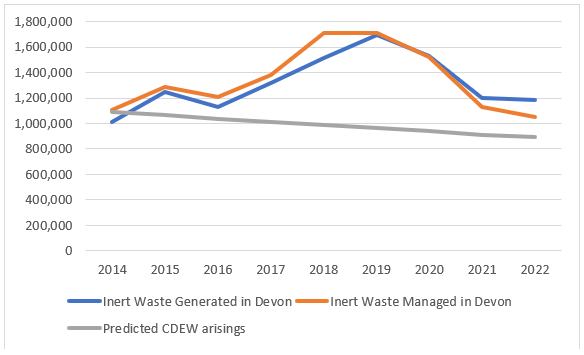
5.5 Figure 2 shows significantly higher levels of inert waste being generated and managed in Devon in comparison with predicted levels of CDEW, particularly during 2018 to 2020, although the difference was considerably lower in 2021 and 2022. Two possible explanations for this variance are:
- greater quantities of inert waste arising from outside Devon may have been managed within the county than had been expected; and/or
- the level of construction activity in Devon during this period may have been greater than had been anticipated in preparing the DWP, resulting in higher levels of inert waste being generated.
5.6 As indicated in Table 1, Devon was a net importer of inert waste up to 2019, but with imports exceeding exports from 2020 onwards. To provide greater detail on the origins of the waste managed in Devon, Table 2 shows the proportions of inert waste materials managed within Devon by their origin [excluding waste managed within Devon for which the origin was uncoded]:
| Location | 2014 | 2015 | 2016 | 2017 | 2018 | 2019 | 2020 | 2021 | 2022 |
|---|---|---|---|---|---|---|---|---|---|
| Devon | 90.5 | 90.4 | 91.5 | 86.9 | 91.7 | 93.7 | 94.5 | 94.7 | 94.1 |
| Plymouth | 6.0 | 7.6 | 5.6 | 9.5 | 3.8 | 2.9 | 3.3 | 3.1 | 2.3 |
| Torbay | 2.4 | 1.0 | 1.4 | 2.3 | 1.6 | 1.2 | 1.0 | 0.9 | 0.8 |
| Elsewhere | 1.1 | 1.0 | 1.5 | 1.2 | 2.9 | 2.1 | 1.1 | 1.3 | 2.8 |
| Dev/Ply/Tor | 98.9 | 99.0 | 98.5 | 98.8 | 97.1 | 97.9 | 98.9 | 98.7 | 97.2 |
5.7 Table 2 indicates that the proportion of inert waste managed at facilities within Devon has consistently been above 90%, apart from 2017 when waste from Plymouth accounted for a higher proportion than in other years. As neither Plymouth nor Torbay have operational inert waste recycling or landfill facilities, it is reasonable to expect that their inert waste will be managed within Devon, and the final row of Table 2 confirms that almost all of the inert waste managed in Devon arises within Devon, Plymouth and Torbay.
5.8 Figure 2 shows that the years with the highest levels of inert waste managed in Devon were 2018 and 2019, which were also two of only three years when the proportion of inert waste managed in Devon but generated outside of Devon, Plymouth and Torbay exceeded 1.5%. However, the marginal degree of increase over the other years was not significant enough to explain the increases in total tonnage in those three years in comparison with other years.
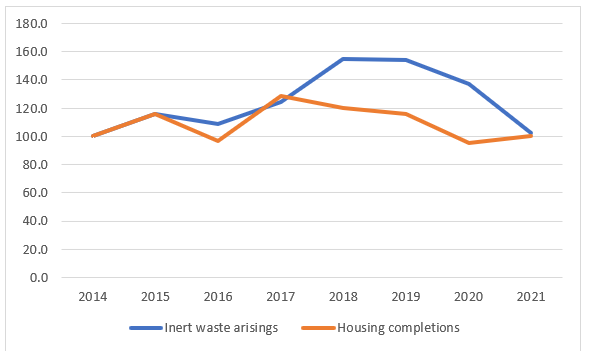
5.9 The rate of construction activity that will influence the generation of inert waste is difficult to quantify, but a proxy measure is the rate of housing completions in Devon, shown in Table 3:
| 2014/15 | 2015/16 | 2016/17 | 2017/18 | 2018/19 | 2019/20 | 2020/21 | 2021/22 |
|---|---|---|---|---|---|---|---|
| 4,620 | 5,350 | 4,471 | 5,932 | 5,556 | 5,362 | 4,394 | 4,467 |
5.10 There are limitations with using housing completions as a proxy for construction activity as a whole, as considerable quantities of inert waste will be generated by other forms of development including commercial buildings and highway schemes. In addition, large housing schemes may see most waste generated through excavation at the commencement of a scheme, while completion of houses may be recorded in a subsequent year.
5.11 Notwithstanding these limitations, Figure 3 provides a comparison of inert waste arisings managed in Devon and housing completions, using 2014 as a base year8. As waste arisings (January-December) and housing completions (April-March) are collected for differing periods, housing completion figures have been allocated to the calendar year that accounts for the larger proportion (e.g., 2014/15 housing completions have been allocated to 2014).
5.12 Waste arisings and housing completions followed a similar trajectory to 2017 but, while housing completions then declined, the quantity of inert waste managed in Devon continued to rise to 2018 and 2019 before dropping subsequent years. The implication of these trends is that housing completion levels provide a partial explanation for the pattern of inert waste generation, but that other factors – potentially other construction sectors – also influence levels of inert waste management.
Inert Waste Landfill in Devon
5.13 As well as providing figures for the total quantity of inert waste that was managed in Devon from 2014 to 2022, Table 4 states the amounts and proportions that were landfilled. As well as including disposal at inert landfill sites, Table 4 includes inert waste that was disposed of at the three non-hazardous landfill sites in Devon as these account for a significant proportion of landfilled inert waste, particularly in 2015 to 2017. Non-hazardous landfill sites routinely use inert waste materials to temporarily cover the biodegradable waste to protect it from scavengers, while the restoration stage of non-hazardous landfill sites requires significant volumes of inert waste as capping materials.
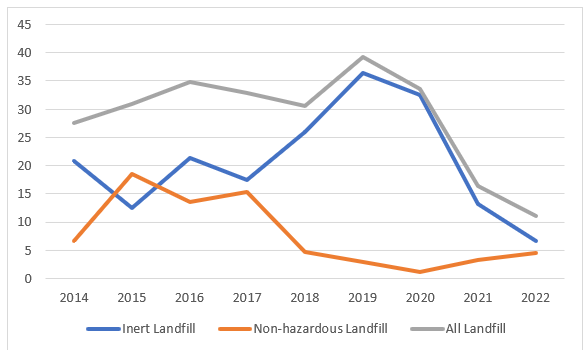
5.14 As noted in paragraph 4.3, the DWP assumed that the proportion of CDEW that would be disposed of through landfill would reduce to 11% in 2021 and 10% by 2031. However, that assumption has been proven to be overly optimistic prior to 2022, as indicated in Figure 4 which shows the proportions of inert waste being landfilled in Devon.
5.15 The proportion of inert waste that is landfilled has consistently exceeded 25% until 2021, with the proportion accounted for by non-hazardous landfill sites reducing significantly after 2017. While the proportion of inert waste disposed of at inert landfill sites remained broadly consistent to 2017, it increased significantly thereafter, peaking at 36% in 2019 before dropping back to 13% in 2021 and just under 7% in 2022.
Table 4: Inert Waste Landfill in Devon 2014 to 2022
| Year | Total quantity of inert waste managed in Devon (tonnes) | Total inert waste disposed of at all landfill sites (tonnes) | Inert waste disposed of at inert LF sites (tonnes) | Inert waste disposed of at non-haz LF sites (tonnes) | % of inert waste disposed of at inert LF sites | % of inert waste disposed of at non-haz LF sites | % of inert waste disposed of at all LF sites |
|---|---|---|---|---|---|---|---|
| 2014 | 1,107,563 | 305,724 | 231,762 | 73,962 | 20.9 | 6.7 | 27.6 |
| 2015 | 1,285,561 | 397,264 | 159,184 | 238,080 | 12.4 | 18.5 | 30.9 |
| 2016 | 1,204,399 | 419,241 | 256,592 | 162,649 | 21.3 | 13.5 | 34.8 |
| 2017 | 1,377,353 | 452,424 | 240,123 | 212,301 | 17.4 | 15.4 | 32.8 |
| 2018 | 1,713,416 | 522,779 | 443,744 | 79,035 | 25.9 | 4.6 | 30.5 |
| 2019 | 1,712,498 | 672,072 | 622,635 | 49,437 | 36.4 | 2.9 | 39.3 |
| 2020 | 1,519,485 | 510,486 | 493,334 | 17,152 | 32.5 | 1.1 | 33.6 |
| 2021 | 1,131,975 | 185,886 | 149,307 | 36,579 | 13.2 | 3.2 | 16.4 |
| 2022 | 1,053,064 | 117,209 | 70,037 | 47,172 | 6.6 | 4.5 | 11.1 |
5.16 Comparison with Figure 2 shows that the highest levels of disposal at inert landfill sites in 2018 to 2020 coincided with the peak levels of total inert waste managed. Potential reasons for this are that the proportion of inert waste in those years that was suitable for recycling or recovery reduced, and/or that the increased quantity of inert waste exceeded available capacity for recycling and recovery, resulting in the increased proportion being landfilled.
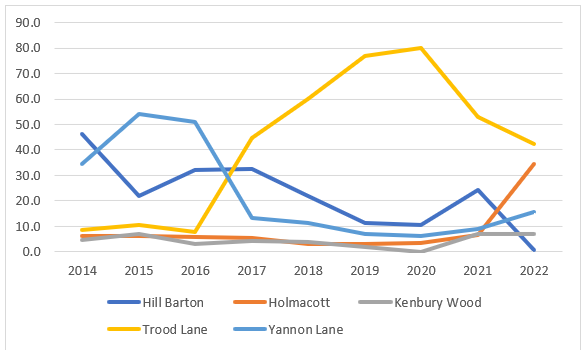
5.17 The Waste Data Interrogator datasets allow inputs to individual waste management sites to be identified, and Table 5 shows the annual inputs to the five inert landfill sites in Devon that have been operational between 2014 and 2022.
| Year | Hill Barton | Holmacott | Kenbury Wood | Trood Lane | Yannon Lane | Total |
|---|---|---|---|---|---|---|
| 2014 | 107,456 | 14,300 | 10,676 | 19,673 | 79,657 | 231,762 |
| 2015 | 34,762 | 10,175 | 11,393 | 16,607 | 86,247 | 159,184 |
| 2016 | 82,628 | 15,190 | 7,870 | 19,630 | 131,275 | 256,593 |
| 2017 | 78,294 | 12,720 | 10,297 | 107,179 | 31,632 | 240,123 |
| 2018 | 96,690 | 14,220 | 17,704 | 265,505 | 49,625 | 443,744 |
| 2019 | 70,222 | 19,197 | 10,994 | 478,393 | 43,393 | 622,635 |
| 2020 | 51,155 | 16,677 | 0 | 394,877 | 30,625 | 493,334 |
| 2021 | 36,225 | 10,000 | 10,531 | 79,309 | 13,242 | 149,307 |
| 2022 | 378 | 23,924 | 4,875 | 29,545 | 10,830 | 69,552 |
5.18 While Holmacott and Kenbury Wood have seen annual inputs of inert waste remaining fairly consistent over this period, the other sites have shown greater variation. In particular, Trood Lane has seen its annual inputs rise from around 20,000 tonnes during 2014-2016 to a peak of almost 480,000 tonnes in 2019, and accounting for 80% of Devon’s inputs in 2020. It is understood that this increase at Trood Lane was to facilitate meeting Teignbridge District Council’s requirement for Suitable Alternative Natural Green Space allied to the nearby housing development. A notable feature of the data for 2022 is the major reduction in landfill inputs at Hill Barton.
5.19 Figure 5 shows the proportions of Devon’s inert waste landfill inputs accounted for by individual sites.
Inert Waste Recovery
5.20 Paragraph 2.6 highlighted the scope for inert waste to be managed through recovery, which sits higher in the waste hierarchy than landfill. Most commonly, recovery involves the utilisation of materials such as subsoils in reclamation (including quarry restoration) or construction projects, which reduces the need to use non-waste materials. Recovery of waste materials is therefore a more sustainable means of managing inert waste than landfilling, although the scope for recovery relies on the availability of suitable reclamation or construction projects requiring materials in a location convenient to where waste materials are being generated and in a suitable timeframe.
5.21 Data for waste recovery operations can be extracted from Waste Data Interrogator by identifying operations that benefit from an Environmental Permit for the use of waste for recovery, reclamation or construction purposes. While smaller scale recovery operations can be exempt from the need for an Environmental Permit, and therefore are not included in Waste Data Interrogator, it is considered that the data shown in Table 6 are of benefit in identifying trends and allowing comparison with inert landfill data.
| Year | Total quantity of inert waste managed in Devon (tonnes) | Total inert waste recovered (tonnes) | % of inert waste recovered | % of recovered waste used in quarry restoration |
|---|---|---|---|---|
| 2014 | 1,107,563 | 272,348 | 24.6 | 25.0 |
| 2015 | 1,285,561 | 266,693 | 20.7 | 60.0 |
| 2016 | 1,204,399 | 118,745 | 9.9 | 12.1 |
| 2017 | 1,377,353 | 83,958 | 6.1 | 31.9 |
| 2018 | 1,713,416 | 299,515 | 17.4 | 86.8 |
| 2019 | 1,712,498 | 128,488 | 7.5 | 78.0 |
| 2020 | 1,519,485 | 114,919 | 7.6 | 93.6 |
| 2021 | 1,131,975 | 192,122 | 17.0 | 88.9 |
| 2022 | 1,053,064 | 244,849 | 23.3 | 85.1 |
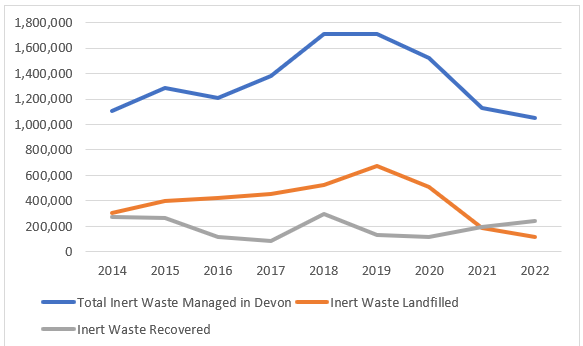
5.22 The quantity of inert waste managed through recovery permits has fluctuated over the period being considered, with a low point of 84,000 tonnes in 2017 before a peak of just under 300,000 tonnes the following year, and then rising to 245,000 tonnes in 2022. This variation reflects the shorter-term nature of recovery operations in comparison with inert landfill sites, with the latter often operating over a decade or more, while recovery operations such as quarry restoration and construction projects will typically be limited to two or so years.
5.23 As noted in the final column of Table 6, quarry restoration has increasingly accounted for the major part of recovery operations in recent years, with around 80-90% of inert waste recovery being associated with quarry restoration from 2018. One potential factor in this increase is that other forms of reclamation and construction projects have found it more difficult to obtain the necessary Environmental Permit due to a regulatory ‘tightening up’ around 2016 that introduced additional tests for recovery permits.
5.24 Quarries that enabled recovery of inert waste in significant quantities for restoration work in 2022 were Zig Zag Quarry, near Newton Abbot, and Steer Point at Brixton, with these accounting for just over 200,000 tonnes.
5.25 Figure 6 shows the comparative levels of inert waste landfill and recovery since adoption of the Devon Waste Plan.
7 The significantly higher net importation figure for 2018 is an anomaly that is explained by the data source (Waste Data Interrogator) having a much higher figure (186,764 tonnes) for uncoded waste originating within the South West region and managed in Devon in comparison with other years. It is likely that much of this waste originated within Devon and, if it had been apportioned to Devon, would have had the effect of reducing the gap between the ‘generated’ and ‘managed’ columns.
8 Figure 3 has not been updated since the original (September 2023) version of the Position Statement as not all housing completion data for 2022/23 are yet available
6. Inert Landfill Capacity
6.1 As indicated in paragraph 4.4, the Devon Waste Plan assumed that available inert landfill capacity at the time of the Plan’s adoption would be sufficient for the life of the Plan to 2013, although Policy W7 acknowledges that new capacity may be justified to address imbalances in the location of capacity to minimise transportation distances for waste materials.
6.2 Data for the remaining capacity for landfill sites are published annually by the Environment Agency and are available for 2015 onwards. Figure 7 shows the available capacity on 31 December in each year from 2015 to 2021, distinguishing between capacity at operational sites and the additional capacity available at sites that are not yet operational.
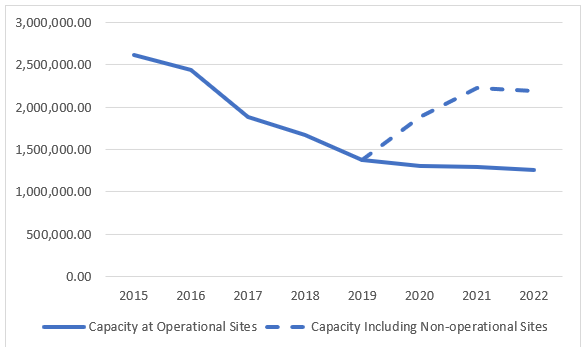
6.3 Figure 7 indicates that capacity at the five operational landfill sites has reduced from 2.62 million cubic metres at the end of 2015 to 1.26 million cubic metres at the end of 2022, the most recent year for which data are available. Table 7 provides capacity data for the individual landfill sites, including the two non-operational sites that received planning permission in 2020 and 2021.
| Location | 2015 | 2016 | 2017 | 2018 | 2019 | 2020 | 2021 | 2022 |
|---|---|---|---|---|---|---|---|---|
| Hill Barton | 0.381 | 0.355 | 0.295 | 0.210 | 0.170 | 0.135 | 0.133 | 0.117 |
| Holmacott | 1.113 | 1.094 | 1.087 | 1.080 | 1.071 | 1.062 | 1.057 | 1.045 |
| Kenbury Wood | 0.512 | 0.506 | 0.121 | 0.113 | 0.107 | 0.107 | 0.102 | 0.100 |
| Trood Lane | 0.555 | 0.427 | 0.348 | 0.249 | 0.010 | 0.000 | 0.000 | 0.000 |
| Yannon Lane | 0.058 | 0.054 | 0.027 | 0.017 | 0.017 | 0.000 | 0.000 | 0.000 |
| Challonsleigh | 0.585 | 0.585 | 0.585 | |||||
| Lower Hare Farm | 0.350 | 0.350 | ||||||
| Total | 2.619 | 2.436 | 1.879 | 1.669 | 1.375 | 1.889 | 2.281 | 2.197 |
Current Status of Operational and Consented Inert Landfill Sites
Hill Barton
6.4 The inert landfill site at Hill Barton is currently operating under a planning permission [DCC/3677/2014] granted in January 2015 for the extension of the facility. This consent requires the cessation of landfill operations within 10 years of the date of the permission or upon achieving final levels, whichever is the sooner. In addition to landfilling, the operator also undertakes recycling of construction, demolition and excavation waste, while the wider Hill Barton site includes a range of other waste management activities including waste transfer, composting, energy recovery and incinerator bottom ash recycling.
6.5 The operator sought a screening opinion on the need for Environmental Impact Assessment [EIA] from the County Council for a potential further extension in 2020 [PRE/1462/2020] to provide 600,000 cubic metres of additional capacity, although this request has not yet led to submission of a planning application.
6.5 The site operator has indicated that Hill Barton is not currently accepting subsoil for landfill, and inputs to the landfill facility are limited to the residues of the site’s recycling operation. This is reflected in the very low figure for landfill inputs for 2022 in comparison with previous years recorded in Table 5.
Holmacott
6.6 This facility first received planning permission for inert landfill in 1990, and subsequent permissions for extensions were given in 1993 and
1994, the latter covering current landfill operations with an expiry date of 19th July 2025. The site also includes a recycling facility for construction, demolition and excavation waste and a transfer station.
6.7 The operator submitted a planning application in October 2023 for the consolidation of the existing planning permissions and a lateral extension of the landfill site to provide 575,000 cubic metres of additional capacity. In the supporting statement for the planning application it is indicated that the remaining capacity in May 2022, based on a site survey, was 475,000 cubic metres, less than half of the December 2022 capacity figure of the Environment Agency. A further survey in June 2023 provided a remaining capacity of 343,523 cubic metres.
6.8 It is unlikely that the site’s capacity reduced from the figure for end of 2021 in Table 6 to that surveyed in May 2022 due to the volume of waste landfilled in those five months, so the implication is that the Environment Agency’s capacity figures for this site are based on out-of- date calculations. If it is assumed that the end of 2022 capacity for Holmacott was 410,000 cubic metres [the mid-point between the May 2022 and June 2023 surveys], this would have the effect of reducing the total capacity for Devon to 1.604 million cubic metres.
Kenbury Wood
6.9 Planning permission for inert landfill was first granted in 1985, with the various planning permissions for the wider waste management facility being consolidated through a new permission in April 2017 [DCC/3868/2016] that required the cessation of landfilling in December 2036. That consolidating permission has subsequently been varied in February 2019 [DCC/4069/2018], July 2019 [DCC/4111/2019] and March 2021 [DCC/4173/2020], but none of these consents altered the expiry date for the landfill operation.
6.10 Kenbury Wood manages a wide range of wastes including dry recyclables and builders’ skips. While the site’s planning permission allows for up to 120,000 tonnes of waste materials to be delivered to the site in any one year, only a small proportion – in the region of 10,000 tonnes – is disposed of through landfill. The site’s operator does not manage bulk loads of subsoil, and inputs to the inert landfill facility are limited to the residues of the skip operations.
Trood Lane
6.11 The inert landfill facility at Trood Lane received planning permission in 1991, with permission given for its extension in 2005, and no expiry date was placed on either permission. A planning application [DCC/4275/2021] for retrospective and proposed landfilling of 350,000 m3 of inert waste at this site was approved in November 2023.
6.12 The Environment Agency dataset recorded a small remaining capacity of 42,222 cubic metres for Trood Lane at the end of 2022.
Yannon Lane
6.13 Landfilling of inert waste commenced at Yannon Lane in 1988, and subsequent permissions for extensions and revised levels were granted in 2001 and 2017, the most recent of which [DCC/4008/2017] approved revised final levels and imposed a deadline for completion of October 2022. The site has now ceased importing waste materials and has permanently closed.
Non-Operational Sites
6.14 Planning permission for landraising for 585,000 cubic metres of inert waste at Challonsleigh near Lee Mill, together with waste transfer and recycling operations was granted by Devon County Council in April 2020 [DCC/4038/2018], with variations to some of the conditions subsequently approved in July 2022 [DCC/4250/2021] and February 2023 [DCC/4324/2022]. Although a start has been made on implementation of the development, no importation of waste for landfill has yet commenced. An application to the Environment Agency for the necessary Environmental Permit has been submitted and underwent consultation in January 2023, but the permit has not yet been issued.
6.15 The proposed site at Lower Hare Farm, Whitestone, received planning permission for landfilling of 350,000 cubic metres of inert waste in June 2021 [DCC/4101/2018], but this permission has not yet been implemented and is due to lapse on 30th June 2024 if not implemented by then.
6.16 A subsequent application [DCC/4293/2022] to vary some of the planning conditions to facilitate revised phasing and working arrangements at Lower Hare Farm was approved on 8th May 2024 with the same expiry date as the original permission. An application for an Environmental Permit has been submitted to the Environment Agency and is undergoing consultation.
6.17 Two further planning applications that include inert landfill alongside the recycling of inert waste have recently been submitted to Devon County Council and are awaiting determination:
- landfilling of 330,000 cubic metres of inert waste at Greenway, Halberton [DCC/4358/2023]; and
- landfilling of up to 700,000 cubic metres of inert waste at Lower Brenton Farm, Kennford (resubmission of a previous application that was withdrawn prior to determination) [DCC/4337/2023].
6.18 Planning permission was granted in July 2023 [DCC/4339/2023] for the importation of 1.5 million tonnes of inert waste to facilitate the restoration of Zig Zag Quarry, between Newton Abbot and Kingskerswell. This waste recovery operation would provide capacity
for approximately 940,000 cubic metres of waste materials.
Spatial Distribution of Inert Landfill Capacity
6.19 As indicated in section 3 of this report, the pattern of inert landfill capacity has changed over the last 20 years from a large number of often small sites to a few large sites, with five landfill sites [shown in Figure 1] receiving waste in 2022 and one of these having no remaining capacity at the end of that year.
6.20 Due to their scale, inert landfill and recycling sites will frequently fall within the definition of ‘strategic facility’ for the purposes of Policy W3 (Spatial Strategy) of the DWP if they manage 40,000 tonnes or more of waste. This policy requires the location of strategic sites to be “within or close to Exeter, Barnstaple and Newton Abbot”, with non-strategic sites to be at those settlements or “within or close to Devon’s other towns”.
Policy W7 (Waste Disposal) allows for further inert landfill capacity where “the proposal will achieve a significant reduction in the distance that the waste is transported”, giving scope for new capacity to be located away from the three main settlements.
6.21 Of the inert landfill sites that were operational in 2022, three were close to Exeter (Hill Barton, Kenbury Wood and Trood Lane), with Yannon Lane being at Newton Abbot and Holmacott near Barnstaple. However, Holmacott accounted for 80% of the remaining capacity at operational sites [based on the Environment Agency’s capacity figure rather than the operator’s lower figure], with the remaining 20% being shared between two of the sites near Exeter, with no remaining capacity at Newton Abbot.
6.22 As indicated in paragraph 6.15, a further 350,000 cubic metres of inert landfill capacity has been granted planning permission at a site close to Exeter, although this facility is awaiting determination of its Environmental Permit application. Including that non-operational capacity at Lower Hare Farm, the remaining inert landfill capacity at sites in the Exeter area was 609,000 cubic metres at the end of 2022.
6.23 The planning permission for new inert landfill capacity at Challonsleigh, Lee Mill will, when operational, provide a facility within South Devon close to the A38 and Plymouth that will fill a large gap in provision in that part of the county. While there is no remaining landfill capacity in the Newton Abbot area, the recent permission for the recovery of inert waste for the restoration of Zig Zag Quarry will help in addressing that shortfall.
7. Future Inert Waste Management Requirements
7.1 As indicated in Table 1 and Figure 2, the quantity of inert waste managed in Devon did not steadily decline as predicted in the DWP, but this rose to a peak in 2018 and 2019 before dropping sharply in 2021 and 2022. Table 7 shows that, at the end of 2022, Devon’s operational and approved inert landfill sites had a remaining capacity of 2.197 million cubic metres, of which 1.262 million cubic metres were at operational sites.
7.2 When considering whether this remaining inert landfill capacity will be sufficient to meet Devon’s requirements, there are a number of variable factors that will influence the longevity of this capacity:
- the rate of construction, demolition and excavation activity that can be expected to generate inert waste;
- the occurrence of events such as recession or pandemic that depress the economic activity that generates inert waste or, conversely, economic conditions and policy measures that may promote construction activity;
- the proportion of inert waste that is recycled or recovered rather than requiring disposal through landfill;
- the proportion of excavation waste that is retained and utilised within the construction site;
- the availability of construction or restoration projects requiring waste for recovery;
- whether the landfill capacity that has been granted planning permission but is not yet operational is implemented; and
- whether any operational inert landfill sites close before their remaining capacity is utilised.
7.3 To provide a range of potential landfill capacity requirements over the period to 2031 covered by the DWP, a range of scenarios has been created based on the pattern of inert waste management between 2014 and 2022 detailed in Table 4:
- three levels of annual inert waste managed, a HIGH figure of 1.7 million tonnes, a MEDIUM figure of 1.3 million tonnes and a LOW figure of 1.0 million tonnes, broadly reflecting the range seen between 2014 and 2022 including the peak figures of 2018 and 2019 and the levels seen in 2015 to 2017; and
- two figures for the proportion of inert waste that is landfilled, an OPTIMISTIC proportion of 10% and a PESSIMISTIC proportion of 30%, the former being the DWP target and the latter reflecting performance in recent years.
7.4 In considering the outcomes of these scenarios, which reflect uncertainty over future rates of construction activity, waste generation and recycling/recovery rates, the following assumptions are made:
- that approved capacity at sites that are not yet operational [i.e., Challonsleigh and Lower Hare Farm] will be delivered; and
- that current and consented landfill sites will continue to operate until all of their approved capacity has been utilised.
7.5 These three pairs of figures result in the six scenarios shown in Table 8, with the outputs in the final column representing the range of capacity requirements for the landfilling of inert waste in Devon from 2023 to 2031.
| Annual Tonnage of Inert Waste (million tonnes) | Total Tonnage of Inert Waste (million tonnes) | Total Tonnage for Landfill (million tonnes) | Total Volume of Inert Waste for Landfill (million cubic metres) | |
|---|---|---|---|---|
| High / Optimistic | 1.7 | 15.3 | 1.53 | 1.02 |
| High / Pessimistic | 1.7 | 15.3 | 4.59 | 3.06 |
| Medium / Optimistic | 1.3 | 11.7 | 1.17 | 0.78 |
| Medium / Pessimistic | 1.3 | 11.7 | 3.51 | 2.34 |
| Low / Optimistic | 1.0 | 9.0 | 0.9 | 0.60 |
| Low / Pessimistic | 1.0 | 9.0 | 2.7 | 1.80 |
7.6 Table 7 indicates that the remaining capacity at operational and consented inert landfill sites in Devon was 2.197 million cubic metres at the end of 2022. Under four of the scenarios, that capacity would exceed the volume of waste requiring landfilling between 2023 and 2031, with only the volumes for the High/Pessimistic scenario [i.e., annual inert waste of 1.7 million tonnes, with 30% requiring landfilling] and Medium/Pessimistic scenario [i.e., annual inert waste of 1.3 million tonnes, with 30% requiring landfilling] exceeding the remaining capacity.
7.7 However, if the remaining inert landfill capacity at the end of 2022 is adjusted to 1.604 million cubic metres to reflect the operator’s survey at Holmacott referred to in 6.8, then an additional scenario – Low/Pessimistic – would exceed that capacity.
7.8 Based on the outcomes of these scenarios, the key influence on the ability of the existing inert landfill capacity to accommodate future disposal requirements would appear to be the proportion of inert waste that requires landfilling rather than being managed through reuse, recycling or recovery, as all of the Optimistic scenarios [which assume a landfill proportion of 10%] can be accommodated within existing
capacity at operational and consented sites [this remains the case if the
capacity of Holmacott is reduced to reflect the operator’s survey]. In contrast, two of the Pessimistic scenarios [landfilling of 30% of inert waste] would result in available capacity being utilised before the end of 2031 [together with the third Pessimistic scenario if the reduced capacity at Holmacott is taken into account].
7.9 While the period 2014 to 2020 saw the proportion of inert waste managed in Devon that was landfilled being close to or above 30%, Table 4 indicates that 2021 saw a significant drop to 16.4%, followed by a drop to 11.1% in 2022 that is close to the DWP’s targets of 11% for 2026 and 10% for 2031. These lower levels would appear to be an indicator of a more sustainable approach that may be developing, rather than an anomaly.
8. Summary & Conclusions
8.1 Section 4 of this Position Statement outlines the approach of the DWP to the management of inert waste, including its disposal through landfill, with the key points being:
- it was assumed that the quantity of inert waste would steadily decline from 1.175 million tonnes in 2011 to 0.708 million tonnes in 2031, with only 10% of these materials being disposed of through landfill;
- the forecast capacity requirement for the Plan period from 2011 to 2031 for inert landfill was estimated as 1.92 million cubic metres;
- as the available inert landfill capacity in 2011 was 2.68 million cubic metres, it was not considered necessary for the DWP to make specific provision for new capacity, although Policy W7 did allow for new capacity where it would achieve a significant reduction in transportation distances; and
- monitoring of the DWP following its adoption has shown that, from 2017/18 onwards, the available inert landfill capacity has fallen below the capacity forecast at the time of adoption of the Plan (although this does not take account of new capacity at sites which are not yet operational).
8.2 Section 5 considered the pattern of inert waste management from adoption of the DWP in 2014 to the latest year for which data are available, 2022, with the key points being:
- in contrast to the assumptions of the DWP, the quantity of inert waste that was managed in Devon steadily increased from 2014 to 2018 and 2019 before declining to a level in 2022 just above that of 2014;
- Devon was a net importer of inert waste from 2014 to 2019, with the quantity of inert waste managed within the county exceeding the amount generated in Devon but, from 2020, exports of inert waste from Devon have exceeded imports by an increasing margin, potentially being an indicator of constrained capacity within Devon;
- the proportion of inert waste that was disposed of through landfill remained above 30% from 2015 to 2020, peaking at 39% in 2019, before dropping sharply to 16% in 2021 and 11% in 2022;
- non-hazardous landfill sites accounted for a significant proportion of inert waste that was disposed of through landfill in the first part of the period under consideration, averaging 16% of inert waste that was landfilled between 2015 and 2017, but only accounting for around 3% in subsequent years;
- the increase in inert waste quantities over the period to 2018 is unlikely to have been caused by importation of inert waste into Devon from elsewhere, but is partially explained by the pattern of house completions as an indicator of construction activity;
- analysis of inputs to individual inert landfill sites shows that the increased levels over the period 2017 to 2020 were largely accounted for by the Trood Lane facility, linked to that site’s relationship with delivery of open space in association with the South West Exeter urban extension; and
- the recovery of inert waste, located higher in the waste hierarchy than landfill, has played a significant role in the management of inert waste, albeit varying between 6% and 25% of total inert waste since 2014 and reflecting the uncertainty over availability of suitable construction or restoration projects that are able to make beneficial use of these waste materials.
8.3 The availability of inert landfill capacity was discussed in Section 6, with the key points being:
- the remaining capacity at the operational inert landfill sites in Devon has understandably declined each year from 2014 onwards, with no new sites becoming operational within that time, with capacity halving from 2.6 million cubic metres to less than1.3 million cubic metres;
- this reduction has been offset by the granting of planning permissions for new capacity amounting to 935,000 cubic metres in 2020 and 2021, although neither of the new sites are yet operational;
- two current landfill sites – Hill Barton and Holmacott – have sought EIA screening opinions relating to proposals for extensions, but neither have yet progressed to a planning application;
- planning applications have recently been received for new inert landfill sites near Tiverton and Exeter which, if approved, would provide a further 1.03 million cubic metres of capacity; and
- additional capacity for the recovery of inert waste to facilitate quarry restoration has been approved near Newton Abbot.
8.4 Finally, Section 7 of this Statement undertook modelling of six scenarios for the use of inert landfill capacity involving three levels of waste generation and two rates of landfilling, with the assumptions that consented non-operational sites would be delivered and that all approved landfill capacity would be utilised.
8.5 While there is a degree of uncertainty over the accuracy of capacity figures for one site, the outcome of the modelling suggests that the available inert landfill capacity in Devon will not be sufficient for the period to 2031 if the proportion of inert waste requiring disposal through landfill remains around the 30% level experienced between 2014 and 2020.
8.6 In contrast, a reduction in the proportion of inert waste that is landfilled to the level of 10% envisaged for 2031 in the Devon Waste Plan would see the available landfill capacity being sufficient. Recent years have seen reductions in the proportion of inert waste landfilled to 16% in 2021 and 11% in 2022, indicating that this represents a longer-term reduction rather than an anomaly.
8.7 A further consideration is that, while Devon’s landfill capacity may be sufficient to accommodate predicted quantities of inert waste under the ‘optimistic’ scenarios, the distribution of that capacity across the county is uneven, with the two sites with the largest capacities being in North Devon and South Hams (the latter not yet operational). There is little remaining capacity in the Exeter area at operational sites, particularly in view of limitations on the types of inert waste being accepted, until such time as the consented site at Lower Hare Farm is able to obtain an Environmental Permit to enable it to commence operations.
8.8 As indicated in the Introduction, this Position Statement will be updated as new data for inert waste inputs and landfill capacity become available, with scenario forecasting and conclusions adjusted accordingly.
Document control
Document Title: Position Statement: Inert Landfill Capacity
Author: Andy Hill, Planning Development Manager
Checked By: Emily Harper, Principal Planner
Approved By: Mike Deaton, Chief Planner
Initial Issue Date: 5th September 2023
| Revision | Author | Checked by | Approved by | Date |
|---|---|---|---|---|
| 1 (update to include 2022 data) | Andy Hill | Emily Harper | Mike Deaton | 11/10/2023 |
| 1.1 (correction of minor errors and updates to Trood Lane, Lower Hare Farm and Holmacott) | Andy Hill | Emily Harper | Sarah Ratnage | 13/05/2024 |