About the Survey
Devon residents were invited to respond to a survey which asked to what extent they agreed with a number of statements. The survey ran from September to December 2019.
Scoring was on a star rating basis. Five stars = strongly agree, four stars = agree, three stars = neither agree nor disagree, two stars = disagree, one star = strongly disagree. Respondents could leave a question blank if they wished.
People were also asked “if you could change one or two things, what would you change, and in what way would you change them?”.
How representative was the survey?
1,278 people responded.
The survey respondents were broadly representative of the Devon population, weighted slightly more towards women and people of working age (35 to 64 year olds), and those living in towns/cities.
The survey was promoted via social media, online newsletters and the Have Your Say website. Workshops, outreach and ‘assisted completion’ was provided to encourage disabled people, Deaf people (British Sign Language users), older and younger people, and Black, Asian and other minority ethnic (BAME) people to participate.
For further information, see Participation Data below.
Executive Summary
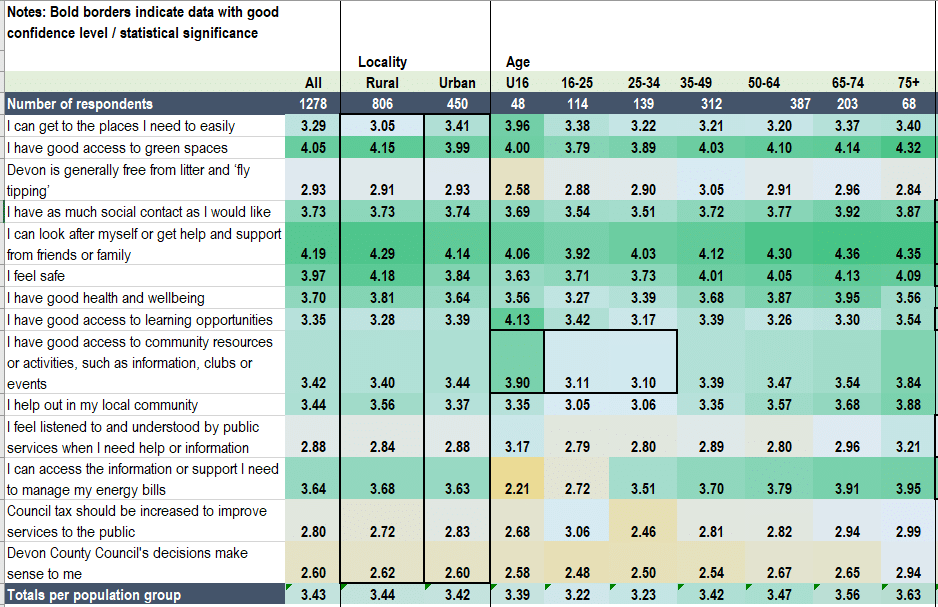
Scores listed below are the average scores – where the highest, five, is ‘strongly agree’ and the lowest, one, is ‘strongly disagree’. The mid-point is 3.
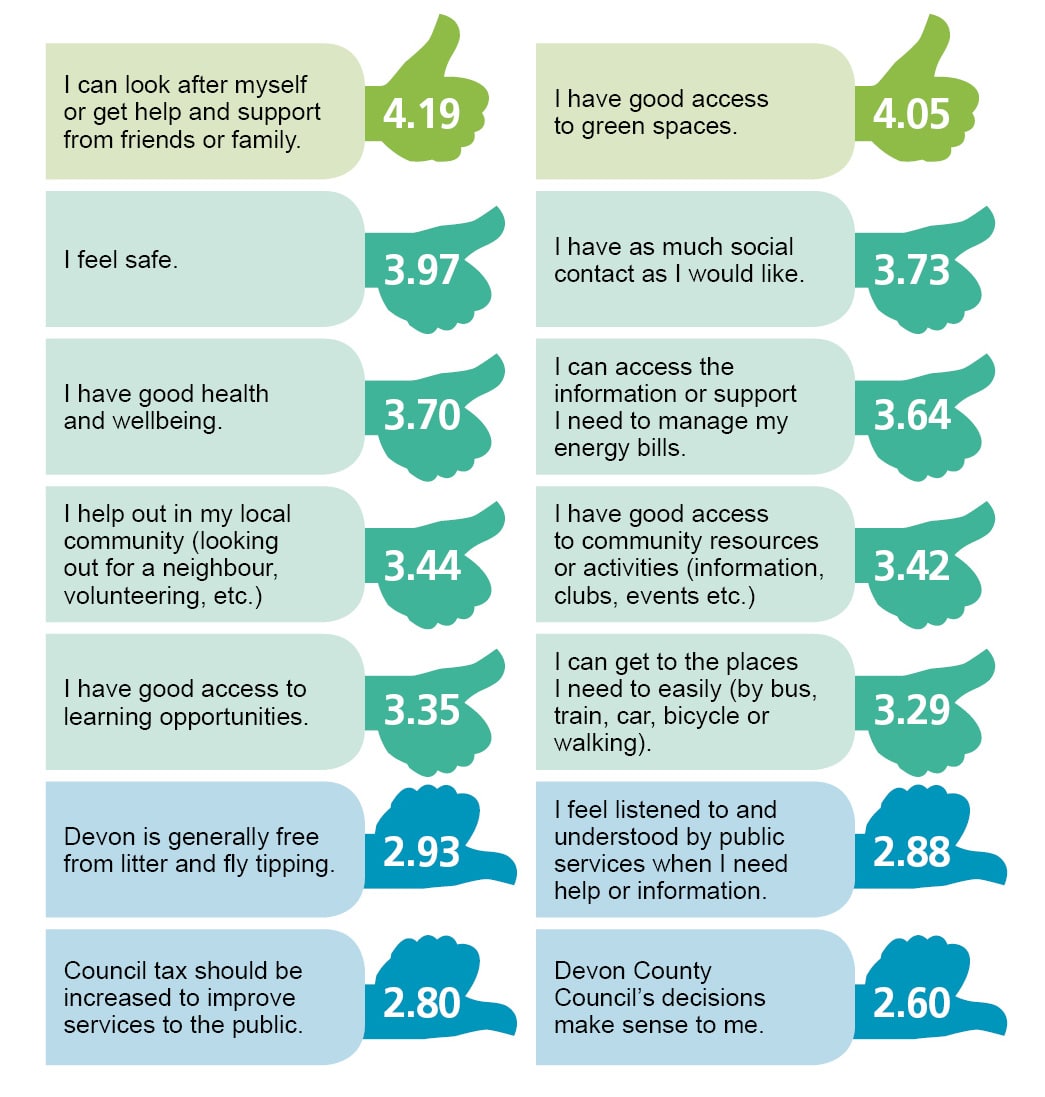
Overall, respondents to the survey feel they are: independent / resilient, feel safe and well, and have good access to green space and social interactions. Although there was not huge dissatisfaction with access to services and resources, there are some issues across the county. Areas of lower satisfaction include the ability to get around, litter and fly-tipping, feeling listened to, and decision making.
All respondents were asked to suggest improvements on issues that mattered most to them:
A significant number of comments pointed to the need for carbon reduction initiatives such as better walking and cycling routes, and better availability and affordability of public transport. Comments were also made about better traffic management, car parking and road maintenance / repairs but these were outweighed by requests for more ‘environmentally friendly’ initiatives.
“Transport by car has become essential and leaves many people stranded. Why has the bus service all but disappeared? Why can’t we have safe off-road cycle / walking routes all over Devon, not just in Exeter, so that people can get around for work / appointments as well as leisure?….I don’t drive. My own county is mostly closed access to me.”
Requests were made for better availability of community facilities and activities including adult education, sports, shopping, arts / culture, leisure and green spaces – not just in rural areas but also in towns and cities. Access to doctor’s surgeries and hospitals was also highlighted as problematic for some, exacerbated by poor public transport.
“More support for community buildings, community education and local events / groups.”
Concerning comments were also made about the provision of adequate mental health services, alongside requests for better, joined-up health and social care. Also notable, were comments about services for young people and funding for education, disability access improvements, and requests for better policing and addressing anti-social behaviour.
“Invest in preventative frontline services such as youth groups, mental and emotional healthcare, and social services.”
People are unhappy with the amount of litter and fly tipping. A few suggested improvements on recycling, collection and waste facilities. A few comments were also received about improvements needed to Broadband and concerns about any roll-out of 5G technology.
Slightly more people disagreed to an increase in Council Tax, many saying they cannot afford any more or are paying ‘more for less’. People in rural areas disagreed slightly more than those in urban areas. However, it is worth noting that Council Tax levels are also set by District and Parish Councils, and the Police and Crime Commissioner. Some areas (particularly Cranbrook) are paying far higher rates of Council Tax which affect people’s perception of Council Tax levels as a whole. Views were also expressed on better public involvement and changes to local government structure.
“In principle I’m happy to pay Council Tax for services but Council Tax has increased far too much in the last few years while earnings haven’t.”
“The three tier council system used in Devon is very inefficient and wasteful.”
There were vastly different points raised by the respondents in respect of planning and housing, such as more social housing / affordable rental properties and the need to address homelessness, alongside stopping the number of new houses being built.
“Review real housing need of local people and innovate with brownfield sites and urban regeneration.”
Differences between locality and diversity categories:
In comparing results for different groups it would appear that, overall, satisfaction increases with age in adults. The older people are, the more they are involved in community activity and less likely to feel lonely (although social contact tails off slightly for over 75s). This pattern is also reflected in income, with higher earners more likely to be in agreement with the statements.
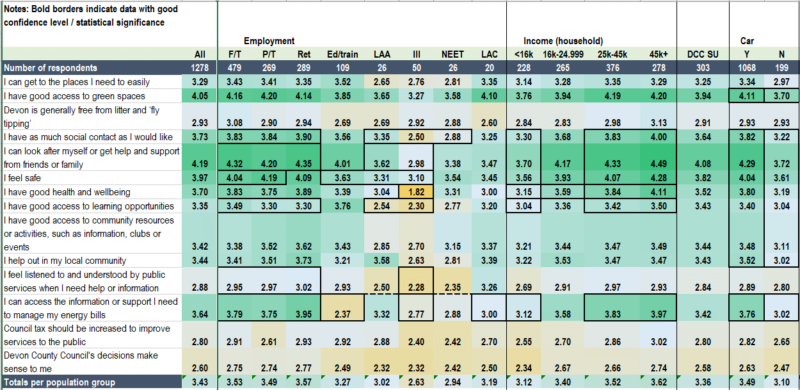
Overall, those out of work (whether due to ill health or not), on lower incomes, without a car / private motor vehicle, disabled people, carers of adults, and LGBT (lesbian, gay, bisexual and transgender) people are less satisfied with life in Devon than their comparators. This result appears to correlate with the result for ‘social contact’ – perhaps suggesting that those with good social contact are generally happier. These groups were also less likely to agree they felt safe, had good health and wellbeing, could look after themselves or get help from friends or family, or access information or support to manage their energy bills. Similarly, national and local adult social care surveys have noted a correlation between social contact, overall satisfaction and perception of safety.
“Carers always put their loved ones first and as a result their own health suffers. In my own case, that’s certainly true – life is a lot more stressful, I have less time for exercise, healthy eating and seeing friends and other family. It’s very difficult for me and my husband to go away”.
Perhaps unsurprisingly, people in rural areas have better access to green space but find it harder to get to places compared with those in urban areas. Disabled people and people without a car also find it harder to access green spaces.
With regards to litter and fly tipping, people in North Devon were more dissatisfied than people in Exeter or East Devon.
“Rubbish on Tarka trail, should be notices and bins at strategic entrances to trail.” (North Devon resident)
Hate crime / incidents remain an issue for minority groups in Devon with BAME (Black, Asian and minority ethnic) people less likely to agree that they feel safe than White people (White British / White – other). LGBT people feel less safe than people who do not identify as LGBT.
“Since the 2016 referendum, divisiveness, ignorance, xenophobia, racism, and hate crime has increased.” (Mixed Heritage resident)
It may also be unsurprising that people with ill health and disabled people disagreed more that they had good health and wellbeing, but LGBT people also disagreed more that they had good health and wellbeing. Although this cohort had slightly higher numbers of people with ill health than all respondents as a whole, their profile was also more younger and urban; it could suggest the need to better understand and address health and wellbeing issues for this group, including young LGBT people.
Disabled people, people without a car, people on low incomes, carers of adults and people who are unable to work due to ill health said that they had poorer access to adult learning. Disabled people and people out of work due to ill health were more likely to disagree that they felt listened to and understood by public services.
“Poor availability of services regarding employment and training for disabled young people.” (Disabled resident)
People aged 16 to 34 were less likely to agree they had good access to community resources or activities compared with under 16s.
If you need information in a different format, please contact us.
Further information:
- Detailed Results
Overall levels of satisfaction
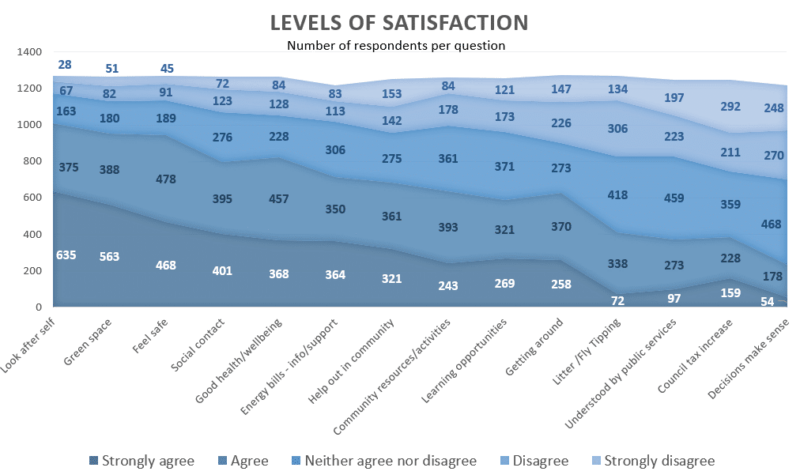
Strongly agree Agree Neither agree nor disagree Disagree Strongly disagree I can get to the places I need to easily 258 (20%)
370 (29%)
273 (21%)
226 (18%)
147 (12%)
I have good access to green spaces 563 (45%)
388 (31%)
180 (14%)
82 (6%)
51 (4%)
Devon is generally free from litter and ‘fly tipping’ 72 (6%)
338 (27%)
418 (33%)
306 (24%)
134 (11%)
I have as much social contact as I would like 401 (32%)
395 (31%)
276 (22%)
123 (10%)
72 (6%)
I can look after myself or get help and support from friends or family 635 (50%)
375 (30%)
163 (13%)
67 (5%)
28 (2%)
I feel safe 468 (37%)
478 (38%)
189 (15%)
91 (7%)
45 (4%)
I have good health and wellbeing 368 (29%)
457 (36%)
228 (18%)
128 (10%)
84 (7%)
I have good access to learning opportunities 269 (21%)
321 (26%)
371 (30%)
173 (14%)
121 (10%)
I have good access to community resources or activities 243 (19%)
393 (31%)
361 (29%)
178 (14%)
84 (7%)
I help out in my local community 321 (26%)
361 (29%)
275 (22%)
142 (11%)
153 (12%)
I feel listened to and understood by public services when I need help or information 97 (8%)
273 (22%)
459 (37%)
223 (18%)
197 (16%)
I can access the information or support I need to manage my energy bills 364 (30%)
350 (29%)
306 (25%)
113 (9%)
83 (7%)
Council tax should be increased to improve services to the public 159 (13%)
228 (18%)
359 (29%)
211 (17%)
292 (23%)
Devon County Council’s decisions make sense to me 54 (4%)
178 (15%)
468 (38%)
270 (22%)
248 (20%)
Diversity and Locality Data
Results for diversity and locality groups have been tested for statistical significance (counting those who ‘disagreed’ or ‘strongly disagreed’). Those with good ‘confidence levels’ are as follows:
- With regards to litter and fly tipping, people in North Devon were more dissatisfied than people in Exeter or East Devon.
- People in rural areas find it slightly harder to get to places compared with those in urban areas.
- People in urban areas feel slightly less safe than those in rural areas.
- Disabled people were significantly less likely to agree that they had good health and wellbeing, and less likely to agree they had good social contact, were able to look after themselves, have good access to learning opportunities, felt safe or had good access to green spaces. They were also slightly less likely to say they could access information or support to manage energy bills, access community resources, or felt listened to and understood by public services.
- People without a car were less likely to agree they could access information and support about energy bills, had good health and wellbeing, had good social contact, could look after themselves or help out in their local community. They were also slightly less likely to agree they felt safe, had good access to green space, community resources or learning opportunities.
- In comparing younger people aged 16 to 34 with people aged under 16, those aged 16 to 34 were less likely to agree that they had good access to community resources and activities.
- For employment status, those out of work due to ill health said they did not have good health and wellbeing (lowest score of all results at 1.82), compared with all other economic groups, and disagreed more that they felt listened to and understood compared with people in work or retired. Those out of work due to ill health or caring for an adult disagreed more that they had good access to learning opportunities compared with people in work or retired. People in education / training, out of work due to ill health, or looking after a child were more likely to disagree that they could access information and support to manage energy bills than people in work or retired. People out of work due to ill health or caring for an adult were less likely to agree they could look after themselves or get help or support from family / friends than those in work or retired. People out of work (ill health or able to work) and carers of adults were more likely to disagree they had as much social contact than people in work or retired. People in education / training, caring for an adult or unable to work due to ill health were slightly less likely to say they felt safe compared with people in work.
- People on low incomes (£16,000 household income per annum) were less likely to agree they could access information or support to manage energy bills, look after themselves, have good social contact or feel safe, compared with those with household incomes of £25,000 or more. People on lower incomes were also slightly less likely to agree they had good health and wellbeing or that they had good access to learning opportunities.
- Black, Asian and other minority ethnic people (excluding other White) were significantly less likely to agree they felt safe than White British people.
- Lesbian, Gay, Bisexual or Trans (LGBT) people were significantly more likely to disagree that they had good social contact, good health and wellbeing, or could access information or support about energy bills. They were significantly less likely to agree they felt safe and less likely to agree they could look after themselves. They were also slightly more likely to disagree they felt listened to and understood by public services. People whose gender identity was non-binary or other were more likely to disagree they had good social contact and slightly less likely to agree they had good health and wellbeing.
Cross-checking was carried out for LGBT people to see why some of the results came back more negative: LGBT respondents were more likely to be living in an urban area (80% compared with 63% for all respondents), be younger and in education / training, although the number of over 75s was higher than the respondents as a whole (13.6% compared with 5.3%). They were also slightly more likely to be out of work and have a long term ill health condition such as a mental health problem. Around half of those who identified as ‘other / non-binary’ gender identity also identified as transgender.
People without a car were also more likely to be on lower household incomes (less than £16,000).
There were no significant differences between views of people who are receiving ongoing services from the County Council and those who are not in relation to questions about council tax, feeling listened to, or County Council decisions.
Diversity and Locality Data
Results with statistical significance are marked with a bold black border. Higher satisfaction (more likely to strongly agree) is dark green, lower satisfaction (more likely to disagree) is orange. Neither agree nor disagree is light blue.


Diversity and Locality Data – Excel
Notes
Please note that for locality data (collected by first half of the respondent’s postcode), postcodes do not exactly align to District Council areas – the results displayed here are the ‘closest fit’.
Codes for diversity categories:
- F/T = full time employment (including self employed)
- P/T = part time employment (including self employed)
- Edu/train = in education or training
- LAC = Looking after a child or grandchild
- LAA = Looking after an adult
- NEET = Not in education, employment or training but able to work
- Ret = Retired
- Ill = Unable to work due to ill health
- DCC SU = Currently receiving services from the County Council
- Car = has access to a car or other private motor vehicle (Y = yes, N = no)
- F = Female
- M = Male
- O = non-binary or other gender identity (does not identify as male or female)
- BAME = Black, Asian or other minority ethnic identity
- WO = White – other
- MH = Mixed heritage
- WB = White – British
- LGBT = Lesbian, gay, bisexual or transgender
Statistically significant results with a difference of 0.30 or more
5 = strongly agree, 4 = agree, 3 = neither agree nor disagree, 2 = disagree, 1 = strongly disagree.
Average score Average score Difference Locality: Rural Urban get around easily 3.05 3.41 0.36 feel safe 4.18 3.84 0.34 Disability: Disabled Not disabled listened to and understood 2.56 2.94 0.38 community resources and activities 3.07 3.49 0.42 energy bills – information and support 3.29 3.72 0.43 green space 3.64 4.13 0.49 feel safe 3.55 4.06 0.51 learning opportunities 2.84 3.45 0.61 look after self 3.68 4.30 0.62 social contact 3.21 3.83 0.62 good health and wellbeing 2.73 3.90 1.17 Car owner: Car No car learning opportunities 3.40 3.04 0.36 community resources and activities 3.48 3.11 0.37 green space 4.11 3.70 0.41 feel safe 4.04 3.61 0.43 help out in community 3.52 3.02 0.50 look after self 4.29 3.72 0.57 social contact 3.82 3.22 0.60 good health and wellbeing 3.80 3.19 0.61 energy bills – information and support 3.76 3.02 0.74 Age: under 16 16-34 year olds community resources and activities 3.90 3.11 0.79 Employment (difference between closest range in results – variable groupings) feel safe 4.04 3.63 0.41 social contact 3.83 3.35 0.48 look after self 4.20 3.62 0.58 listened to and understood 2.95 2.28 0.67 energy bills – information and support 3.75 3.00 0.75 learning opportunities 3.30 2.54 0.76 good health and wellbeing 3.00 1.82 1.18 Income: £16k £25k learning opportunities 3.04 3.42 0.38 good health and wellbeing (under £16k v £16k) 3.15 3.59 0.44 feel safe 3.56 4.07 0.51 social contact 3.30 3.83 0.53 look after self 3.70 4.33 0.63 energy bills – information and support 3.12 3.83 0.71 Gender: Male or Female (lowest) Non-binary/other good health and wellbeing 3.69 3.21 0.48 social contact 3.65 2.74 0.91 Ethnicity: White British BAME (excluding White/Mixed) feel safe 3.98 3.00 0.98 LGBT: not LGBT LGBT listened to and understood 2.94 2.57 0.37 look after self 4.25 3.41 0.84 feel safe 4.04 3.02 1.02 good health and wellbeing 3.79 2.74 1.05 energy bills – information and support 3.71 2.56 1.15 social contact 3.79 2.52 1.27 Comparing the 2019 survey with the 2015 survey
Note that the profile of the 2015 survey much older (59% over 65) with few young people taking part, and more disabled people than the local demographic.
Statement Strongly agree or agree Difference I can get to the places I need to easily (2019)
49%
Up 8%
Public paths are safe and easy to get around on. 37% I can get around easily by public transport. 47% Roads are safe and easy to get around on. (2015) 39% (Average 41%) I have good access to green spaces (2019)
76%
Down 5%
Have good access to green (open) spaces (2015) 81% I have as much social contact as I would like (2019)
63%
Down 10%
I have good social contact with people (2015) 73% I can look after myself or get help and support from friends or family (2019)
80%
I can get the help and support I need from family, friends or community (2015) 68% I feel safe (2019)
75%
No change
I feel safe outside in my local area during daylight. (2015) 90% I feel safe outside in my local area after dark. (2015) 61% (average 75%) I have good access to learning opportunities (2019)
47%
Up 10%
I have good access to adult learning (2015) 37% I have good access to community resources or activities (2019)
50%
Down 2%
I have good access to community activities and/or resources (2015) 52% I can access the information or support I need to manage my energy bills (2019)
59%
Information I need from the County Council is easy to understand. (2015) 41% I can access information about healthy living 50% Council tax should be increased to improve services to the public (2019)
31%
Down 15%
Council Tax should be increased to maintain essential services (2015) 46% Devon County Council’s decisions make sense to me (2019)
19%
Down 3%
The County Council had managed budget decisions well (2015) 22% - Comments
Community Insight Survey – Comments
Full set of comments
Independent analysis
by Sunny Chou, Exeter University Student.
People were asked: if you could change one or two things, what would you change, and in what way would you change them? They were also asked why this was important to them.
Total number of responses = 1,151.
Comments have been grouped by common themes.
Number of responses per theme by order of volume
1. Environment: 405 comments
Environment – Infrastructure & Initiatives – Getting Around – Public Transport (only): 188 comments
Environment – Infrastructure & Initiatives – Getting Around: 127 comments
Environment – Infrastructure & Initiatives – Getting Around – Traffic Management (only): 31 comments
Environment – Action on climate change and broader comments about infrastructure / initiatives etc.: 27 comments
Environment – Car Parking: 24 comments
Environment – Places: 8 comments.2. Community Facilities & Activities: 108 comments
Community Facilities & Activities – General: 77 comments
Community Facilities & Activities – Adult Education: 25 comments
Community Facilities & Activities – Libraries: 6 comments.3. Council Tax and Funding: 96 comments.
4. Health and Social Care: 93 comments
Health and Social Care – General: 42 comments
Health Services (GPs, Hospitals etc): 30 comments
Health and Social Care – Mental Health Services: 21 comments.5. Planning & Housing: 72 comments
Planning & Housing – General: 59 comments
Planning & Housing – 5G: 13 comments6. Political, Structural, and Decision Making: 70 comments.
7. Recycling and Litter: 67 comments
Recycling and Litter – General: 64 comments
Recycling and Litter – Bin Collections: 3 comments.8. Road Maintenance/Repairs: 60 comments.
9. Young People: 45 comments
Young People – General: 32 comments
Young People – Education: 13 comments.10. Police, Crime and Anti-Social Behaviour: 34 comments.
11. Other: 100 comments
Other – Uncategorised: 21 comments
Other – Customer Care and Communications: 20 comments
Other – Disability Access: 20 comments
Other – Information & Communication Technology: 14 comments
Other – Economy and Jobs: 8 comments
Other – Family Support: 5 comments
Other – Energy Bills: 3 comments
Other – Dogs: 3 comments (Dog Wardens are District Council responsibility)
Other – Offensive about a group: 2 comments (not published)
Other – Exeter: 2 comments
Other – South Hams District Council: 2 comments.Theme Report 1 – Environment
Sub-theme: Transportation
405 respondents commented on the environment, many of them commented on means of transportation, particularly on public transport costs and frequency, some of which emphasised the need to improve upon cycling and walking infrastructure and suggested improvements in traffic management.
Comments:
Extend bus services (subsidy for bus services) so more people can use them a) add extra length of route to include rural areas b) add early / late services so people can get to /from work.
Improve public transport, make it eco-friendlier and more accessible to more areas.
Perhaps a more regular bus service to rural areas.
Cheaper bus and train fares especially at peak / work times would encourage people to leave their car at home.
More affordable bus fares & better bus routes to get around.
Transport – better network, more regular local buses, more affordable transport with travel card available across county on all modes of transport e.g. across bus companies and trains.
Public transport links in more rural areas could be improved as well as additional traffic-free cycle routes – never enough of them.
More investment in our streets, public spaces and green spaces to make them safer and easier to navigate for pedestrians and cyclists.
Improved and integrated public transport to reduce vehicle use and emissions.
Better, cheaper public transport and roads policy which prioritises public transport, pedestrians, cyclists.
Roadworks should be more organised and more notice given / advertised to avoid traffic jams.
When asked why the respective issue is important to them, our respondents said:
I want to support greener travel.
Villages are becoming isolated.
Whilst I am currently privileged myself in terms of health, abilities, income etc. I know many friends who are not and they really need better services.
Because at the moment my only option for travelling to work is by car.
It’s important to me because I become quite isolated at times through not being able to join in or visit places due to lack of transport.
Because in rural areas people have to be dependent on cars.
Concern for environmental issues and fairness.
It is vital for our health that we improve air quality in our towns and cities and do it a more rapid pace than hitherto.
Very concerned about global warming.
Health and the environment. Also good for local economies.
Cannot travel by car or bus without delay caused by congestion.
The 2019 National Highways and Transport Network Survey showed a slight overall increase in satisfaction from 53% to 54%. Accessibility saw the highest increase in satisfaction. People were also more satisfied with walking, congestion, road maintenance and safety. However, satisfaction in public transport dropped by one per cent.
Sub-theme 2: Others
Others suggested action on climate change, better car parking, and some expressed concerns about green spaces. Note that public car parks are District Council run, Devon County Council manages on-street car parking:
Take more action regarding the climate emergency.
Addressing and supporting the climate emergency.
More decisions based on the declaration of climate emergency.
Look seriously at parking permits for residents. Expanding parking on the outskirts of the village & having resident only parking on the roadside.
Provision of free parking in market area.
Reduce the cost of travel and parking.
An increase in green spaces, or wildlife spaces. I would encourage wild flower verges that have been accepted and successful in other council.
When asked why the respective issue is important to them, our respondents said:
Because there is a climate crisis and not a lot of evidence that our government is focused on it.
The negative impacts of climate change will be and are being felt globally.
We need to act now to reduce carbon emissions before the global climate warms further.
There’s a wealth of really amazing independent shops showcasing the best of local artisanal produce, ingenuity and community and they don’t get the footfall they deserve.
Because it would encourage more park and rides and positively impact on the parking problem in residential areas.
It costs a lot to go to work when you have to pay for parking.
It affects everyone’s health and well-being.
Theme Report 2: Community Facilities & Activities
Sub-theme 1: General
108 respondents commented on community facilities and activities, 77 of whom suggested general improvements. Note that although Devon County Council also owns and manages two country parks: Stover Country Park near Newton Abbot and the Grand Western Canal near Tiverton, as well as Knapp Copse Local Nature Reserve near Ottery St Mary, parks and leisure are the responsibility of District Councils, as are public toilets.
They said:
More public green space accessible for children to play football, ride bikes, skateboard, scooter, fly kite away from roads.
More opportunities for meeting with others. More support for rural communities.
I would like more culture art hubs.
More supermarkets and takeaways in the area.
Increase local facilities rather than centralizing them.
I would like to see more social activities and groups as Devon feels sometimes like there is nothing there.
Better community services for elderly and less able / disabled / isolated people.
When asked why the respective issue is important to them, our respondents said:
Even with regular access to friends and family, it can feel isolating to not know what is going on in your town / community / city.
People getting in their community helps to break down isolation and helps local people to feel a sense of pride in their community.
Local inclusive community-based education, groups and events, for all ages, is the way to ensure that the recent austerity trend towards fearful, angry and divided population is halted and reversed.
Smaller scale community facilities are key I think, and more accessible. So many activities cost money. We need to do more for those on limited income / pension.
I live on the fringe of the city to be able to access these things and wonder how long it will be before I can’t.
Subtheme 2: Adult Education and Libraries
Others commented on issues on adult education and libraries:
Adult education courses to be more subsidised.
More opportunities for adult education in the evenings.
More information about adult education or re-training, career advice.
Improve adult access to education.
Better funding for libraries.
When asked why the respective issue is important to them, our respondents said:
I enjoy learning and feel it is vital for adults to have access to good quality leisure and academic classes.
There is insufficient choice for further education.
I would like to change career but I feel lost about how to get there, how to access courses.
To further my career and keep my brain active.
Libraries are community hubs, where I meet friends, my kids make new friends and we all expand our horizons and knowledge and dream bigger dreams.
Theme Report 3: Council Tax and Funding
96 respondents commented on council tax and funding, some expressed discontent on the council tax rate, others suggested greater transparency and more funding from central government.
Council tax cost increases are becoming a huge burden on monthly outgoings – we do not understand why the cost has become so high when our wages remain stagnant.
I would like to be able to afford my Council Tax.
I don’t understand how funding gets allocated; it feels as though money is spent in the wrong areas.
It would be nice, one year, if the council tax went down or even remained the same rather than increase when wages are static.
More funding from central government.
Council tax – really would much prefer this to come from general taxation.
National income tax should be increased to support CCs [county councils].
The state to give more money to local government.
Reduce council tax, improve road repairs. Reduce bureaucracy and waste.
When asked why the respective issue is important to them, our respondents said:
There are community groups struggling and rely on people’s passion to get things done.
Fairness to wage earners whose incomes are falling behind.
As a pensioner I really can’t afford to pay more council tax.
Because a low tax low public service economy is a misery for the working classes.
Because national service suffer and have a knock on effect.
I struggle to pay it and don’t see much for the money I pay.
I don’t feel that I am getting good value for money from the council.
Society is better if we all share the cost of care for social care.
It’s important to provide a good life to everyone and treat everyone the same.
Comments were also received about the relatively high cost of Council Tax and lack of facilities in Cranbrook, a new town on the outskirts of Exeter (East Devon District Council):
No extra council tax charge for Cranbrook – We pay an extra council tax in Cranbrook for our green spaces etc. We also pay for the rest of East Devon. This seems very unfair when no other areas have to and have access to parks etc locally too. We don’t even have that many facilities here.
Theme Report 4: Health and Social Care
93 respondents commented on health and social care. 42 made general suggestions, others made suggestions on health services such as access to GP surgeries (not the responsibility of the County Council but the NHS is a significant partner) and mental health services.
More funding for social care.
There should be more help for homeless people, families living in poverty and people with disabilities and / or chronic illness.
Social care and health services need improvement.
There would be care homes and elderly people’s homes run by Devon County Council.
Better access to health services.
Improved local hospital facilities.
Better transport and parking at hospitals. Keeping in-patient beds at local hospitals so that patient is in their communities, not hours away.
I don’t feel safe in my community and am unable to look after myself and feel as though I don’t get appropriate support in relation to mental health issues and well-being.
More support for people with mental health issues, particularly those who are employed.
When asked why the respective issue is important to them, our respondents said:
Because no one appears to have any serious input into helping the over 70’s. We are the forgotten group in society.
Because social care is very important and I oppose setting up systems that support corruption and profiteering.
They both have the power to affect positive outcomes in health and social well-being.
This important for everyone, hopefully we will all age. Anyone can become disabled through accident, illness or disease.
My children cannot get an appointment to be seen the same day!
Nearest surgery is now full hour round trip to go with no public transport is unacceptable.
I cannot get mental health support so desperately needed.
Having worked with both people groups there is a lack of support around mental health, and we are seeing too many cases of suicide and not enough of intervention and prevention.
Theme Report 5: Planning & Housing
Sub-theme 1: General
72 respondents commented on general issues regarding planning and housing, such as affordable housing. There are however vastly different points raised by the respondents, such as more social housing, less student accommodation, and fewer new buildings. Housing and planning is the responsibility of District Councils.
Eradicate rough sleeping. No-one should be sleeping on the streets. Open more shelters and work with charities to resolve individuals’ complicated circumstances.
More help for the homeless and families in poverty. The homeless are in desperate need of safe places to sleep and stay overnight.
Affordable housing.
More social housing.
Less student accommodation and more houses for people with families who live here all year round and pay council tax.
Stop building houses where there is not the infrastructure to support them.
Halt the building of new houses for a minimum of five years.
Reduce the number of new builds.
Better guidance on local planning decisions.
When asked why the respective issue is important to them, our respondents said:
Private rents causing extreme hardship.
Because I was made homeless twice.
I have a son and daughter that have been forced away from where they were born because of no affordable housing…
Too many local people are in poverty.
Because this is our city all year round and we feel ignored in favour of students.
Because intensive housing development is putting pressure on local resources and changing the rural community feel of our towns, to their detriment.
All this feverish building of houses is all very well but it’s too much too soon. I used to live on the outskirts now I’m swamped in the middle of new builds and it goes on for miles! And …they’re not what I would term ‘affordable’.
Because existing resources are overstretched and because we are losing the landscape around us.
Quality of life. Love living with green lungs and wildlife. We have deer, badgers, foxes all soon to be gone for a housing estate double the size of the existing footprint.
Sub-theme 2: 5G
Some also commented on the issue of 5G regarding planning and housing.
Apply the precautionary principle, halt the 5g roll out like other councils and whole countries have done.
I would ban 5G in Devon.
When asked why the respective issue is important to them, our respondents said:
I believe that we need our trees significantly more than we need the Internet of Things and that the radiation potentially poses a significant threat to health; ours and that of other crucially important life forms such as pollinators.
For the health and safety of all biological life and in particular the future health safety and privacy and wellbeing of my grandchildren.
Theme Report 6: Political, Structural, and Decision Making
69 respondents talked about political and structural issues, and decision making. They covered a wide range of policies, political involvement, and diverse views on local government structure.
More local involvement in decision making.
Decisions at a local level are made politically and do not represent all section of the community.
Make the council more accountable, and accessible.
Citizens voice needs to be listened to.
Scrap the District Councils hierarchy structure and make Devon County Council the one unitary authority.
Too many layers of govt County Council, District Council and Parish Council leads to overlap of services or services not being provided as each layer thinks it is down to someone else.
Make the council more efficient on private sector lines. Too much talk and too little action.
When asked why the respective issue is important to them, our respondents said:
I feel that we the local people should have a say in what is going on.
We vote for these people and have faith in them initially but gradually lose it when nothing, absolutely nothing is even discussed.
Because DCC can seem very remote from people and communities.
Local democracy, closer accountability.
I am in an under-represented group in my community.
Local matters need a local council, not a district council.
District Councils are expensive institutional structures – unit costs would be considerably reduced by scraping them.
Theme Report 7: Recycling and Litter
67 respondents commented on recycling and litter. Many complained about littering and fly tipping. A few suggested improvements on recycling, collection and waste facilities. The County Council manages waste and recycling facilities, District Councils provide household collections.
Need easier access to recycling facilities.
It would be good to have a mini recycling centre in the village.
More robust enforcement of anti-littering and fly tipping.
Fly tipping and litter in the countryside and beaches.
Clearance of litter and illegal dumping.
More bins.
More needs to be done about litter and fly tipping. We also need more bins!
When asked why the respective issue is important to them, our respondents said:
Unsightly, environmental pollution.
So the area looks clean and cared for.
Because Devon could be so much cleaner!
Public health issue.
Because it’s bad for the environment.
Keep area clean.
Allowing recyclable waste to litter the area is a waste of time and resources and defeats the object of recycling.
Theme Report 8: Road Maintenance / Repairs
60 respondents commented on road maintenance, some complained about potholes, some talked about general poor conditions and suggested repairs to the roads.
Improve road maintenance.
Invest more in road repairs.
I would invest in better road surfaces so as to prevent regular potholes.
Repair the roads properly not just temporary fixes for potholes.
Repair rural roads.
Better road maintenance in rural areas.
When asked why the respective issue is important to them, our respondents said:
Road surfaces seem to have to be really bad before potholes are repaired.
Road surfaces are becoming non-existent in rural areas.
Too many potholes, road edges eroded, dirty or broken road signs makes driving more difficult and damage to car suspension or tyres inevitable.
Roads are becoming dangerous especially during winter months as potholes are hidden by puddles.
Complaints about drainage and potholes are complicated to make and need to be much more localised.
Inadequate standards for maintenance of roads and ditches are actively dangerous in very wet or icy weather.
Potholes break suspensions which are expensive to repair.
Theme Report 9: Young People
45 respondents commented on young people. 32 talked about young people in general, 13 talked about education for young people.
Make sure schools are safer from bullying.
More funding for schools and services for young people in general.
Need to address opportunities for young people.
More investment in local community facilities for young people.
Lack of investment and funding for children and teenagers.
Better funding for education.
When asked why the respective issue is important to them, our respondents said:
I was bullied for every year of my education.
Lots of young people quite isolated.
Because I am a school governor and I am frustrated by the constant cuts to school funding.
I have children and work with young people. I believe cutting Children’s Services create problems further down the line so is a false economy.
There is an increase in antisocial behaviour because in rural areas with poor public transport there is little for young people to get involved in.
They are our future. We didn’t do enough to support them in society.
My daughter’s school is impacted by poor financial situation.
Theme Report 10: Police, Crime and Anti-Social Behaviour
34 respondents commented on police, crime, and anti-social behaviour. They have generally called for better policing. (Police and crime is not the responsibility of the County Council, but we are members of the Community Safety Partnership and support safeguarding related initiatives such as preventing extremism and addressing domestic violence and abuse. We are also bound by the Public Sector Equality Duty to ‘foster good community relations’).
Increase police support.
Better police presence and activity.
Need to address law and order.
When asked why the respective issue is important to them, our respondents said:
Because it doesn’t feel safe at night or walking around in the dark.
It’s important to me because I no longer feel safe in the town I grew up in.
Devon used to be safe, it is getting scary.
Theme Report 11: Others
106 responses have been included in other. Those include disability access, customer care and communications, information and communication technology.
Better BSL [British Sign Language] provision.
I use a wheelchair and really struggle to access shops, pubs, my university campus and societies (Exeter uni). Businesses need more incentive to comply with the equality act and provide reasonable adjustments (e.g. wheelchair ramps).
I don’t think there is enough communication with the public by the council.
Information should be much more easily accessible for the whole community. Too many policies are too difficult to find and use technical language without translation which makes decision-making obtuse.
Better Broadband NOW is vital for communities which are having to manage with little better than dial up.
Rural broadband is non-existent, as is mobile signal.
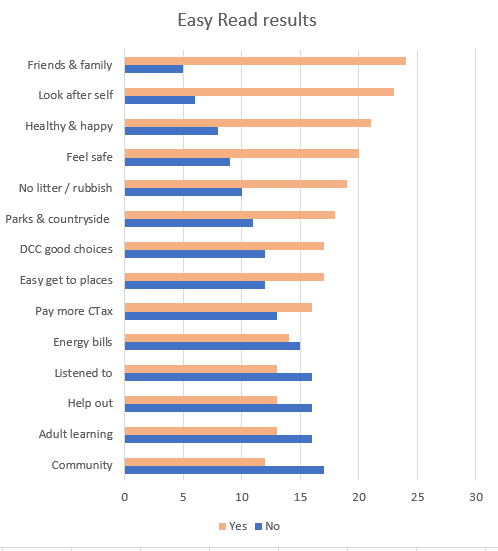
- Easy Read Results
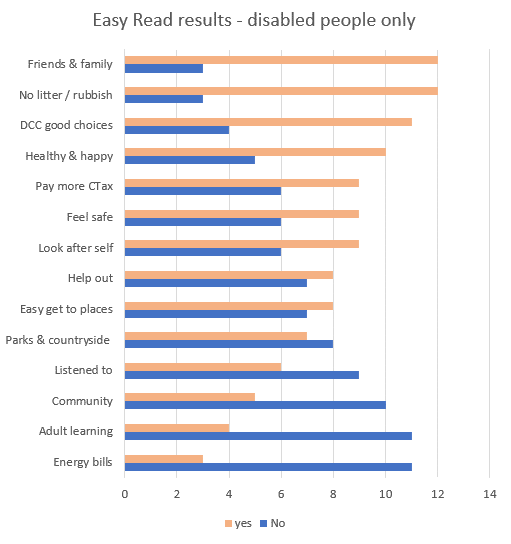
29 people participated. The online Easy Read survey was aimed at people with learning disabilities, however some people who are not disabled also participated. 15 people said they were disabled. Disabilities included: learning disability (majority), aspergers, dyslexia, cerebral palsy and fibromyalgia.
This cohort agreed more to Council Tax increases than those participating in the standard survey, and agreed more that Devon was free of litter and fly-tipping and that the County Council made good decisions.
Similar to the standard survey, disabled people have issues in accessing adult education. The results show that people with learning disability need more support in understanding energy bills.
Question “Yes” – disabled only “No” – disabled only “Yes” – all respondents “No” – all respondents Do you find it easy to get information about your energy bills like gas, water and electricity bills? 3 11 14 15 Are you able to get to adult learning classes if you want to? 4 11 13 16 Do you find it easy to use and join in with your community? 5 10 12 17 Do you feel listened to and understood when you contact the council for help and information? 6 9 13 16 Is it easy to use parks and go to countryside? 7 8 18 11 Is It easy to get to places you need to? 8 7 17 12 Do you help out in your local community? 8 7 13 16 Are you able to look after yourself or get help if you need it from friends or family? 9 6 23 6 Do you feel safe? 9 6 20 9 Would you pay more council tax to keep services running? 9 6 16 13 Do you feel healthy and happy? 10 5 21 8 Do you think Devon County Council has made good choices? 11 4 17 12 Do you think Devon is clean from litter and rubbish? 12 3 19 10 Do you meet up with friends or family? 12 3 24 5 

Comments
We need assistance on road maintenance and traffic calming (disability – no) So many services have stopped because of lack of money. No support when needed. Have to fight for what you can get. Systems aren’t simple. People have to fit the criteria rather than being people centred. I’m deaf and have problems speaking too. I live alone without family or friends. I can no longer access health or social services as the people involved want to talk to me face to face and get information from me. From GP to social services to NHS, no one seems to understand and the stress of trying to overcome this myself when it isn’t me at fault has caused me to retreat and be reclusive. I keep being told the law says organisations need to make reasonable adjustments, and email’s an easy one, but no one will do it and so I can’t access and am discriminated against as a result. St Thomas railway station needs a new working lift or built in slope as only accessible by stairs. Public toilets need to be open again all around the city, not just disabled ones. [Exeter] There is a definite lack of visible police presence where I live especially during the day and at weekends when the boy racers are about. The Town definitely does not look clean especially after recycle collections with spilled items left in the road. I don’t think I could afford to pay more Council Tax, it is difficult for me to understand what I get for my money. Although I say it is easy to get places easily – you ought to try travelling to RD and E hospital on a regular basis then find a parking space and pay extortionate parking fees. [Seaton] (disability – no) As a rural county Devon does almost nothing to help those living in the countryside to access services (disability- no) - Participation Data
Diversity
Population data source: ONS
Total population: around 795,000 Devon population (County Council area) % Survey respondents % Locality
Live in a town or city 48.3 63 Live in a rural area 51.7 35 Age
(ONS Mid Year estimates 2018): Under 16 16.4 3.75 16 to 19 4.4 5 20 to 24 5.55 3.91 25 to 34 10.70 10.8 35 to 49 17.84 24.4 50 to 64 21.14 30.3 65 to 74 13.67 15.9 75 and over 11.51 5.3 Employment status
(based on ONS Census 2011) Employed full time or part time (including self-employed) Approximately 46% 58.5 In education or training Approximately 5.5% (plus approx. 16% under 16s) 8.5 Looking after my children/grandchildren full time OR Looking after an adult with ill health, disability or old age (as a family or volunteer carer) Approximately 2.5% 3.6 Not in employment, education or training and able to work ‘NEET’/unemployed/other Approximately 2% 2 Retired Approximately 24% 22 Unable to work due to ill health Approximately 2.5% 4 Income
Less than 16,000 a year Data unavailable but average full time salary is £27,129 and part time is £10,426. 17.8 Between £16,000 and £24,999 a year As above. 20.7 Between £25,000 and £45,000 a year As above. 29.4 Over £45,000 As above. 21.75 DCC contact
Are you or members of your family currently receiving ongoing services through Devon County Council such as education, family or social care? n/a 23.7 Private vehicle
Do you have use of a car (or other private motor vehicle)? – answer ‘no’ 17.4 (27.1 in Exeter) 15.5 Gender
ONS Census 2011: Female 51.4 59.3 Male 48.6 37.5 Other/non-binary Not recorded in the census (estimated around 1% of people) 1.8 Disability
Disabled 19.5 16.6 Ethnic origin
Black, Asian or other ethnic minority (includes Gypsy / Traveller, White – other, and Mixed Heritage 5.1 (likely to have increased since 2011 census) 9 White – British 94.9 87.6 Sexual orientation / gender reassignment
Do you identify as LGBT+? No Not recorded in the census 85.7 Yes – LGB (lesbian, gay or bisexual) Not recorded in the census but estimates are around 7% 8.2 Yes – transgender or formerly transgender Not recorded in the census but estimates are around 1% 1 Unsure / questioning my sexual orientation or gender identity Not recorded 2 Multiple responses were allowed. Religion and belief
Christian 61.5 35.75 No religion / belief 28.5 (8.4% did not state) 54 Other religion / belief 1.6 6.2 [where the total does not add up to 100% the gap is the percentage of people who did not give a response to that question]
Postcode / locality engagement
Postcode Electoral division included in this postcode County Councillors Population Survey respondents % EX1 Exeter (St Davids & Haven Banks, St Sidwell’s & St James, Heavitree & Whipton Barton, Broadclyst, Pinhoe & Mincinglake, Wonford & St Loyes
Cllr Carol Whitton, Cllr Su Aves, Cllr Greg Sheldon, Cllr Ray Bloxham, Cllr Sara Randall-Johnson, Cllr Hilary Ackland, Cllr Marina Asvachin (24,501) 3.1% 5.3 EX2 Exeter (St Davids & Haven Banks, Wearside & Topsham, Heavitree & Whipton Barton, Wonford & St Loyes, St Sidwell’s & St James, Broadclyst, Alphington & Cowick, Exminster & Haldon)
Cllr Carol Whitton, Cllr Andrew Leadbetter, Cllr Greg Sheldon, Cllr Marina Asvachin, Cllr Su Aves, Cllr Ray Bloxham, Cllr Sara Randall-Johnson, Cllr Yvonne Atkinson, Cllr Alan Connett (45,584) 5.7% 8.4 EX3 Exeter (Wearside & Topsham, Broadclyst, Wonford & St Loyes), Exmouth
Cllr Andrew Leadbetter, Cllr Ray Bloxham, Cllr Sara Randall-Johnson, Cllr Marina Asvachin, Cllr Richard Scott, Cllr Jeffrey Trail. (5,594) 0.7% 1.8 EX4 Exeter (Broadclyst, Exwick & St Thomas, Alphington & Cowick, St Sidwell’s and St James, Exminster & Haldon, St Davids & Haven Banks, Duryard & Pennsylvania, Pinhoe & Mincinglake, Heavitree & Whipton Barton Cllr Ray Bloxham, Cllr Sara Randall-Johnson, Cllr Rob Hannaford, Cllr Yvonne Atkinson, Cllr Su Aves, Cllr Alan Connett, Cllr Carol Whitton, Cllr Percy Prowse, Cllr Hilary Ackland, Cllr Greg Sheldon (61,033) 7.7% 10.4 EX5 Exeter (Broadclyst), Exmouth, Otter Valley, Whimple & Blackdown, Feniton & Honiton, Creedy, Taw & Mid Exe, Cullompton & Bradninch Cllr Ray Bloxham, Cllr Sara Randall-Johnson, Cllr Richard Scott, Cllr Jeffrey Trail, Cllr Clare Wright, Cllr Iain Chubb, Cllr Phillip Twiss, Cllr Margaret Squires, Cllr John Berry (23,531) 3.0% 6.1 EX6 Chudleigh & Teign Valley, Crediton, Hatherleigh & Chagford, Exminster & Haldon, Exeter (Wonford & St Loyes), Dawlish Cllr Jerry Brook, Cllr Nick Way, Cllr James McInnes, Cllr Alan Connett, Cllr Marina Asvachin, Cllr John Clatworthy (14,784) 1.9% 2.9 EX7 Dawlish, Teignmouth, Exminster & Haldon Cllr John Clatworthy, Cllr Sylvia Russell, Cllr Alan Connett (14,274) 1.8% 1 EX8 Exmouth, Exmouth & Budleigh Salterton coastal Cllr Richard Scott, Cllr Jeffrey Trail, Cllr Christine Channon (38,141) 4.8% 3.3 EX9 Exmouth & Budleigh Salterton coastal, Otter Valley Cllr Christine Channon, Cllr Clare Wright (7,025) 0.9% 0.1 EX10 Otter Valley, Sidmouth, Seaton & Colyton Cllr Clare Wright, Cllr Stuart Hughes, Cllr Martin Shaw (17,603) 2.2% 1.9 EX11 Ottery Valley, Whimple & Blackdown, Broadclyst Cllr Clare Wright, Cllr Iain Chubb, Cllr Ray Bloxham, Cllr Sara Randall-Johnson (8,892) 1.1% 1 EX12 Seaton & Colyton, Axminster Cllr Martin Shaw, Cllr Ian Hall (9,671) 1.2% 2.3 EX13 Axminster, Whimple & Blackdown, Seaton & Colyton Cllr Ian Hall, Cllr Iain Chubb, Cllr Martin Shaw (12,776) 1.6% 1.1 EX14 Honiton, Feniton, Otter Valley, Whimple & Blackdown, Willand & Uffculme, Seaton & Colyton Cllr Phillip Twiss, Cllr Clare Wright, Cllr Iain Chubb, Cllr Ray Radford, Cllr Martin Shaw (21,504) 2.7% 1.6 EX15 Cullompton, Bradninch, Tiverton east, Creedy, Taw & Mid Exe, Willand & Uffculme, Whimple & Blackdown, Broadclyst Cllr John Berry, Cllr Colin Slade, Cllr Margaret Squires, Cllr Ray Radford, Cllr Iain Chubb, Cllr Ray Bloxham, Cllr Sara Randall-Johnson (22,943) 2.9% 1.8 EX16 Tiverton west, Tiverton east, Willand & Uffculme, South Molton, Creedy, Taw & Mid Exe Cllr Polly Colthorpe, Cllr Colin Slade, Cllr Ray Radford, Cllr Jeremy Yabsley, Cllr Margaret Squires, (33,589) 4.2% 2.6 EX17 Creedy, Taw & Mid Exe, Crediton, South Molton, Hatherleigh & Chagford Cllr Margaret Squires, Cllr Nick Way, Cllr Jeremy Yabsley, Cllr James McInnes, (20,145) 2.5% 2.6 EX18 Chulmleigh & Landkey, Torrington rural, Creedy, Taw & Mid Exe Cllr Richard Edgell, Cllr Andrew Saywell, Cllr Margaret Squires, (3,221) 0.4% 0.7 EX19 Torrington rural, Hatherleigh & Chagford, Cllr Andrew Saywell, Cllr James McInnes (3,689) 0.5% 0.5 EX20 Okehampton rural, Hatherleigh & Chagford, Torrington rural, Creedy, Taw & Mid Exe, Yelverton rural Cllr Kevin Ball, Cllr James McInnes, Cllr Andrew Saywell, Cllr Margaret Squires, Cllr Phillip Sanders, (21,774) 2.7% 3.4 EX21 Okehampton rural, Hatherleigh & Chagford, Holsworthy rural, Torrington rural, Cllr Kevin Ball, Cllr James McInnes, Cllr Barry Parsons, Cllr Andrew Saywell (4,574) 0.6% 1.5 EX22 Holsworthy Cllr Barry Parsons (10,060) 1.3% 1.5 EX24 Seaton & Colyton, Whimple & Blackdown Cllr Martin Shaw, Cllr Iain Chubb (3,830) 0.5% 0 EX31 Barnstaple north, Barnstaple south, Fremington rural, Chulmleigh & Landkey, Torrington rural, Bideford east, Braunton rural, Combe Martin Cllr Brian Greenslade, Cllr John Mathews, Cllr Frank Biederman, Cllr Richard Edgell, Cllr Andrew Saywell, Cllr Linda Hellyer, Cllr Caroline Chugg, Cllr Andrea Davis (26,174) 3.3% 1.3 EX32 Chulmleigh & Landkey, Barnstaple south, South Molton, Barnstaple north, Combe Martin rural Cllr Richard Edgell, Cllr John Mathews, Cllr Jeremy Yabsley, Cllr Brian Greenslade, Cllr Andrea Davis (24,332) 3.1% 2.8 EX33 Braunton rural, Combe Martin rural, Barnstaple north Cllr Caroline Chugg, Cllr Andrea Davis, Cllr Brian Greenslade (10,865) 1.4% 0.8 EX34 Combe Martin rural, Ilfracombe Cllr Andrea Davis, Cllr Paul Crabb (16,983) 2.1% 0.4 EX35 Combe Martin rural Cllr Andrea Davis (1,608) 0.2% 0 EX36 South Molton, Chulmleigh & Landkey Cllr Jeremy Yabsley, Cllr Richard Edgell (9,113) 1.1% 0.4 EX37 Chulmleigh & Landkey, Torrington rural, South Molton, Barnstaple north Cllr Richard Edgell, Cllr Andrew Saywell, Cllr Jeremy Yabsley, Cllr Brian Greenslade (3,661) 0.5% 0.1 EX38 Torrington rural, Bideford east, Holsworthy rural Cllr Andrew Saywell, Cllr Linda Hellyer, Cllr Barry Parsons (8,618) 1.1% 0.7 EX39 Northam, Bideford east, Bideford west & Hartland, Fremington rural, Holsworthy rural, Torrington rural Cllr Andrew Eastman, Cllr Linda Hellyer, Cllr Tony Inch, Cllr Frank Beiderman, Cllr Barry Parsons, Cllr Andrew Saywell (39,456) 5.0% 5.1 DT7 Axminster Cllr Ian Hall (1,891) 0.2% 0 PL6 Bickleigh & Wembury, Yelverton rural Cllr John Hart, Cllr Phillip Sanders (3,954) 0.5% 0.4 PL7 Bickleigh & Wembury, South Brent & Yealmpton, Yelverton rural Cllr John Hart, Cllr Richard Hosking, Cllr Phillip Sanders (1,706) 0.2% 0 PL8 South Brent and Yealmpton, Bickleigh & Wembury Cllr Richard Hosking, Cllr John Hart (6,271) 0.8% 0 PL9 Bickleigh & Wembury Cllr John Hart (3,310) 0.4% 0.1 PL15 Holsworthy rural, Okehampton rural Cllr Barry Parsons, Cllr Kevin Ball (865) 0.1% 0.1 PL16 Okehampton rural, Holsworthy rural Cllr Kevin Ball, Cllr Barry Parsons (2,024) 0.3% 0 PL19 Tavistock, Okehampton rural, Yelverton rural Cllr Debo Sellis, Cllr Kevin Ball, Cllr Phillip Sanders (16,493) 2.1% 0.6 PL20 Yelverton rural, South Brent & Yealmpton, Bovey rural, Tavistock Cllr Phillip Sanders, Cllr Richard Hosking, Cllr George Gribble, Cllr Debo Sellis (12,157) 1.5% 1.5 PL21 Ivybridge, South Brent & Yealmpton, Salcombe, Bickleigh & Wembury Cllr Roger Croad, Cllr Richard Hosking, Cllr Rufus Gilbert, Cllr John Hart (18,041) 2.3% 2 TA4, TA20 and TA3 Whimple & Blackdown Cllr Iain Chubb (23) 0.0% 0 TA21 Willand & Uffculme Cllr Ray Radford (674) 0.1% 0 TA22 Tiverton west, South Molton Cllr Polly Colthorpe, Cllr Jeremy Yabsley (96) 0.0% 0 TQ1 Ipplepen & The Kerswells Cllr Alistair Dewhirst (87) 0.0% 0.8 TQ2 Ipplepen & The Kerswells Cllr Alistair Dewhirst (90) 0.0% 0.1 TQ3 Dartmouth & Marldon, Ipplepen & The Kerswells Cllr Jonathan Hawkins, Cllr Alistair Dewhirst (2,242) 0.3% 0.4 TQ5 Dartmouth & Marldon Cllr Jonathan Hawkins (540) 0.1% 0.4 TQ6 Dartmouth & Marldon, Kingsbridge Cllr Jonathan Hawkins, Cllr Julian Brazil (8,000) 1.0% 0.4 TQ7 Kingsbridge, Salcombe, South Brent & Yealmpton Cllr Julian Brazil, Cllr Rufus Gilbert, Cllr Richard Hosking (16,988 ) 2.1% 0.7 TQ8 Salcombe, Kingsbridge Cllr Rufus Gilbert, Cllr Julian Brazil (1,868) 0.2% 0.1 TQ9 Totnes & Dartington, South Brent & Yealmpton, Ashburton & Buckfastleigh, Dartmouth & Marldon, Ipplepen & The Kerswells, Kingsbridge, Salcombe Cllr Jacqi Hodgson, Cllr Richard Hosking, Cllr Stuart Barker, Cllr Jonathan Hawkins, Cllr Alistair Dewhirst, Cllr Julian Brazil, Cllr Rufus Gilbert (18,853) 2.4% 1.7 TQ10 South Brent & Yealmpton Cllr Richard Hosking (3,977) 0.5% 0.1 TQ11 Ashburton & Buckfastleigh, Totnes and Dartington, South Brent & Yealmpton Cllr Stuart Barker, Cllr Jacqi Hodgson, Cllr Richard Hosking (4,343) 0.5% 0.3 TQ12 Newton Abbot South, Newton Abbot North, Bovey rural, Kingsteignton & Teign Estuary, Ipplepen & The Kerswells, Dartmouth & Marldon, Ashburton & Buckfastleigh Cllr Gordon Hook, Cllr Jackie Hook, Cllr George Gribble, Cllr Ron Peart, Cllr Alistair Dewhirst, Cllr Jonathan Hawkins, Cllr Stuart Barker (56,839) 7.2% 5.4 TQ13 Chudleigh & Teign Valley, Kingsteignton & Teign Estuary, Ashburton & Buckfastleigh, Bovey rural, Totnes & Dartington, South Brent & Yealmpton, Hatherleigh & Chagford, Newton Abbot north Cllr Jerry Brook, Cllr Ron Peart, Cllr Stuart Barker, Cllr George Gribble, Cllr Jacqi Hodgson, Cllr Richard Hosking, Cllr James McInnes, Cllr Jackie Hook (23,897) 3.0% 2.9 TQ14 Ipplepen & The Kerswells, Teignmouth, Dawlish, Kingsteignton and Teign Estuary Cllr Alistair Dewhirst, Cllr Sylvia Russell, Cllr John Clatworthy, Cllr Ron Peart (20,002) 2.5% 2