Contents
Note that the term ‘carbon’ throughout this document refers to a basket of greenhouse gases, not just carbon dioxide, and is a term used for simplicity.
1. Summary
In February 2019 Devon County Council (DCC) declared a climate emergency and brought together partners to form the Devon Climate Emergency partnership. The partners prepared the Devon Climate Declaration, which requires its signatories to review their plans to reduce their own organisation’s carbon emissions. DCC signed the Declaration on 12th June 2019 and then brought out a new Carbon Reduction Plan in 2020 and adopted a target to achieve net-zero emissions by 2030. Subsequently, acting on the climate emergency has become a priority in DCC’s Strategic Plan.
There has been great progress on the 2020 Carbon Reduction Plan and DCC is ahead of the target to reduce emissions. Unsurprisingly given the innovative nature of some of the actions, there have been some projects which have not gone ahead. In addition, we have found it difficult to find carbon offset credits having had the opportunity to pilot various approaches. These conditions have prompted us to review the strategy and update our plans.
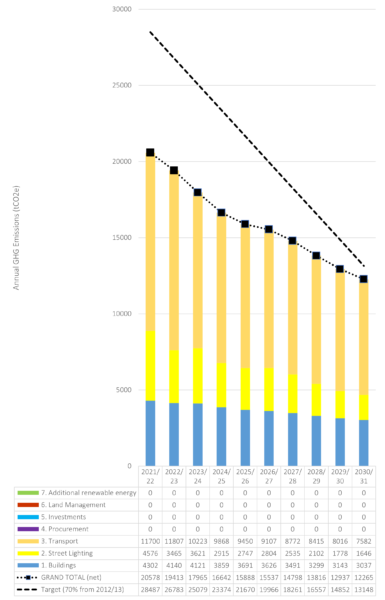
Figure 1 shows the revised strategic approach over the period to 2030 to achieve the adopted 2030 target.
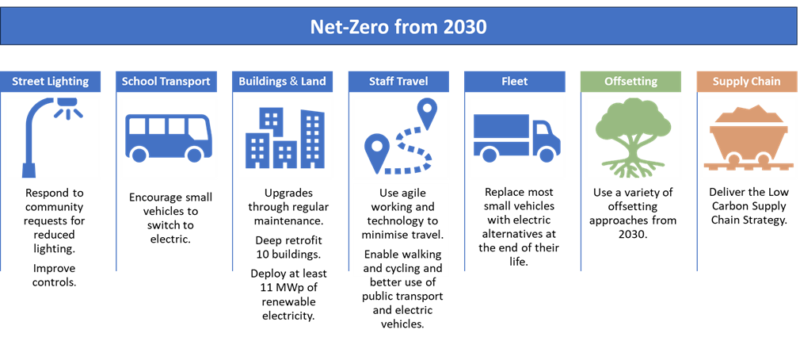
The strategy includes the following objectives and targets:
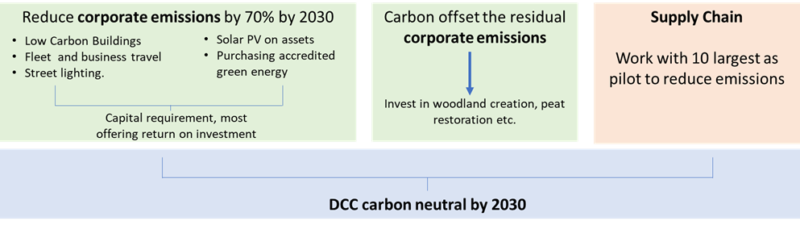
- retain the target to reduce the 2012/13 corporate carbon footprint by 70% by 2030/31, as a minimum,
- look to offset residual emissions from 2030/31 based on trials carried out since 2020 using several different approaches, and
- implement the Low Carbon Supply Chain Strategy.
Implemented in full, this strategy will reduce emissions by more than 70% by 2030 and set the foundations for the necessary further reductions after 2030 to minimise the need for offsetting.
In addition, we will continue to upgrade homes on the County Farms Estate and improve energy efficiency of maintained school buildings – these are not included in the corporate carbon footprint.
Innovation in technology and approaches to carbon offsetting are expected over the next 6 years. We will keep abreast of these and take opportunities to pilot them. We will review this Strategy and three-year Plan again in 2027 to take stock of progress and new opportunities.
2. Introduction
2.1. The Devon Climate Emergency
In February 2019 Devon County Council (DCC) declared a climate emergency and in May of the same year brought together partners from across the county to form the Devon Climate Emergency project. The partners prepared the Devon Climate Declaration, which requires its signatories to review their plans (within 6 months) to reduce their own organisation’s carbon emissions. DCC signed the Declaration on 12th June 2019 and then brought out a new Carbon Reduction Plan in 2020 to replace a 2014 plan. Subsequently, acting on the climate emergency has become a priority in DCC’s Strategic Plan.
2.2. Progress on the 2020 Plan
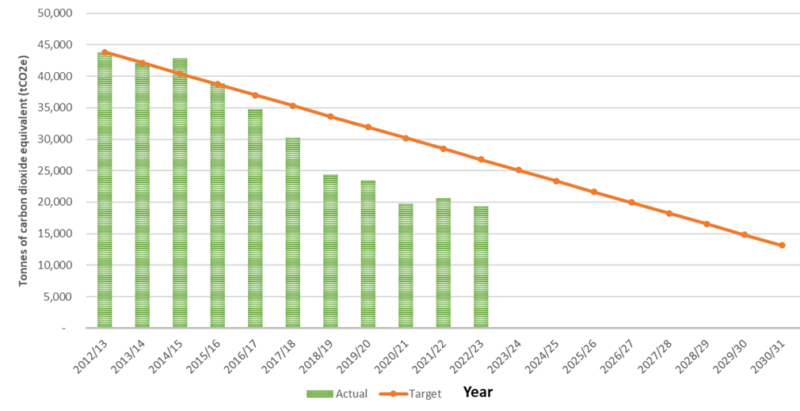
The 2020 Carbon Reduction Plan covered the actions needed to reach our target by 2030 and, as our monitoring (See Figure 3) shows, there has been good progress. In 22/23 the Council was ahead of the 70% reduction target by 2030 – the 22/23 total is 56% lower than in 2012/13 (see Figure 3).
This has been achieved by:
- Replacement of older boilers with condensing models through the maintenance programme
- Installation of LED lighting in corporate property through the maintenance programme.
- Installation of part-night and LED street lighting and traffic signal controls
- Deep retrofit of 9 buildings with Public Sector Decarbonisation Funding and our own capital contributions
- Gradual improvement in the carbon intensity of staff vehicles and purchase of electric vehicles
- Technology enabling less travel, such as Windows 10 and Microsoft Teams, greatly accelerated by the COVID pandemic.
- Reduced carbon intensity of grid electricity due to renewables – more than half now comes from non-fossil fuel sources and renewables can be as much as 75% generation on certain days.
Unsurprisingly some actions have proved to be difficult to implement – the plan proposed to be innovative and we have learnt a great deal. The areas where there has been less progress are:
- purchasing electricity supply from community-owned renewable energy installations to reduce scope 2 and 3 emissions – DCC’s Community Energy Fund provided grant funding to the Devon Energy Collective to run the Power Allotments project. This looked for opportunities for small solar farm opportunities in parishes across Devon. Many opportunities were found but the price per kWh was higher than expected,
- school transport – additional demand for school transport has driven a rise in emissions,
- buying offsets – it has proved very difficult to find UK-based carbon credits from natural solutions that could be used to net-off emissions before the mid-2030s, and
- working with suppliers – the Highways Carbon Project has made tremendous progress engaging with suppliers to secure data and action, however a lack of staff resource has halted progress on engaging with other suppliers.
2.3. Purpose of This Plan
This update builds on the learning of the last four years and responds to new opportunities. It presents actions for the next three years ready for a review in 2027.
3. Carbon Emissions
3.1. The Council’s Carbon Footprint
DCC’s carbon emissions are reported through two, separate carbon footprints: Its Corporate Carbon Footprint and its Supply Chain Carbon Footprint. A carbon footprint is always a work in progress as new areas emerge e.g. more homeworking, or new data becomes available or guidance changes. In 2023 we carried out a review of the scope of the Council’s footprint and have made some improvements to both footprints.
3.1.1. Corporate Carbon Footprint
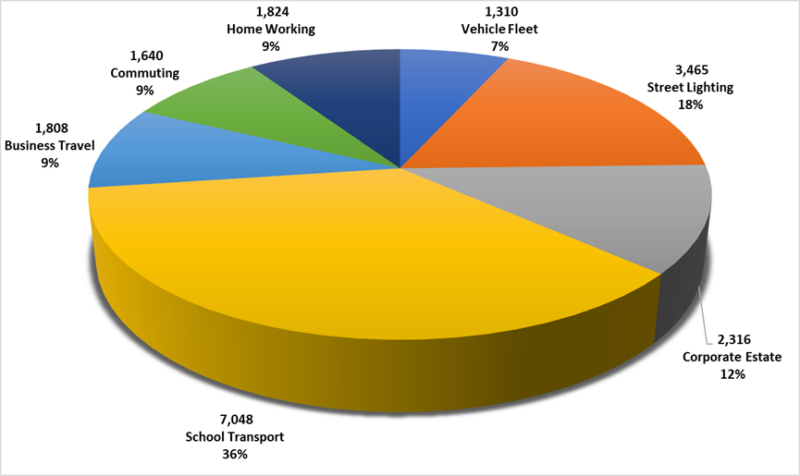
These are the emissions associated with the Council’s direct delivery of services through buildings, vehicles and street lighting that the council operates as well as staff travel, commuting and home-working. It does not include any procured goods or commissioned services, other than for school transport; this is because robust data is available from these contracts.
DCC’s corporate carbon footprint was last calculated for the financial year 2022/23. The carbon footprint is 19,400 tonnes of carbon dioxide equivalent (tCO¬2e). The components of DCC’s corporate carbon footprint are shown in Figure 4. School transport is the biggest source of emissions now.
We have made several improvements to the carbon footprint:
- adding in additional sources of emissions from commuting, homeworking, waste and emissions associated with electricity generation before generation (i.e. extraction of fossil fuels), and
- using a more accurate carbon factor for school buses and adding travel by main carers taking children to school in their vehicles where eligible for free school transport.
Overall, these changes have slightly increased the size of the footprint. We have re-baselined historic emissions to 2012/13 to ensure that year-on-year figures are comparable and the target percentage reduction is a fair reflection of changes. Therefore, figures in previous reports will not match those in this report.
3.1.2. Supply Chain Carbon Footprint
These are the emissions associated with goods that the council procures and the services that the council commissions.
The supply chain carbon footprint is currently calculated using nationally published carbon-intensity factors for different categories of purchasing by pounds spent. The drawback of this method is that the only way to reduce emissions is to reduce spend, which although sometimes is the best environmental option, is not always possible. Highways has pioneered an alternative approach of engaging with suppliers to secure data related to contracts. The Low Carbon Procurement Strategy sets out how this more proactive approach can be applied to the rest of DCC’s supply chain in a proportionate and manageable way. (see 4.1.2 below)
It is estimated to be 287 ktCO2e in 2022/23, which is about fourteen times larger than the corporate carbon footprint.
3.2. Improving the Calculation of Our Carbon Footprint
We will continue to improve the data quality and scope of our carbon footprint. The improvements described in the table below are anticipated.
Carbon data improvements
| Initiative | Funding | Timing | Lead | Comment |
|---|---|---|---|---|
| Methodology to estimate energy use in leased buildings, including libraries, County Farms, industrial units, depots, etc. | Existing staff time | 2025/26 | Environment Group with input from SW Norse | |
| Commuting survey of staff | Existing staff time | 2025/26 | Environment Group | HR and Internal Comms input needed |
| Carbon stocks and sequestration on Highways land and County Farms | Existing revenue | 2024/25 | Highway Systems and Environment Group | Study by specialist consultancy |
4. The Carbon Reduction Strategy
4.1. Strategy
Figure 1 (reproduced below) shows the revised strategic approach over the period to 2030. This is described in more detail in the sections below.
The council will:
- retain the adopted target to
- reduce the 2012/13 corporate carbon footprint by 70% by 2030/31, as a minimum
- offset residual emissions from 2030/31 based on trials carried out since 2020 using several different approaches, and
- implement the Low Procurement Strategy.
Innovation in technology and approaches to carbon offsetting are expected over the next 6 years. We will keep abreast of these and take opportunities to pilot them. We will review this Strategy and Plan again in 2027 to take stock of progress and new opportunities.
4.1.1. Corporate Carbon Footprint Emissions Reduction
The modelling undertaken for the Strategy to 2030 by the University of Exeter suggests that the lower-risk actions proposed combined with the effect of national trends – the decarbonisation of the grid in particular – should deliver a 72% reduction. Figure 5 below shows the results of this modelling.
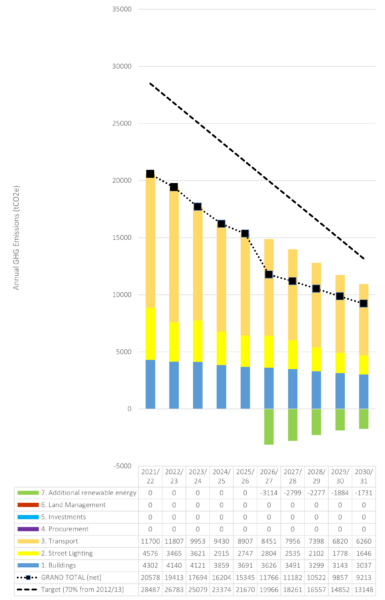
Adding actions where there is a higher level of risk over delivery results in a 79% reduction, which would require about 3,000 fewer carbon credits to achieve net-zero in 2030/31 – avoiding a cost of £225,000 at today’s prices. These projects are:
a) Encouragement of quicker take-up of electric taxis for school transport than the average Devon vehicle fleet. This would require measures to encourage taxi companies to change their vehicles and therefore staff resource to scope options and projects.
b) Development of 11MWp additional renewable energy capacity on DCC’s estate, consumed via direct wires or Power Purchase Agreements. Specific opportunities, grid connection costs and the outcome of planning permission applications are not yet known.
Figure 6 shows what could be achieved if these additional actions come to fruition.
Offsetting is the last resort and we now know that it will not be easy to find sufficient UK-based carbon credits for 2030/31 and beyond. In the last 4 years, we have investigated the market and trialled several different approaches. Carbon credits based on the Woodland and Peatland Carbon Codes are very difficult to find as few projects were registered long enough ago to provide credits in 2030/31. We are therefore testing new sources of carbon credits and will support new schemes to generate credits from energy efficiency retrofits and soil management in Devon.
Figure 6 shows the potential impact of DCC developing renewable energy installations on its own estate – the “negative” green bars under the x axis. It does not show the impact of purchasing carbon credits, which would extend those green bars to match the full-height of the bars above the axis.
4.1.2. Supply Chain Emissions Reduction
The reduction of the supply chain emissions will be progressed by the Low Carbon Supply Chain Strategy.
This strategy has four priority areas:
- Improving the quality of the supply-chain carbon data
- Procurement commissioning and contract management processes
- Supporting suppliers, and
- Supporting and training DCC staff.
As an interim target, the council aims to have 50% of its spend covered by suppliers’ net-zero targets by the end of 2025/26 (March 2026).
The Net Zero Highways Maintenance project is already tackling the supply chain for jobs like re-surfacing, patching, signal maintenance, etc. With the University of Exeter, we have developed and introduced a carbon calculator. We are now asking contractors to complete the calculator for jobs they do – from the materials used, the labour involved, the distance and the type of transport used to get the materials and engineers to site. This provides us with top-quality data and we can then identify carbon hotspots in highways maintenance leading to discussions with our contractors about how to reduce emissions.
In addition, DCC successfully gained funding for a Live Labs Net Zero road construction project for the A382. This allows us to test many innovative technologies to reduce the carbon emissions associated with construction and ongoing management.
4.2. Innovation
We will continue to evaluate and test new approaches and technologies for their ability to help contribute towards and exceed the targets. We are amongst the leading local authorities in this space and to remain so we accept that not all of these new approaches will be successful; we are prepared to take managed risks, learn from failures and share our new knowledge with partners.
4.3. Communications
Staff behaviour underpins several actions in the plan and therefore we have added actions on engagement and communications, including carbon literacy training.
In terms of external communications, we will join Race To Zero. This global pledge campaign is run by the United Nations (UNFCC) to rally leadership and support from businesses, cities, regions and investors for “a healthy, resilient, zero carbon recovery that…unlocks inclusive, sustainable growth.” Fifty-eight of the FTSE 100 companies have signed up and forty-nine English Councils, including Cornwall and Plymouth. National Park Authorities are being encouraged to sign up and we can therefore build momentum for a Devon-wide coalition. The benefits include recognition for the work that DCC is doing already, alignment with Corporate Strategy and greater profile for our work.
5. Reducing Corporate Emissions
The University of Exeter has assisted the council in understanding the effect of national policy on its carbon emissions over the next six years, as well as the effect of an increasing population putting more demand on the council’s services e.g. the additional street lighting that is likely to be added to the inventory as Devon’s population grows. Alongside these considerations, this plan updates the projects which will be implemented over the next three years.
There is a distinction between projects, which are already well-advanced and have resources allocated and those which are still in the development phase. In the tables below, new actions are in blue.
5.1. Low Carbon Buildings
5.1.1. Current Performance
| Baseline emissions from corporate property in 2012/13 = 8,137 tCO2e |
The buildings the council operates from emit 12% of its corporate carbon emissions. Carbon emissions from buildings have reduced by 72% since 2012/13 to 2,316 tCO¬2e in 2022/23.
This decrease is largely due to:
- ongoing property maintenance programme has implemented energy efficiency measures, such as replacement boilers, insulation and LED lighting.
- replacement of desktop personal computers with laptops and reducing the number of servers as storage and applications are moved to the cloud,
- more renewable energy providing the UK’s electricity that has reduced the carbon intensity of the UK’s grid-supplied electricity.
We completed deep retrofits of nine buildings in 2023 with external wall insulation, air source heat pumps and solar PV panels. Work was part-funded by external grants, such as the Public Sector Decarbonisation Fund, which meant we could do more, more quickly.
5.1.2. Local Action Plan
The projects described in Table 2 will be implemented to achieve carbon reductions of about 10% from corporate property beyond the effect of national policy. Confirmed disposals of buildings have also been factored in. Disposals are occurring partly due to lower use because of the increase in agile working. Emissions from home-working are included in DCC’s carbon footprint and therefore this transfer of carbon is accounted for.
Retrofit decisions will ensure best fit with property disposals.
Retrofitting buildings with low-carbon heating technology has only a small benefit to future energy costs because electricity per unit is more expensive than gas and oil and sector projections suggest it will stay that way for the next decade at least. Therefore the business case to retrofit buildings needs to be looked at more broadly to include the benefits to our health, wellbeing and service resilience from making buildings more comfortable in hot weather, improving internal air quality, making them warmer and less draughty and reduced maintenance costs from the higher quality doors and windows required to create energy efficient buildings (as reported by Exeter City Council’s Passivhaus programme to the Devon Climate Emergency Response Group).
New technologies are expected to mature which could help reduce the cost of creating low-carbon buildings significantly. These include high temperature heat pumps and innovations in electric boilers. We will keep abreast of these and look for opportunities to trial them.
Buildings – these actions contribute to CO2e emissions reducing by 646 tonnes per annum by 2030 compared to 2022/23
| Initiative | Cost | Funding | Timing | Lead Team | Comment | |
|---|---|---|---|---|---|---|
| 1 | Continue replacing fossil-fuel boilers at about 10 years old to benefit from efficiency improvements. | Building specific | Existing maintenance programme | Ongoing | Corporate Asset | It is not financially viable to replace every fossil-fuel boiler with a low carbon alternative as a deep retrofit of the building is often required (See Action 2). |
| 2a | Rolling programme of 3 – 4 energy assessments per year to identify retrofit opportunities. | £20,000 annually | Existing Carbon Reduction Plan revenue allocation | Annual | Environment Group | These will be completed to the PAS 28 Full Energy Assessments standard or as defined by the Public Sector Decarbonisation Scheme. |
| 2b | Carry out 10 deep retrofits | £10.2 million capital less revenue savings | . Options include Public Sector Decarbonisation Scheme DCC capital contribution, or green finance identified by the Innovate UK Fast Followers project. | 2025/26 onwards | Corporate Asset | Indicated cost is based on estimates per square meter from the UK Green Building Council. Buildings chosen with regard to disposals programme. |
| 3 | Pilot Energy Management Service | £20k a year, including cost of investigatory and remedial works. Estimated to save £38k per year. | Existing budget | Pilot during 2025/26 | Environment Group | This will ensure timely and reliable data is being recorded from each building and identify where buildings are not performing as expected. Based on 5% saving of energy use estimate. |
| 4 | Reduce number and improve efficiency of IT servers by moving to the cloud where possible and upgrading hardware. | Existing budget | 2023-2025 | ICT Strategy |
| Projected emissions from corporate property in 2030/31 = 1,670 tCO2e |
These actions, combined with the effect of national policy – the de-carbonisation of the grid in particular – will reduce annual carbon emissions from the council’s property to 1,670 tCO2e by 2030/31, a reduction of 79% since 2012/13.
5.2. Fleet, Business and School Transport
5.2.1. Current Performance
| Baseline emissions from fleet, business, commuting and school transport in 2012/13 = 17,171 tCO2e |
The annual carbon emissions from the council’s vehicle fleet, its staff undertaking travel for business purposes and the provision of school transport and commuting was 11,806 tCO2e in 2022/23, which represents 61% of the corporate carbon footprint. This has reduced by 31% since 2012/13.
Carbon emissions from the fleet have reduced by 44% below 2012/13 levels due to reduced mileage and the increasing efficiency of vehicles over time. Nineteen electric cars are in the fleet. The programme to install charge posts at our main offices is well under way.
Emissions from business travel have declined by 32% since 2012/13. Behaviour change enabled by more flexible and collaborative IT systems facilitating remote working and video calling which reduce the need to travel was reinforced during the Covid pandemic. Business travel has increased in the last two years but is still not at pre-pandemic levels.
Homeworking has risen sharply and an estimate has been brought into DCC’s footprint based on national carbon factors provided by the Government. In addition, we have added an estimate for commuting. DCC has introduced facilities for cyclists at many of its workplaces, including showers and a salary sacrifice scheme to make buying a bike easier. This incentive has now been extended to electric bikes and vehicles to encourage staff to switch together with charging points at our main workplaces.
School transport provided by the council uses bespoke software to help identify the most efficient routing of vehicles which is having tangible effects on carbon emissions. Routes are reviewed to spot opportunities for savings e.g. car-sharing. However, increasing demand for school transport has led to an increase in emissions associated with school transport. The DCC is looking at a range of options to reduce the need for travel but there are no easy solutions.
5.2.2. Local Action Plan
The projects described in Table will be implemented to achieve carbon reductions from fleet, business travel and school travel beyond the effect of national policy.
Transport – these actions contribute to CO2e emissions reducing by 4,224 tonnes per annum by 2030/31 compared to 2022/23
| Initiative | Cost | Funding | Timing | Lead team | Comment | |
| 5 | Encourage further behaviour change by raising staff awareness of low carbon business travel opportunities via regular communications and Carbon Literacy Training | £4,000 a year with external trainer | Existing staff resources and existing budgets of relevant service areas | 2024/25 onwards | Environment Group | |
| 6 | Install more publicly-accessible charging points at DCC work locations | Nil cost to DCC | Local Electric Vehicle Infrastructure (LEVI) project, or commercial chargepoint provider | Ongoing | Highways Operations & Communications | |
| 7 | Aspire to replace 12 fleet cars/vans a year with electric alternative to get to near 100% of DCC’s owned-fleet (cars and car-derived vans) to be electric by 2030/31. | £320k per year if 12 to be replaced, but will vary based on expired vehicles’ usage profile | DCC capital and capitalised revenue from Civil Enforcement Team | Ongoing | Safety, Compliance and Fleet | Vehicles will be replaced at the end of their useful life. Replacing vehicles more quickly results in net positive emissions due to the emissions associated with manufacturing. |
| 8 | Install fleet-only charging sockets at DCC workplaces/depots | Cost over six years £425,620 | DCC capital, earmarked in the capital plan. | Ongoing | Environment Group | |
| 9 | Encourage drivers contracted to deliver school transport in vehicles with 8 or less seats to switch to electric vehicles. | Staff time initially | No funding identified at this time. The market may provide cost-effective vehicles in the latter half of the 2020s. | Vehicle replacements expected 2026 – 2030/31 | Safety, Compliance and Fleet | Set up a monitoring system to capture contractors’ move to EVs. |
The anticipated increase of the proportion of biofuel in forecourt petrol and diesel supplies from 5% now to 11% by 2030/31 is expected to reduce emissions from the council’s transport operations together with the switch to electric vehicles. However, the county’s population is due to rise which will put additional demand for community services. It can be expected that the taxis and private cars used to transport children and by staff for commuting and travel for work will be switched to electric in line with national trends as a minimum. Overall, emissions from the council’s fleet, business, commuting and school transport are projected to decrease by 56%.
It must be acknowledged that electric variants of many types of vehicles in the council’s fleet are not currently available but are forecasted to be available by 2030/31. We will keep opportunities under review to expand the ambition on fleet electrification.
| Projected emissions from fleet, business, commuting and school transport in 2030/31 = 7,582 tCO2e |
5.3. Street Lighting
5.3.1. Current Performance
| Baseline emissions from street lighting in 2012/13 = 18,518 tCO2e |
The annual carbon emissions from the council’s street lighting in 2022-23 were 3,465 tCO2e, which represents 18% of the corporate carbon footprint. This has reduced by an amazing 81% since 2012/13 despite an increasing number of streetlights being added to the inventory due to new development. These reductions in electricity use since 12/13 saved around £5,000,000 in 22/23.
The considerable reduction has been achieved through:
- The part-night lighting programme that switches off lighting between 00:30 and 05:30 in locations away from principal routes
- The replacement of traditional lighting technologies with LED lamps in streetlights and traffic signals. These progressively dim during the night to make further energy savings.
- Removal of unnecessary lighting and illuminated bollards and signage.
5.3.2. Local Plan
The projects described in Table will be implemented to achieve carbon reductions from street lighting beyond the effect of national policy.
Street Lighting – these actions contribute to CO2e emissions reducing by 1,819 tonnes per annum by 2030 compared to 2022/23
| Initiative | Cost | Funding | Timing | Lead team | Comment | |
| 10 | Complete the replacement of traditional lighting technologies with LED lamps in streetlights that switch off between 00:30 and 05:30. Apply dimming controls installed as part of programme above | £9,000,000 | Capital already confirmed | Ongoing | Traffic Signals and Street Lighting | Programme is 90% complete. |
| 11 | Install Central Management System for street lighting | Included in Action 10. | Capital approved | 2024/25 | Traffic Signals and Street Lighting | This will make dimming and maintenance more responsive. |
| 12 | Respond to community requests to trial further adjustment of lighting if legal obligations and risk assessment allow. | Depends on specific requests | Staff time | Ongoing | Traffic Signals and Street Lighting | Officers will review policy and options before establishing how many parishes could be interested. |
The effect of the projected deployment of large-scale renewable energy on the UK’s electricity network by 2030/31 will be slightly countered by the anticipated growth in the street light inventory due to Devon’s population growth and associated infrastructure development. However, together with ongoing local action, annual emissions from the council’s street lighting is expected to reduce by 91% from 2012/13.
| Projected emissions from street lighting in 2030/31 = 1,646 tCO2e |
5.4. Additional Renewable Energy
5.4.1. Current Performance
Investment in renewable energy is a key component of our Net Zero Strategy. Achievement of the 70% reduction relies on decarbonisation of the electricity grid, which will only happen if more renewable energy installations are developed. Other benefits are reduced costs and income for the DCC as well as increased insulation from volatile prices. Increased local generation also contributes to a more resilient local energy network for Devon.
We have installed about 303 kWp of renewable electricity, which avoided emission of nearly 50 tCO2e in 2022/23 by enabling DCC to consume less grid electricity.
We have installed about 303 kWp of renewable electricity, which avoided emission of nearly 50 tCO2e in 2022/23 by enabling DCC to consume less grid electricity.
| Emissions avoided by renewable energy in 2022/23 = 50 tCO2e |
5.4.2. Local Action Plan
The effect of the projected deployment of large-scale renewable energy on the UK’s electricity network and the effect of the increase in the proportion of biofuel in the UK’s road transport fuels by 2030/31 has already been accounted for in sections 6.1, 6.2 and 6.3. Therefore, this section is only looking at the effect of additional renewable energy capacity that the council can develop or facilitate locally in Devon. Guidance on accounting for owned renewable energy where not directly connected to the organisation’s building is that energy exported to the grid can be set against Scope 2 (and Scope 3 associated with generation of electricity); “excess” electricity exported to the grid cannot be included as a negative.
The projects described in Table will be implemented to achieve carbon reductions through the deployment of additional renewable energy capacity on the County Council’s estate. This reduces risk but will be dependent on capital funding, which it is anticipated could come from green finance. We are reassessing the feasibility of potential renewable energy projects. There are many risks around gaining planning permission, avoiding environmental constraints and access to a grid connection.
We will look to develop 11 MWp given the strong business case in terms of price stability, reduced bills and export tariff. We are hopeful that ground-mounted solar PV can be funded by external green finance mechanisms and there could be a 20% saving on electricity costs and ground rental income for DCC, dependent on the finance model used. This would be sufficient to net off all emissions associated with electricity use (scope 2 and some scope 3).
Renewable Energy – these actions contribute to CO2e emissions reducing by an additional 1,731 tonnes per annum by 2030
| Initiative | Cost | Funding | Timing | Lead team | Comment | |
| 13 | Commission feasibility studies for renewables on DCC land or refresh of ones done already. | £35,000 per annum | Existing carbon reduction budget | From 2024/25 | Environment Group | Results expected March 2024 |
| 14 | Deploy at least 11 MW of additional renewable energy capacity e.g. solar photovoltaics on DCC assets by 2030/31. | £1.1m revenue over 6 years £17.7m capital. | Existing carbon reduction budget and grant funding. Range of green finance opportunities or DCC borrowing funded through financial returns. | From 2024/25 | Environment Group | Feasibility and planning Project development and installation |
5.5. Residual Corporate Emissions in 2030/1
The council’s forecasted residual corporate emissions in 2030/31 as a result of national trends and implementing the lower ambition projects in this plan are shown in Table 5 below.
| Source | 2012/13 | 2030/31 | % Reduction |
| Corporate Property | 8,137 | 1,670 | 79 |
| Fleet, Business and School Transport | 11,525 | 6,680 | 42 |
| Street Lighting | 18,518 | 1,646 | 91 |
| Commuting and homeworking | 5,646 | 2,269 | 60 |
| Additional Renewable Energy | – | – | |
| Total | 43,826 | 12,265 | 72 |
In comparison to 2012/13 emissions, this is a reduction of 72%. As a package, these activities will meet the target of a 70% reduction with a relatively high degree of certainty but there is no room for slippage. Table 6 below shows what is possible with a greater degree of ambition.
| Source | 2012/13 | 2030/31 | % Reduction |
| Corporate Property | 8,137 | 1,670 | 79 |
| Fleet, Business and School Transport | 11,525 | 5,358 | 54 |
| Street Lighting | 18,518 | 1,646 | 91 |
| Commuting and homeworking | 5,646 | 2,269 | 60 |
| Additional Renewable Energy | -1,731 | – | |
| Total | 43,826 | 9,212 | 79 |
5.6. Actions to de-carbonise beyond 2030/31
Beyond 2030/31 the Authority will need to eliminate residual emissions to get to carbon neutrality and reduce the reliance on offsets. Table 7 below sets out some potential projects, which could make a major contribution.
| Initiative | Cost | Funding | Timing | Comment | ||
| 15 | Electrify DCC owned mini-buses (more than 8 seats) on a planned replacement programme Investigate how to set up depots at Exeter and Dartington Put in EV charging points at Barnstaple Depot through LEVI | Work to estimate costs under way | Existing budget | Depot exploration ongoing Replace-ment likely to be after 2030/31 | (Passen-ger Services) | Issue with charging of mini-buses for Special Educational Needs (SEN) and Adult social care as no depots to charge them at and drivers take them home. Plus EV versions only just coming on to the market. (DCC owns these vans but contracts out to drivers) Would also need depots to provide charging points for vehicles associated with SEN. |
| 16 | Green gas from County Farms’ slurry pits used to supplement gas supply in DCC buildings/vehicles Or green hydrogen from renewables. | Funding for a pilot project agreed. | 2024/25 | Business Services | Look to roll out to other farms in County Estate and wider is successful. | |
| 17 | A382 live lab funding will enable testing of embodied carbon – to impact on procurement | In place | To 2025/26 | Engineer Design Group |
6. Offsetting Corporate Emissions
6.1. What is Offsetting?
Offsetting is the act of implementing a project elsewhere to avoid or store the same amount of carbon emissions arising from an activity for which it is difficult or very costly to reduce emissions to zero. Popular offset projects include planting trees (which absorb carbon dioxide whilst they are growing) or paying to install energy efficiency equipment in domestic or commercial premises. The common example of offsetting an activity is that of paying to plant some trees to absorb the same amount of carbon that has been emitted due to taking a flight to get to a holiday destination.
6.2. The Council’s Approach
The council has committed to offsetting 100% of its residual emissions in 2030/31 and every year thereafter to achieve net-zero carbon. With the lower ambition actions, in 2030/31 the council will need to offset about 12,300 tCO2e remaining after reducing emissions by 70% from 2012/13 levels.
Furthermore, the council has stipulated that it wants to use offsetting in Devon as an opportunity to enhance the natural environment to help address the closely related ecological crisis and develop economic opportunities related to offsetting locally.
However, it is not quite as simple as planting some trees or installing some insulation in a village hall. To ensure that the project really has achieved a reduction in emissions or is soaking up carbon, ideally it would be subject to independent verification to confirm that against a recognised code.
There are many international codes but fewer designed for the UK situation – the Woodland Carbon Code, Peatland Code, Wilder Carbon and Retrofit Credits developed by the Housing Associations’ Charitable Trust (HACT).
The 2020 Plan identified the lack of companies offering to deliver verified carbon offsets in Devon and therefore the need to stimulate a market for offset products. DCC decided to begin offsetting its residual emissions on a ramped basis immediately, starting with 5% of the residual emissions and up to 100% in 2030.
However, despite extensive enquiries with project developers and going out to tender it has so far proved impossible to find nature-based projects in the UK, let alone Devon, with carbon credits for sale for the period up to 2030/31. Having trialled a number of approaches to purchase woodland creation or peatland carbon credits we now know this will be very difficult by 2030 because:
a) woodland creation and peatland restoration take at least 10-15 years to start absorbing measurable amounts of carbon. Both codes are relatively recent and it’s taken time for landowners to start registering schemes i.e. not many before 2015-2020.
b) private landowners are hanging on to credits in the expectation that the price will rise.
We have bought Pending Issuance Units (PIUs) through the Woodland Trust (in Scotland) and North Devon Biosphere with most maturing after 2030. These will be useful to offset residual emissions after 2030 to maintain net zero status. In addition, we bought 11 hectares of pasture near Okehampton (Brook Wood) and are planning to plant this up and register for carbon credits in 2024. These carbon credits will mature after 2034. We are not proposing to buy more land as this project has proved to be a time-intensive way to deliver carbon credits and more expensive in the short to medium term. Once we have established a base-line for the greenhouse gas flux from DCC’s estate, it will be possible to use carbon reductions from tree planting and other interventions on DCC land as future “insets”.
Therefore, we are exploring other options through HACT and Wilder Carbon, which offer credits for the years up to and including 2030. However, they are more expensive. Given our experience, we will stop purchasing credits for the years up to 2030 and refocus budget and efforts on:
- reducing our emissions through consuming and purchasing renewable energy (the 11MWp mentioned above), and
- supporting the development of Devon-based projects, which may deliver credits for the early 2030s – soil management and retrofits for example,
- purchasing credits for 2030/31 and the early 2030s only.
On the lower ambition plan, this would be a cost of around £1,000,000 in 2030/31 assuming carbon prices rise in line with industry projections, and each year thereafter (whilst our residual emissions should continue to reduce beyond 2030, we anticipate that the price of carbon credits will increase and hence the cost will stay steady). This is very difficult to predict as the price projections for carbon credits vary widely.
7. Reducing School Buildings’ Emissions
7.1. Current Situation
The carbon footprint associated with the energy consumption of local authority-maintained schools’ buildings is monitored. In 2022/23 it was 2,589 tCO2e. It is difficult to compare with earlier years as more and more schools go for Academy status.
The council does not set targets to reduce the carbon footprint of local authority-maintained schools’ buildings as financial control and management decisions for many elements of building maintenance lie with the individual governing bodies.
7.2 The Council’s Approach
7.2.1. Existing School Buildings
The building maintenance activity that is the responsibility of the council will continue to look to install the best available technology for the budget available and make use of grant funding. As an example, the heating maintenance projects at Kenn and Denbury primary schools replaced old storage heaters with smart storage heaters, roof-top solar PV and battery storage to better align the renewable energy availability with the electricity demand in the schools. More recently reduced budgets and issues with the capacity of electricity supply for rural schools has limited action.
7.2.2. New School Buildings
Meeting current building regulations generally results in a new building achieving Energy Performance Certificate (EPC) level B. Innovative approaches to go beyond minimum requirements will be implemented where feasible: The budget for providing new school buildings is largely provided by national government using a prescribed formula. Examples of innovative approaches that have been implemented include the Montgomery Primary School in Exeter which was the UK’s first Passivhaus certified school and the new Loddiswell Primary School generates more energy over a year than it consumes and as a result has an EPC level of A+.
8. Reducing County Farm Dwellings’ Emissions
8.1. Current Situation
These agricultural properties are currently exempt from the Minimum Energy Efficiency Standards regulations that require landlords to upgrade the energy performance of tenanted properties. Nonetheless, DCC is committed to refurbishing county farm dwellings to reflect the decent homes standard.
Typical decent homes works include damp treatment, new bathrooms, new kitchens, mechanical ventilation in bathrooms and kitchens, whole house ventilation systems, new boilers for heating and hot water, rewiring, installation of LED lighting, loft insulation, cavity wall insulation and double glazed doors and windows.
Twenty-one of the completed refurbishments by 2022/23 have also received a roof top solar PV array and two farmhouses have got air-source heat pumps.
Energy efficiency improvements can be evidenced though improvements to the EPC rating. Chapel Farm is a good example of what has been achieved on even a relatively modern bungalow; the EPC was upgraded from a G to a C.
8.2. The Council’s Approach
DCC aims to complete decent homes refurbishments to the remaining 22 dwellings by 2030 subject to funding.
9. Monitoring
The council’s corporate and supply chain carbon footprints, and the school buildings’ carbon footprint, will continue to be reported annually.
The responsibility for the implementation of the individual projects within this plan sit with the relevant Head of Service.
The responsibility for monitoring the implementation of this plan as a whole lies with the Environmental Performance Board.
10. The Finance Plan
Tables 9 through to 11 set out the financial implications of this three year plan. A review will occur in 2027.
This is an indicative picture subject to finance being obtained through various mechanisms. These will include presentation of business cases for funding through DCC revenue and capital budget planning processes, external borrowing, community investment, private finance and grant funding.
10.1. Revenue Expenditure Detail 2024 – 2027
| 2024/25 | 2025/26 | 2026/27 | Cumulative | |
| Decarbonising Buildings | ||||
| Carbon Literacy training | 4,000 | 4,000 | 4,000 | 12,000 |
| Develop retrofit proposals | 20,000 | 20,000 | 40,000 | |
| Energy management service | 20,000 | |||
| Energy data service | 40,000 | 40,000 | 40,000 | 120,000 |
| Sub-Total | 64,000 | 64,000 | 64,000 | 172,000 |
| Carbon Offsetting | ||||
| Renewable energy opportunities studies | 35,000 | 35,000 | 35,000 | 105,000 |
| Renewable energy project development | 169,000 | 189,000 | 189,000 | 547,000 |
| Developing natural environment offset opportunities | 10,000 | 10,000 | 10,000 | 30,000 |
| Pilot carbon offsets for use in the early 2030s | 15,000 | 15,000 | 15,000 | 45,000 |
| Carbon flux study of all land assets | 20,000 | 20,000 | ||
| Sub-Total | 249,000 | 249,000 | 249,000 | 747,000 |
| Revenue Total | 313,000 | 313,000 | 313,000 | 919,000 |
Notes
2024/25 expenditure confirmed.
10.2. Capital Expenditure Detail 2024 – 2027
| 2024/25 | 2025/26 | 2026/27 | Cumulative | |
| Retrofit of 10 further buildings | – | 1,423,062 | 1,423,062 | 2,846,125 |
| At least 11 MWp new renewable energy | 65,000 | 1,600,000 | 3,200,000 | 4,865,000 |
| Replacing vehicles with EVs | 320,400 | 157,500 | 320,400 | 798,300 |
| Charging posts for electric vehicles | 127,000 | 94,800 | 221,800 | |
| Total | 512,400 | 3,180,562 | 5,038,262 | 8,731,225 |
| Of which, ask of Devon CC | 512,400 | 157,500 | 415,200 | 1,020,100 |
| Of which, could be external finance | – | 3,023,062 | 4,623,062 | 7,711,125 |
Notes
2024/25 expenditure confirmed. 2025/26 subject to active Capital programme approval. Onward years subject to future bids
10.3. Reduced Costs/Savings 2024 – 2027
| 2024/25 | 2025/26 | 2026/27 | Cumulative | |
| Building retrofit | 3,992 | 3,992 | ||
| Renewable energy (via Power Purchase Agreement)* | 13,683 | 13,683 | 27,142 | 27,142 |
| Electric vehicles | 47,137 | 55,063 | 71,353 | 126,416 |
| Energy management service @5% | 79,068 | 79,068 | ||
| Total | 60,821 | 68,746 | 181,554 | 236,617 |
Notes
*These savings would be achieved from 11MW of solar on DCC’s land being sold to an energy supplier and then purchased back by DCC via a Power Purchase Agreement. Significantly higher savings would be achieved from ‘direct wire’ installations but opportunities for these will be less common than the PPA option. The merits of operating and financing models will be considered on a case by case basis as opportunities are identified.