Purpose
This is a summary of Devon County Council’s annual carbon footprint report for the financial year April 2024 to March 2025 (2024/25). The Council’s greenhouse gas emissions are compared to previous years’ data and our baseline year of April 2012 to March 2013 (2012/13).
The Carbon Reduction Plan sets out the activities we are implementing now and over the next two years to achieve net-zero emissions by 2030/31. In other words, the Council’s remaining emissions will be matched by reductions and/or removals in other ways.

Summary
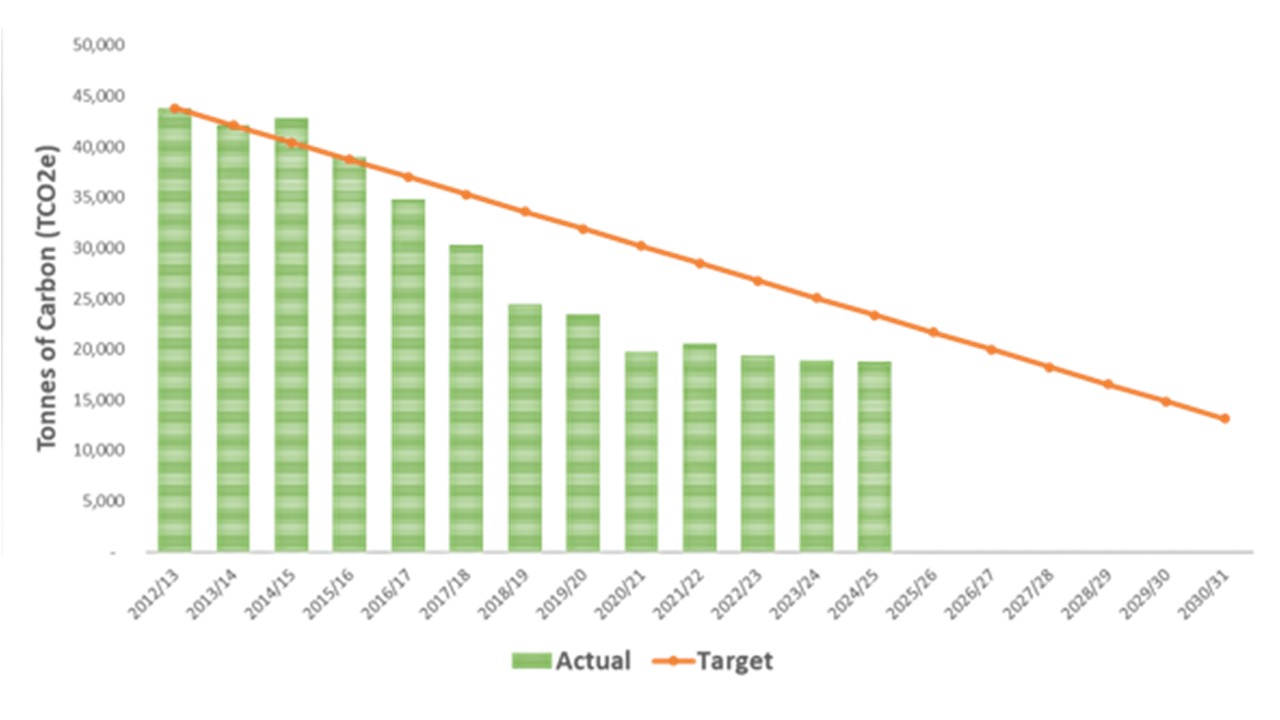
- There has been great progress and we are 57% below the baseline figure of 2012/13 and 1% below the previous year. We are ahead of target to achieve a 70% reduction by 2030.
- Total emissions were 18,775 tonnes of carbon – about 25,000 tonnes below the baseline year 12/13.
- Since 23/24, an increase in emissions associated with home-working, due to a greater number of staff, was countered by reductions in emissions from our buildings, fleet and business travel.
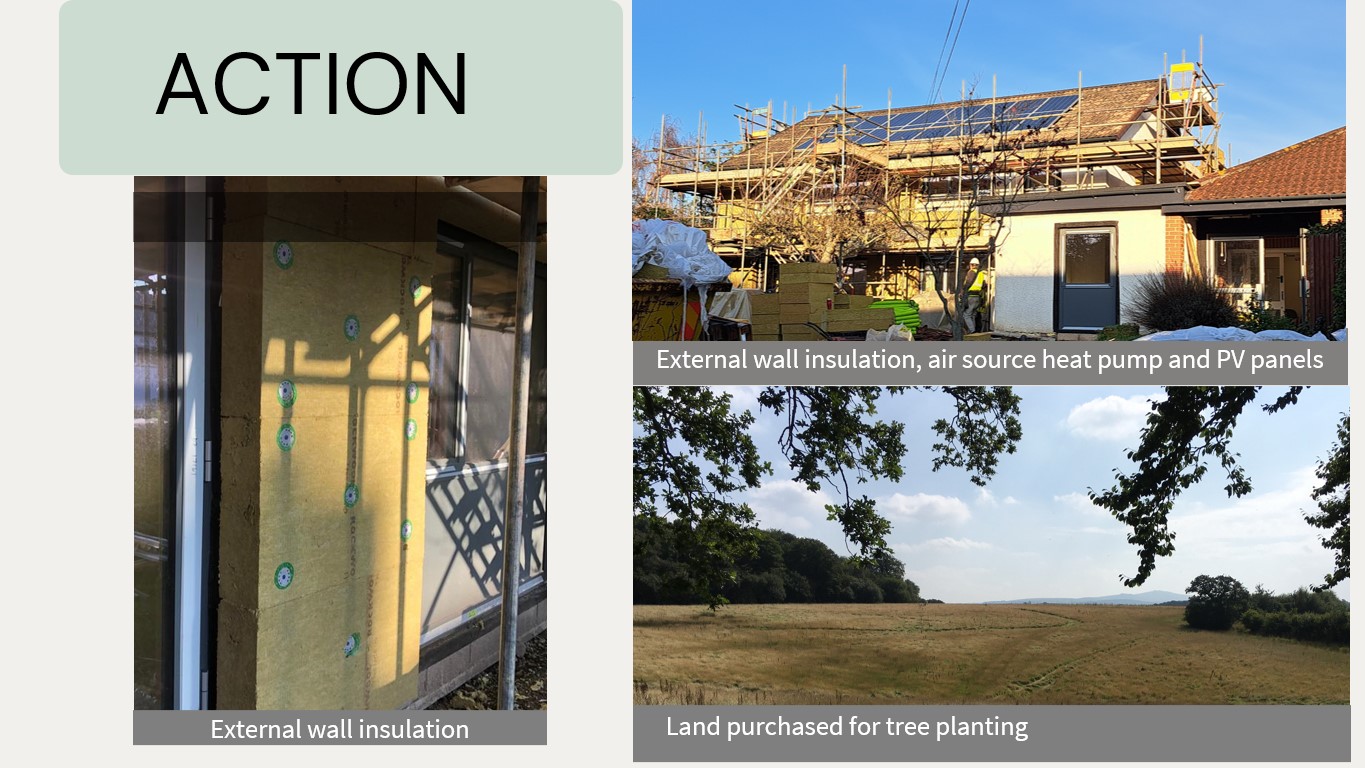
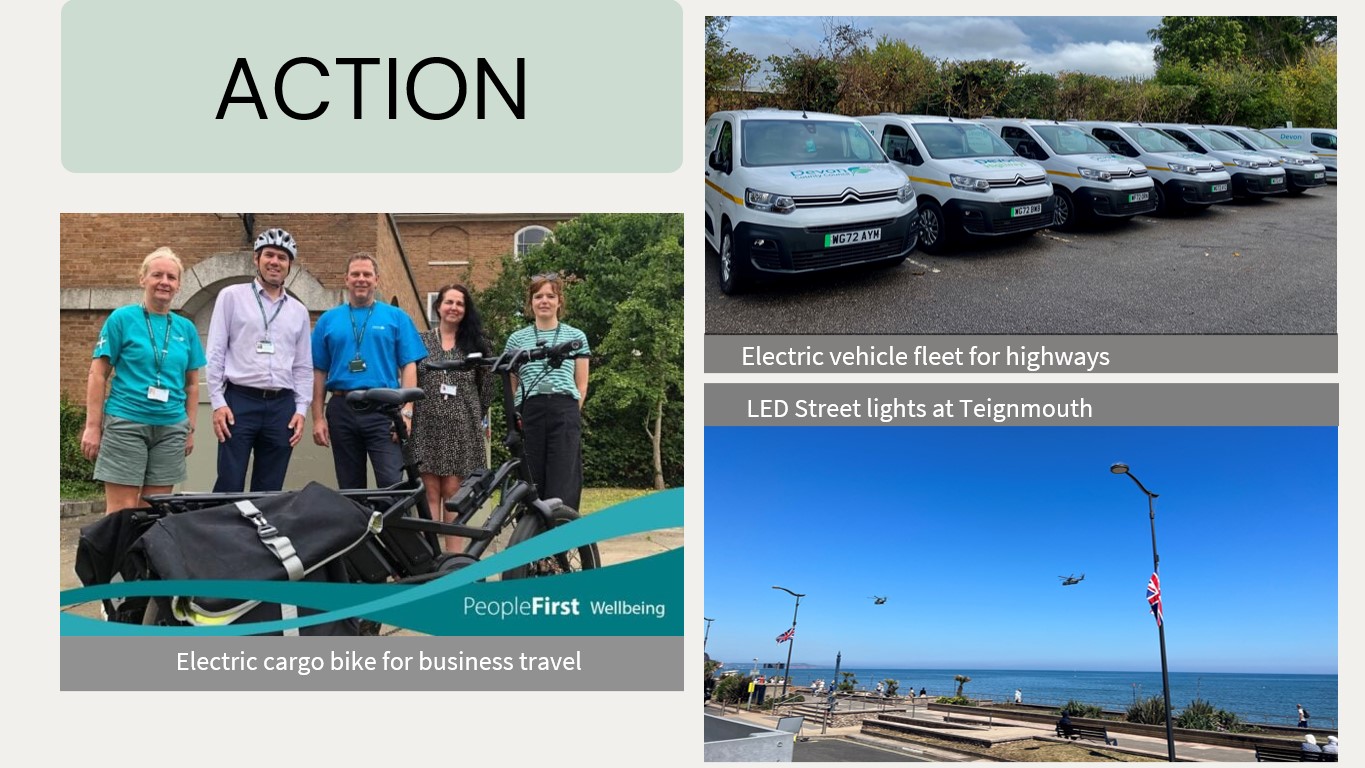
- Reductions are largely due to the replacement of older boilers, LED lightbulbs and greater controls on street lighting, electric fleet vehicles, staff reducing their travel for work, and retrofitting of 9 buildings.
- Overall, whilst we have made good progress – there is still a lot to do to achieve the net zero target.

Progress
This bar chart shows the gross corporate greenhouse gas emissions for each year. Included is an orange line showing the level below which our emissions need to be to reach our target of reducing gross corporate emissions by 70% by 2030 from 2012/13 levels. You can see emissions are below the line and we are ahead of where we need to be to meet our reduction targets. However, we need to make further large reductions to hit our target.
Source of emissions
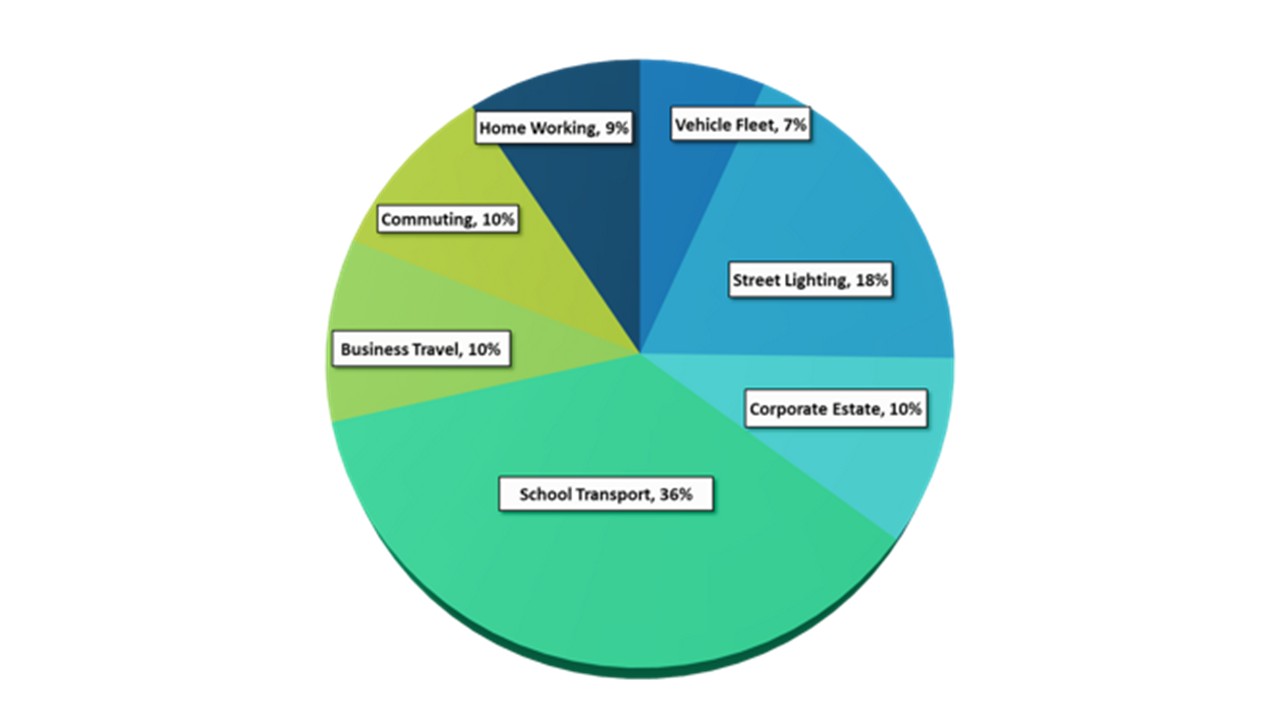
The biggest contributors to Devon County Councils carbon footprint emerged as school transport (taxis and buses) followed by street lighting and then the County Council’s buildings, commuting and business travel. The pie chart displays sources of emissions by percentage.
Benefits
- Increasing the efficiency of street lighting by installing LED light bulbs has reduced electricity bills by £4,948,292 in 2022/23.
- Investment in solar panels on our buildings generated about 213 MWh of clean, local energy in 24/25 saving about £65,000 and 60 tonnes of carbon, whilst air source heat pumps are providing renewable heat.
- Switching our smaller fleet cars to EVs is saving money and reducing air pollution.
- 17% of the fleet vehicles are now electric.

Action
Offsets
We are intending to offset the Council’s residual emissions through certified carbon offsetting mechanisms in the United Kingdom to achieve ‘net-zero emissions’.
We have built our experience in carbon offsetting by purchasing units under the Woodland Carbon Code and the UK Carbon Code of Conduct. We are working with a local landscape recovery project in Devon to supply the remaining credits we will need from 2030/31.
We bought 11 hectares of land near Okehampton to trial a more direct approach to offsetting; providing benefits for wildlife and public access. The trees were planted early 2025 and we are now validating the project under the Woodland Carbon Code, although we will keep the credits.