Purpose
Every year we produce an update of our carbon footprint – that is the greenhouse gas emissions produced by our activities. This report covers the financial year from April 2024 to March 2025 (referred to as 2024/25). These emissions are compared to previous years’ data and our baseline year of April 2012 to March 2013, allowing us to monitor progress towards the net zero by 2030 target. There is a quick-read summary webpage and summary in PDF format here.
The Carbon Reduction Strategy and Plan PDF (or webpage) explains the activities we are implementing over the next 5 years to achieve a net-zero operation.
Summary
Small reductions in emissions associated with the fleet, buildings, commuting and business travel were cancelled out by small increases from school transport and home working. The latter is due to an increase in staff numbers.
Overall, we are still 57% below the baseline figure of 2012/13 and ahead of target to achieve a 70% reduction by 2030 (see Figure 1). Although this is excellent progress, we need to reduce by 4% every year to hit our 70% target. In the last 4 years we have reduced emissions by 5% overall and if this rate of progress is maintained we will have to buy about 5,500 more carbon credits to get to net zero. (see Table 1)
Part A – Summary Table and Graphics
The Greenhouse Gas (GHG) Protocol sets the global standard for how to measure, manage and report a carbon footprint. Within the standard, emissions are split into three scopes:
- Scope 1 GHG emissions are ‘emissions from sources that are owned or controlled by the organisation’. In our case this is the burning of fossil fuel (e.g. gas and diesel) in buildings and our vehicle fleet.
- Scope 2 GHG emissions are defined as ‘emissions from the consumption of purchased energy’. In our case this is electricity.
- Scope 3 GHG emissions are defined as ‘emissions that are a consequence of the operations of an organisation but are not directly owned or controlled by the organisation’. Scope 3 is an optional reporting category which can include several different sources of GHG emissions. In this report we have included GHG emissions associated with providing ‘home to school’ transport, travelling for our work purposes, water consumption in our corporate buildings, home working and the GHGs emitted during the process of extracting, refining and delivering fossil fuels and electricity to our business locations – these are termed ‘Well to Tank’ emissions.
- We have been expecting the GHG Protocol to bring out guidance on accounting for emissions from land and its management and land-use change but it was again delayed last year. In anticipation, we commissioned the Centre of Energy and Environment at Exeter University to test a GIS-based methodology to estimate the carbon stocks and GHG flux from DCC’s land.
Table 1 shows our gross 2024/25 emissions in comparison to previous years and the baseline year of 2012/13. In addition, 2019/20 data is also included to show the difference with the pre-pandemic situation. The 2024/25 gross emissions are 57% below 2012/13 levels – ahead of target – and about 4,700 tonnes below 19/20 and over 25,000 tonnes below 12/13. In addition, the percentage change has been added, showing the gap between what we need to achieve and what we are achieving.
The data is displayed in tonnes of carbon dioxide equivalent. This is a measure of the effect of a basket of greenhouse gas emissions (such as methane and nitrous oxide) on the atmosphere, not just carbon dioxide. All the years are directly comparable as we have recalculated the data to remove the effect of significant changes to the organisation, such as a year where buildings were passed to another organisation to manage, or where additional sources of emissions have been brought in e.g. commuting.
Table 1: Devon County Council’s greenhouse gas emissions data for 2012/13, 2019/20, 2023/24 and 2024/25 displayed in tonnes of carbon dioxide equivalent (tCO2e.
| 2012/13 Base Year | 2019/20 | 2021/22 | 2023/24 | 2024-25 | % Change Base Year | |
| Scope 1 | 4,673 | 2,598 | 2,274 | 2,059 | 1,922 | -59% |
| Scope 2 | 18,701 | 6,262 | 4,153 | 3,213 | 3,230 | -83% |
| Scope 3 | 20,452 | 14,565 | 14,148 | 13,656 | 13,623 | -33% |
| Gross Emissions | 43,826 | 23,415 | 20,575 | 18,929 | 18,775 | -57% |
| tCO2e per £m of Gross Expenditure | 28 | 19 | 13 | 12 | 10 | -63% |
| Annual percentage change (target -4%) | -4 | 4 | -2 | -1 |
Figure 1 shows the gross corporate greenhouse gas emissions for each year on a bar chart. The orange line shows the level below which our emissions need to be to reach our target of reducing gross corporate emissions by 70% by 2030 from 2012/13 levels. We are still looking to offset the residual emissions through certified carbon offsetting mechanisms in the United Kingdom to achieve ‘net-zero emissions’.
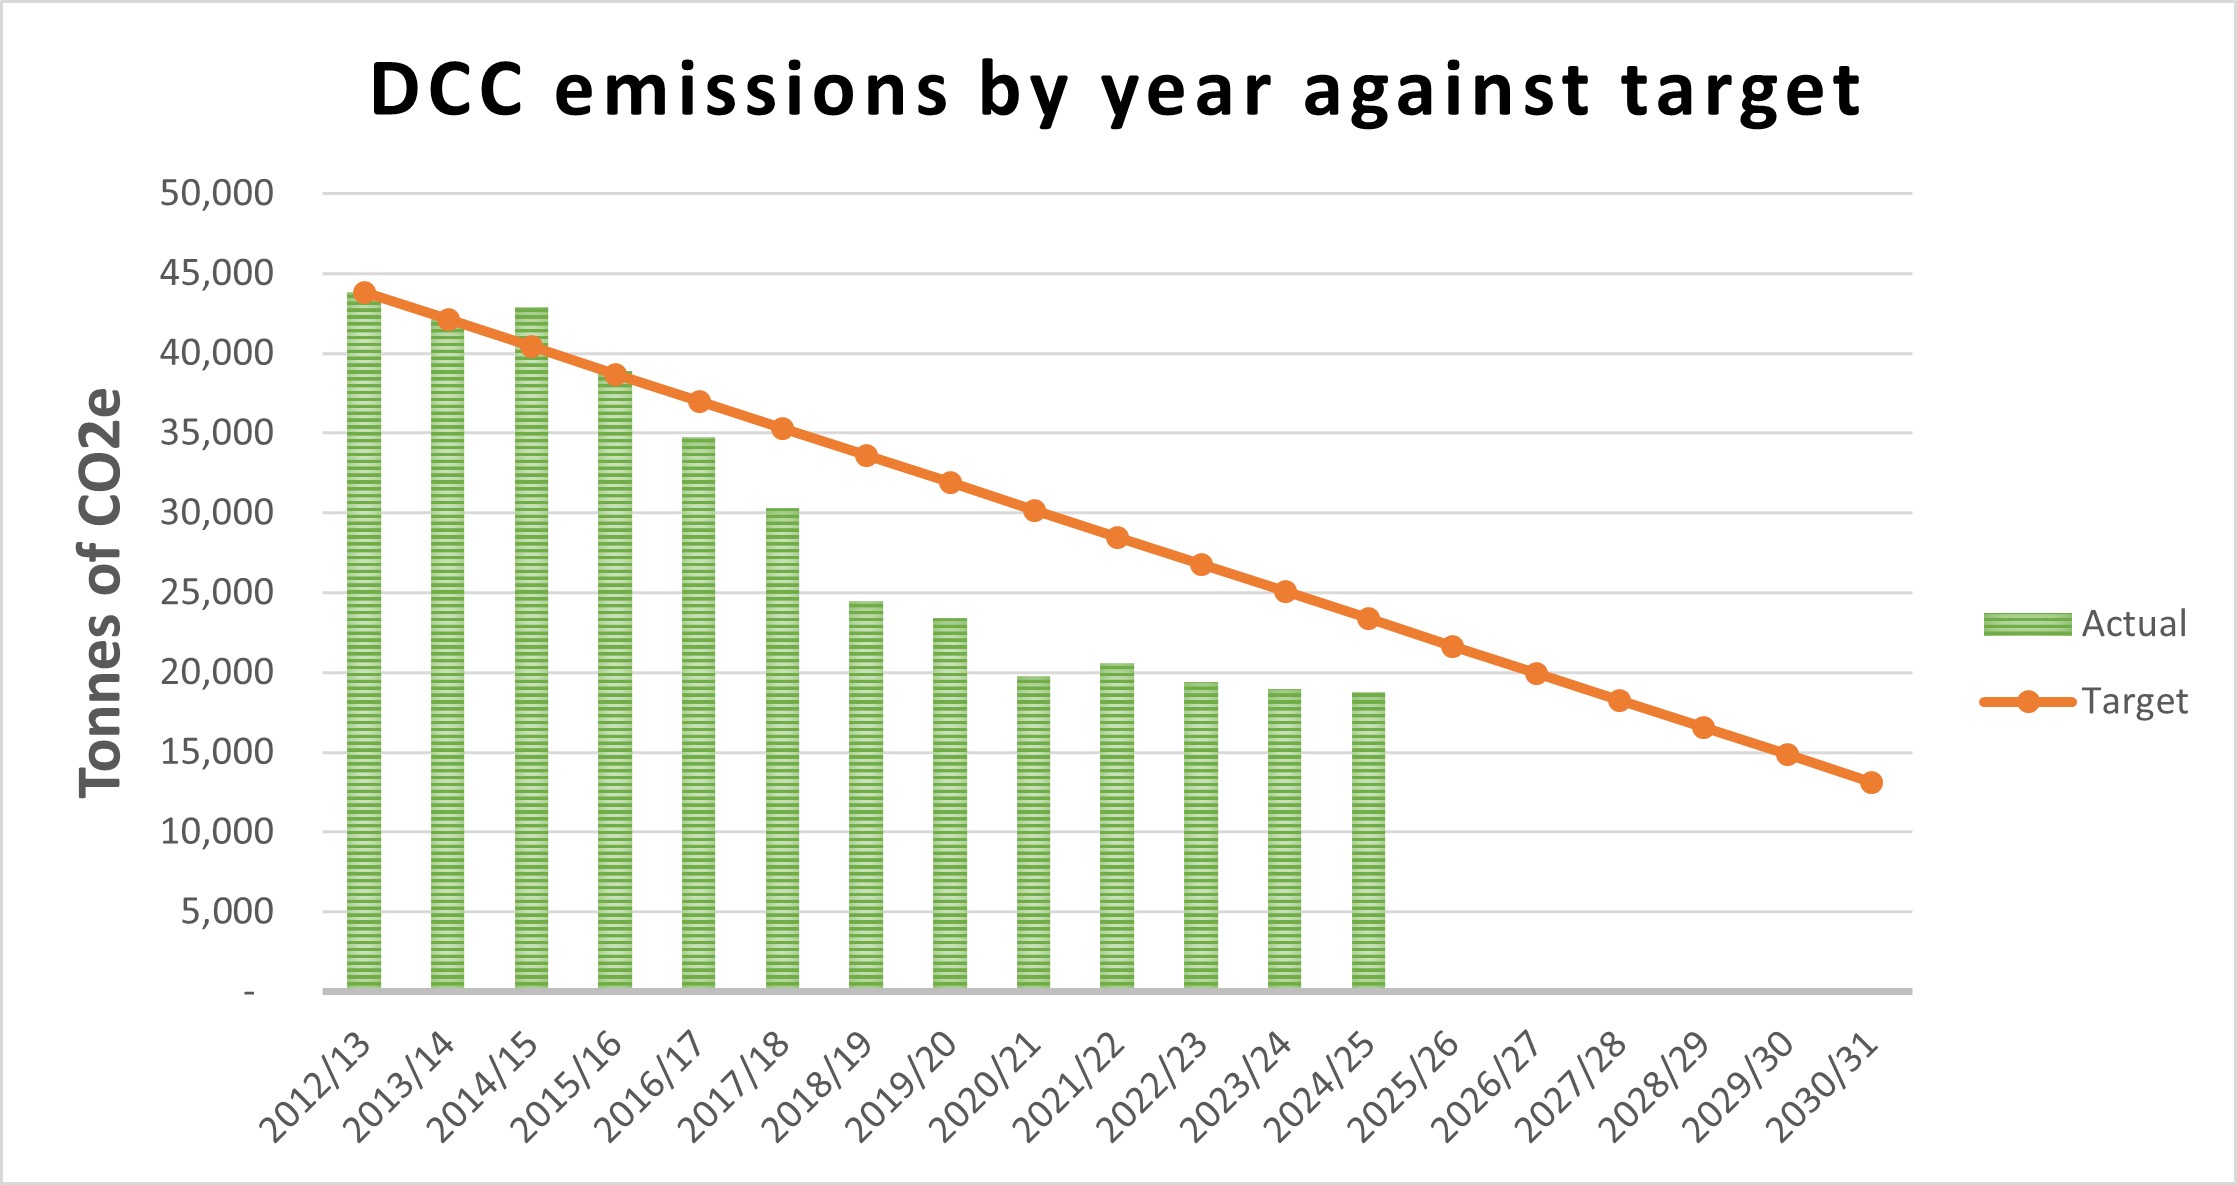
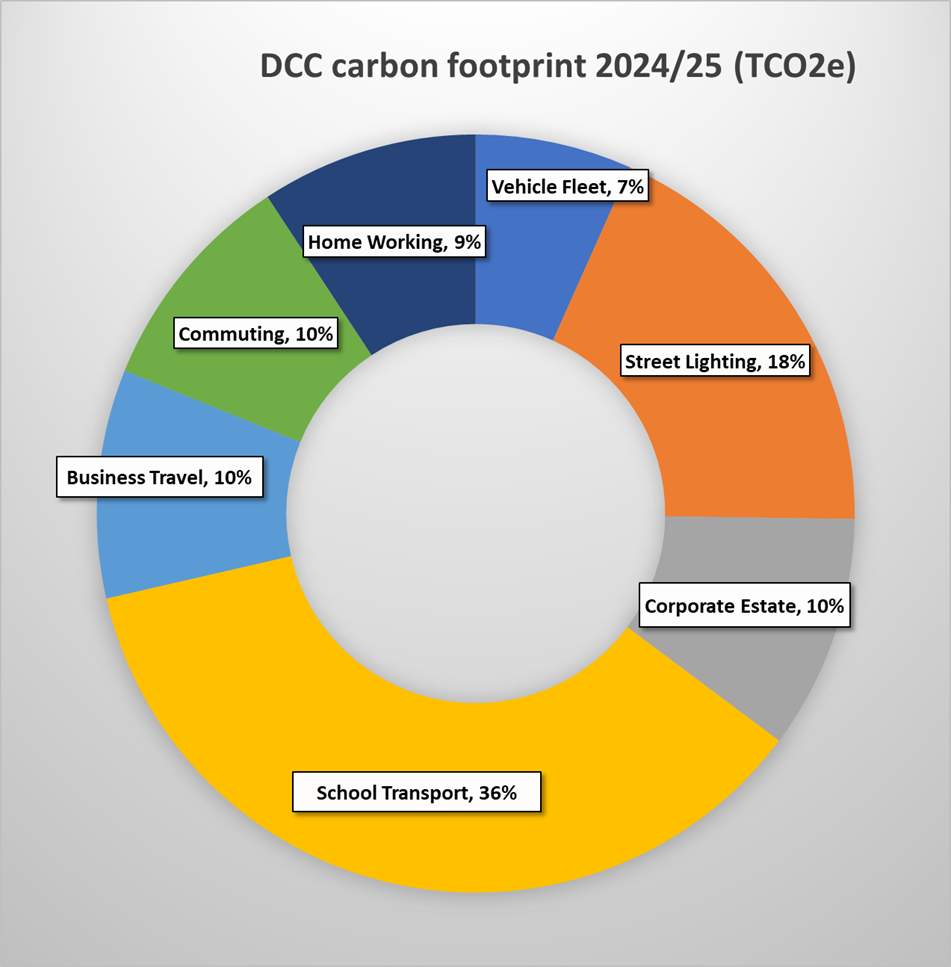
Figure 2 shows that emissions from school transport are still the biggest proportion of DCC’s carbon footprint and therefore we cannot afford to ignore them. We have been exploring various options to reduce emissions from school transport and are looking to scope a project this year to put in place funding and resources for next year.
Street lighting used to be the largest and significant investment in LED lighting and controls has made a big difference. We are looking at further dimming and switch offs where safe to do so but these are unlikely to bring in major reductions. Therefore, we are proposing major investment in renewables on our estate to “offset” emissions from grid electricity use, which further decarbonisation of the grid will support.
Part B – Supporting Explanations
Organisation Information
Devon County Council is the upper tier local authority in Devon, excluding the unitary areas of Torbay and Plymouth.
Quantification and Reporting Methodology
We have followed the Defra Guidance on ‘Environmental Reporting Guidelines: including mandatory greenhouse gas emissions reporting’ updated March 2019, which is heavily based on the GHG Protocol. The scope of the carbon footprint is based on our activities that can either be measured from consumption data or reasonably estimated from finance data. We have used the 2024 emissions factors from the Department for Business, Energy and Industrial Strategy for this assessment.
Organisational Boundary
DCC has used the financial control approach to identify operations from which to collect data. Therefore, schools and leased properties are excluded from scopes 1 and 2.
Operational Emissions
DCC measures its scope 1, 2 and available scope 3 emissions and also categorises them by activity. These are shown in Table 2 along with the change in the previous 12 months. The biggest percentage increase is for home-working, which shows how sensitive this is to staff numbers. The corporate estate shows the biggest reduction, which will in part be due to decarbonisation projects and disposals. The air source heat pumps at Great Moor House have only been partly commissioned due to issues with the grid connection. Solutions to this problem are being explored.
Table 2: Devon County Council’s gross greenhouse gas emissions in tonnes of carbon dioxide equivalent (tCO2e) by category.
| Category | 2023-24 | 2024-25 | % Change in last year |
|---|---|---|---|
| Vehicle Fleet | 1,287 | 1,255 | -2% |
| Street Lighting | 3,422 | 3,482 | 2% |
| Corporate Estate | 2,039 | 1,876 | -8% |
| School Transport | 6,716 | 6,793 | 1% |
| Business Travel | 1,669 | 1,831 | -4% |
| Commuting | 1,908 | 1,800 | -5% |
| Home Working | 1,655 | 1,738 | 5% |
| Total | 18,929 | 18,775 | -1% |
Current exclusions
Scope 1
- Emissions from air conditioning and refrigeration units not assessed as there is insufficient information about units. This is a regulatory issue, which needs to be addressed. Looking at data from other similar local authorities, it is likely that emissions are very small.
- Emissions and sequestration of greenhouse gases from land assets (County Farms, road verges, country parks, etc.) have been estimated by Exeter University using mapping data to estimate emissions from land. Whilst we now have a figure the potential range runs from net emitting to net sequestering. In addition, we do not have data on land management, road verge mapped as area, livestock numbers and chemical use which could change the picture dramatically. This does not give sufficient confidence to consider bringing into the footprint. We are looking at how we can refine the methodology. It does give us an order of magnitude – the range is between 2,796 tCO2e and -7,799 tCO2e and, assuming that land is in average management the best estimate is -3,146 tCO2e a year. These are significant quantities and also show the potential to increase sequestration on our estate.
Scope 3
- Commuting emissions are calculated using entry card data for offices and national averages for mode of transport and distance. It is proposed to run a staff commuting survey in 24/25 to gain a more accurate picture of staff commuting and home-working. The Met Office has kindly provided the survey that they use.
- Emissions from the fossil fuel and electricity used to operate school buildings. These are not formally reported as we do not have financial control over these assets and it is becoming increasingly difficult to access the data and more schools are becoming academies.
- Leased assets are excluded as there are very few buildings and the tenants have responsibility for paying the energy bills – we are looking to see if we can find a way to estimate these emissions.
Supply chain emissions are not part of the corporate carbon footprint and we will decide how to bring them in as we get a more accurate picture of how much and the biggest sources of emissions. We have updated our estimate based on spend by using 2019 carbon-emission conversion factors adjusted for inflation. Indicative carbon emissions from our supply chain for 2022/23, estimated using these updated factors for different types of public sector activity, were 101,285 tCO2e. - We have produced a draft Low Carbon Procurement Strategy, which sets out how we intend to tackle our supply chain emissions, which has now been signed off. We will be recruiting this autumn to replace the officer who left. We propose to work with larger suppliers to obtain actual emissions and have already started with highways maintenance contractors. We would then work with suppliers to reduce emissions.
Reasons for Changes in Emissions
Our gross GHG emissions are 57% below the 2012/13 base year. Reasons for this are:
- Replacement of older boilers with condensing models through the maintenance programme
- Installation of LED lighting in corporate property through the maintenance programme
- Installation of part-night and LED street lighting and traffic signal controls
- Deployment of renewable energy – solar PV – installations
- Deep retrofit of 9 buildings with Public Sector Decarbonisation Funding and our own capital contributions
- Gradual improvement in the carbon intensity of staff vehicles and purchase of electric vehicles
- Technology enabling less travel, such as Windows 10 and Microsoft Teams, greatly accelerated by the COVID pandemic.
- Reduced carbon intensity of grid electricity due to renewables – more than half now comes from non-fossil fuel sources and renewables can be as much as 75% generation on certain days. (National Grid: Live (iamkate.com))
Base Year
We recalculate the base year emissions whenever:
- Property disposals and terminated services represent 5% or more of base year emissions
- New properties, services or previously excluded emissions make the base year incomparable
- There is a significant change in reporting accuracy that makes the base year incomparable.
We re-calculated Base Year emissions and subsequent years’ emissions in 2017/18 to reflect the significant outsourcing of services and staff reductions that had occurred. In 2023 we recalculated the base-line to reflect the additional sources of emissions brought into the account (commuting and waste) and some changes to methodology. This means that figures in previous reports will no longer tally with those in this report.
2012/13 has been retained as the base year, which remains relevant in the context of our Carbon Reduction Plan and net zero target.
Target
Our 2019 Carbon Reduction Plan set targets to reduce the corporate carbon emissions by 70% over the 2012/13 baseline by 2030 and offset the remaining 30% to achieve ‘net-zero emissions’. We reviewed and updated the plan last year, which has now been signed off by Cabinet. It was agreed to retain the target, although if the plan is fully implemented it should be possible to exceed 70%.
Intensity Measurement
We have chosen to use Gross Operating Expenditure as the intensity measurement. This provides an indication of the extent of activity we deliver and is applicable to all components of the carbon footprint. Our gross emissions per million-pound spend, adjusted for inflation, has reduced by nearly 60% since 2012/13. (See Table 1)
External Assurance Statement
Our GHG emissions data is not covered by an External Assurance Statement.
Green Energy Tariffs
We have not purchased a green energy tariff, as there are serious concerns about the validity of these tariffs i.e. that they do not tie to real additional renewable energy generation. Instead, we investigated power purchase agreements (PPAs), where we would purchase electricity directly from an installation owned by a (community) energy company. However, the high development costs of relatively small schemes meant that the cost per kWh was prohibitive.
We are now looking to develop our own renewable energy installations – we can net off exported electricity against our scope 2 emissions. Even with de-carbonisation of the grid, this could be up to 1,000 tCO2e, which would make a significant difference at about a twelfth of predicted residual emissions.
Offsetting – Carbon Credit Units
We have built our experience in carbon offsetting by attempting to purchase Woodland Carbon Units to incrementally offset an increasing percentage of the remaining carbon footprint
from 5% in 2019/20 to 100% by 2030/31. This was not possible because the market could not provide enough units. Instead, we purchased Pending Issuance Units, issued under the Woodland Carbon Code, that will mature into Woodland Carbon Units in the late 2020s, 2030s and 2040s. We retired a very small number of Woodland Carbon Units (46) in 2018.
In March 2024, we bought actual carbon credits which we can retire in 2030/31, which is a big step forward. These are based on the UK Carbon Code of Conduct, which calculates carbon sequestration from changes to land management practices, such as hedge and tree planting and sowing wildflower meadows. The credits come from 2 farms in Sussex and Kent. We are working with similar projects in Devon to generate credits for DCC and other local organisations from 2030/31.
We bought 11 hectares of land near Okehampton to trial a more direct approach to offsetting. Whilst there are additional benefits for wildlife and public access, it has proven a very expensive way of generating credits. We successfully applied for grant money to plant the trees from the Plymouth and South Devon Community Forest and this was completed in early 2025. We have registered the project with the Woodland Carbon Code and are planning to verify the project with an external assessor this financial year.
Renewable Electricity Generation
Our solar PV arrays on non-school properties generated at least 213 MWh of renewable electricity in 2024/25 saving about 60 tCO2e and about £65,000. We installed three more solar PV roof systems on three depots in 2023/24 – Rydon, Honiton and Pathfields. An additional array has been installed at Tavistock depot in 24/25.
We secured funding from the SW Net Zero Hub to explore the technical and financial feasibility of solar PV arrays on 3 former landfill sites. We appointed the contractors and this work to be finished by end of August 2025 together with the business case for investment finance. The Authority will then need to make a decision whether and how to proceed. Other opportunities on our estate are also being explored.