The Environmental Performance Board meets quarterly to monitor progress of the projects we are implementing to achieve the objectives of our Environmental Policy. Recent Highlight Reports that the Board receives are available below:
- April 2022 – July 2022
- October 2022 – January 2023
- January 2023 – April 2023
- April 2023 – July 2023
- August 2023 – October 2023
- November 2023 – January 2024
- October 2024 – December 2024
- January 2026 – March 2026
We also monitor a set of environmental performance indicators to monitor progress against the environmental policy objectives. These are monitored annually.
Energy
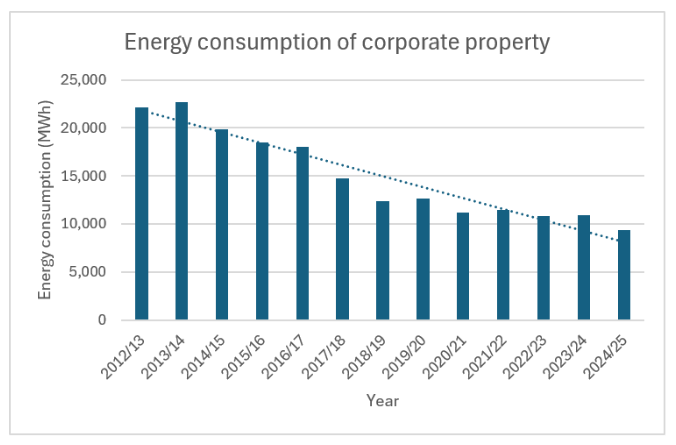
Energy consumption across the Council’s corporate property estate has fallen significantly since 2012/13, reducing from 22,108MWh to 9,356 MWh in 2024/25. This reflects energy efficiency improvements, estate rationalisation, building upgrades and changes in working practices.
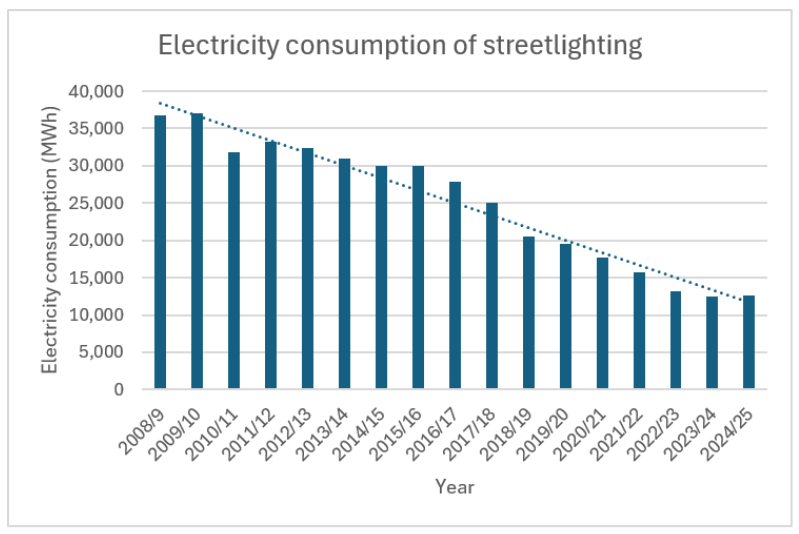
Electricity consumption of street lighting has also decreased substantially, falling from 32,441MWh in 2008/09 to 12,651 MWh in 2024/25. Investment in LED street lighting and controls has been a major contributor to these savings.
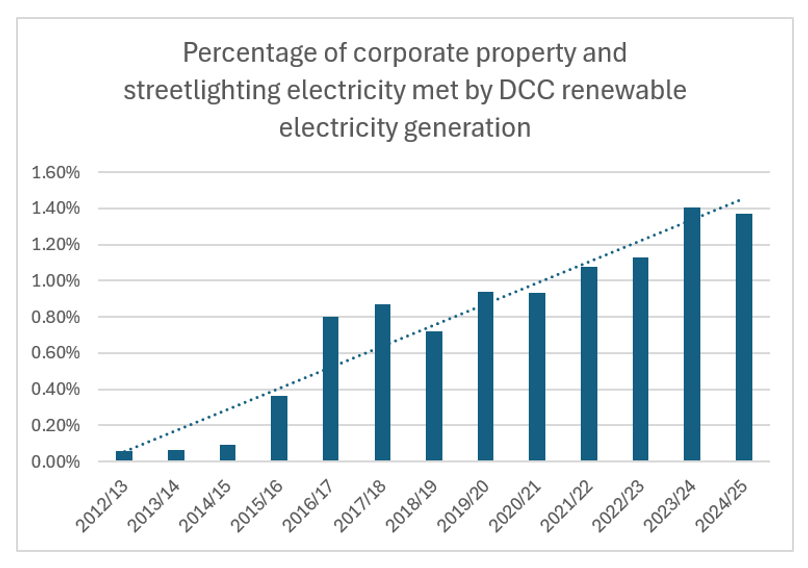
Electricity generated from Council-owned renewable energy generation continues to increase. Since monitoring began in 2012/13, output has risen steadily to 1.37% of total corporate property and street lighting electricity demand.
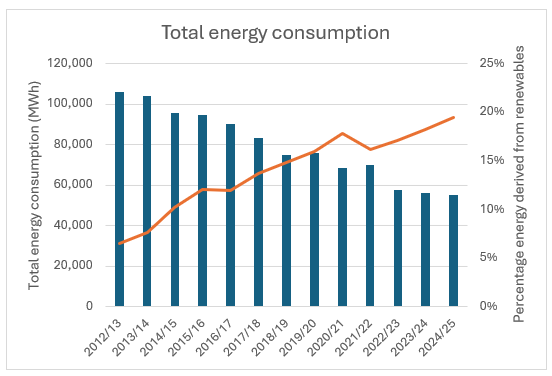
The percentage of energy derived from renewable sources has also increased consistently, reaching almost 20% in 2024/25 compared with 7% in 2012/13, while the council’s total energy consumption has decreased from 106,084 MWh to 54,912 MWh.
Transport
Business Travel Mileage
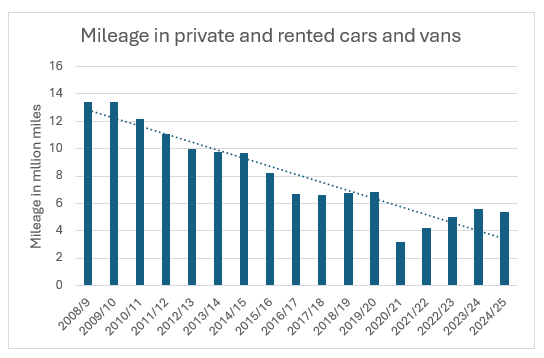
Mileage claimed through private and rented vehicles has reduced from 13.4 million miles in 2008/09 to 5.4 million miles in 2024/25. This reduction reflects changes in working practices, increased use of virtual meetings and efforts to minimise unnecessary travel.
Fleet
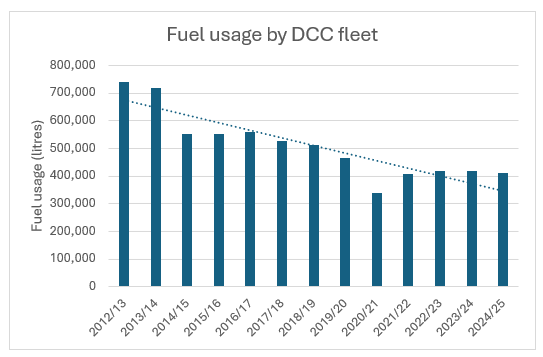
Fuel usage across the Council’s operational fleet has generally trended downward since 2012/13, reducing from 742,216 litres to 410,601 litres in 2024/25.
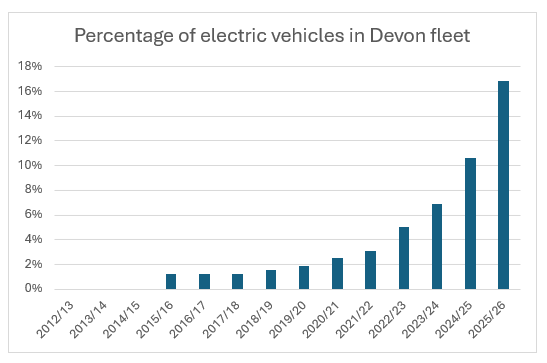
The proportion of electric vehicles within the Council’s fleet has risen rapidly in recent years. From no electric vehicles in 2012/13, the fleet now comprises 17% electric vehicles.
School Transport
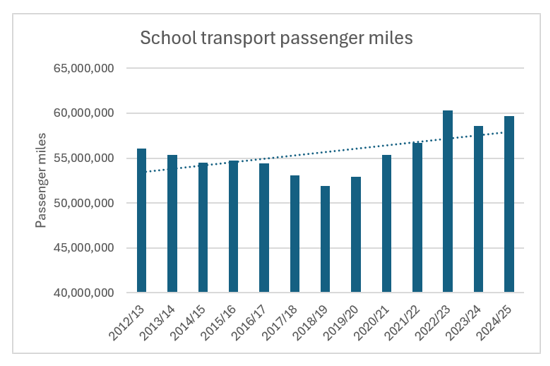
School transport passenger miles have remained comparatively stable over the reporting period, increasing slightly in recent years following lower levels observed between 2017/18 and 2020/21.
Greenhouse Gas Emissions
Corporate Carbon Footprint
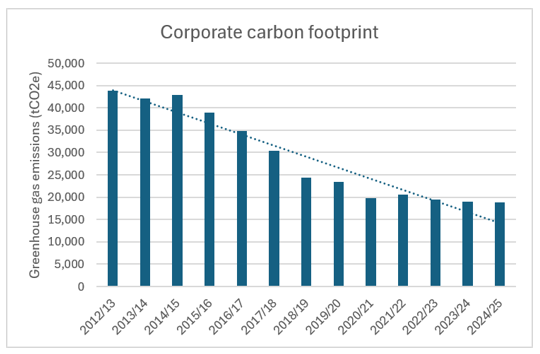
The Council’s corporate carbon footprint has reduced considerably since 2012/13, falling from 43,826 tonnes of carbon dioxide equivalent (tCO₂e) to 18,775 tCO₂e in 2024/25. This reduction reflects lower energy consumption, improved efficiency and decarbonisation measures across operations. More information can be found here: Carbon Footprint 2024/25 – Environment.
Progress Towards Carbon Reduction Targets
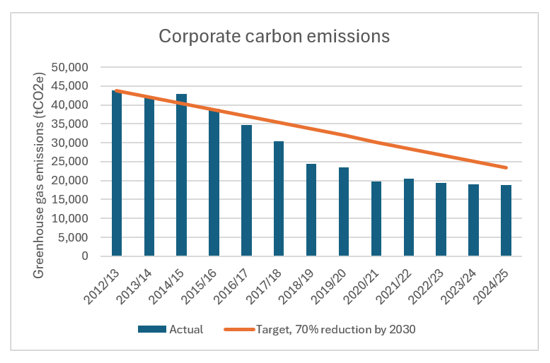
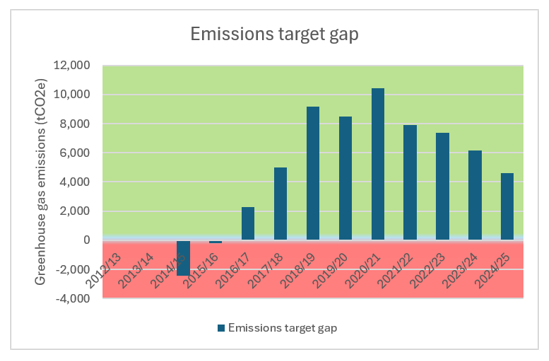
As seen above, carbon emissions have continued to decrease over the reporting period, and current emissions remain below the trajectory required to achieve the Council’s target of a 70% reduction by 2030 despite decreases in the emissions target gap.
Devon Pension Fund Carbon Intensity
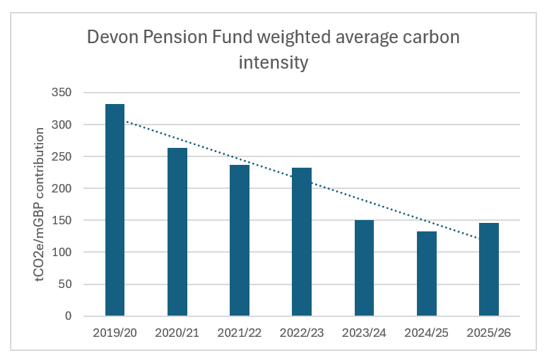
The weighted average carbon intensity of the Devon Pension Fund has reduced since 2019/20. More information can be found here: Climate change – Devon Pension Fund.
Waste and Recycling
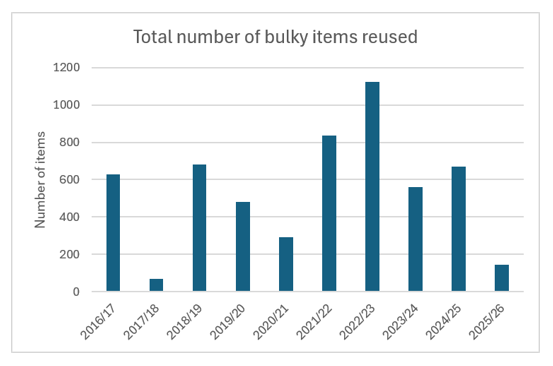
The number of bulky items reused by the council fluctuates annually but demonstrates the council’s continued commitment of extending product lifespans and reducing waste.
Recycle Devon Brand Recognition
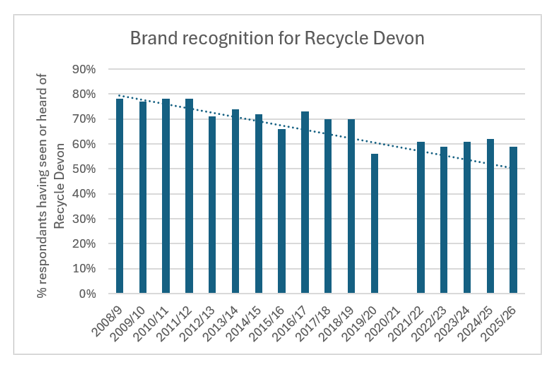
Public recognition of the Recycle Devon brand remains strong, although awareness levels have gradually declined from 78% to 59% over the reporting period. Data was not collected in 2020/21 due to the COVID pandemic.
Our Culture
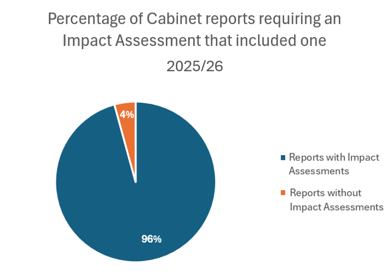
In 2025/26, 96% of Cabinet reports that required an Impact Assessment included one.
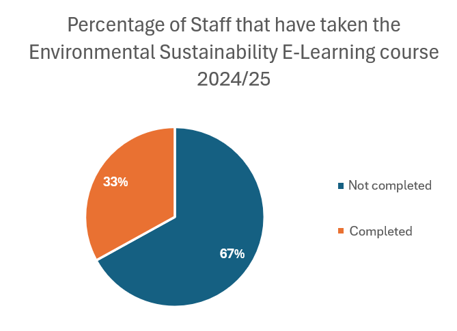
In 2024/25, 33% of staff completed the Environmental Sustainability E-Learning course. The course has since been reviewed and will be promoted to staff.