What was The Problem?
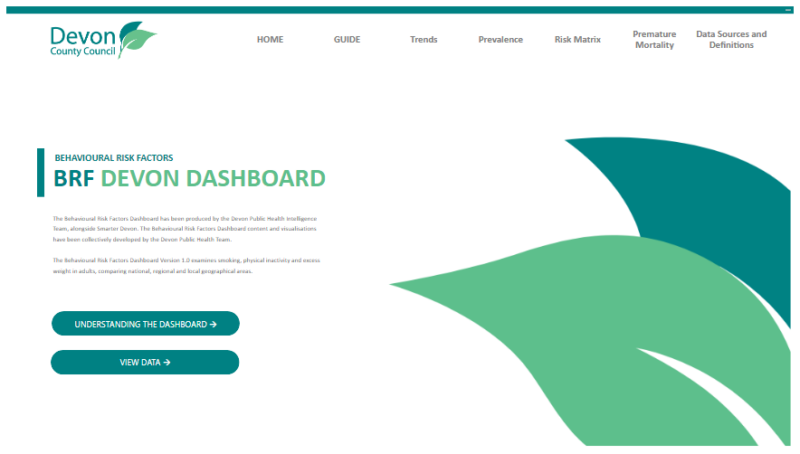
The Public Health Intelligence Team had to create an interactive Lifestyle Behaviours dashboard by combining several datasets efficiently. The primary goal of the first iteration of the dashboard was to visualise the data in a way that would help understand three behavioural risk factors (smoking, obesity, and physical activity) across Devon.
What Did We Do?
The team had specific objectives in mind when designing the report using Power Bi to help understand behavioural risk factors such as obesity physical inactivity and smoking in comparison to the SW an England using data from OHID fingertips. These objectives included comparing behavioural risk factors to other areas, understanding trends overtime in different districts, and determining the distribution of risk factors in small areas of Devon. Additionally, the team aimed to improve their data management skills by utilising APIs and data flows for importing and interrogating the data.
The Behaviours Lifestyles report was created to aid decision-making, implementing interventions, and advocating for improved population health. The team designed a prototype for the first iteration and following an agile methodology the project would be iterated again once a minimum viable product was signed off. Further iterations are planned and will include introducing commissioning data to the project to inform the targeting of interventions.
Results
Having already conducted User Experience in a project closely linked to this dashboard we already had a good understanding of how the first iteration of the dashboard should look and as such the design was mirrored across to this project. Version 1.0 was showcased via a webinar to a range of stakeholders, internally and external partners in March 2023 and following positive feedback is now published on Devon’s Health and Wellbeing website.

What Did the Client Say?
This project was a fantastic opportunity to meet multiple needs and requirements across the Public Health team but also through other work such as the Joint Strategic Needs Assessment which looks at current and future health and wellbeing needs, and the commissioning of lifestyle behaviour related services. By creating a product which meets many needs and automating dataflows, it will save the Public Health Intelligence team a great deal of time in producing analysis which is requested frequently throughout the year. In addition, the visuals used in this tool have been guided by extended user experience testing which has contributed to the success of the project by understanding specifically what our users wanted but also what was the best way of presenting data in a meaningful way.
Maria Moloney-Lucey – Public Health Specialist
Top Tip
“Dataflows are an online data collection and storage tool where users can prepare and filter data before loading to a Power BI Dashboard – I found they are an efficient way to populate a Power Bi Dashboard and worth finding out more about if you are building reports in Power BI”.
Donna Luckett – Public Health Senior Information Analyst (Report designer)