Contents
back to main index
Introduction
This report will look at various topics from 2021 Census and will compare the results with the England and South West figures. Most of the detailed data is either at District level (the eight districts that make up the Devon County area are East Devon, Exeter, Mid Devon, North Devon, South Hams, Teignbridge, Torridge and West Devon ) and/or Devon Town level (30 in Devon). Devon CC is the area covered by Devon County Council and One Devon is the area covered by Devon County Council plus Plymouth and Torbay Unitaries.
| Devon Towns |
|---|
| Ashburton-Buckfastleigh |
| Axminster |
| Barnstaple |
| Bideford-Northam |
| Braunton |
| Cranbrook |
| Crediton |
| Cullompton |
| Dartmouth |
| Dawlish |
| Exeter (Wider) |
| Exmouth |
| Great Torrington |
| Holsworthy |
| Honiton |
| Ilfracombe |
| Ivybridge |
| Kingsbridge |
| Lynton-Lynmouth |
| Moretonhampstead |
| Newton Abbot |
| Okehampton |
| Ottery St Mary |
| Seaton |
| Sidmouth |
| South Molton |
| Tavistock |
| Teignmouth |
| Tiverton |
| Totnes |
The data is either at Household Level (352,577 in the Devon CC Area) or Usual Resident Level (811,647 in the Devon CC Area) – (Usual Resident approximates to Every Person).
Most of the maps are produced at Output Level which is the lowest geography level available (approximately 200 households). A couple of maps are at Middle Super Output Level (MSOA) – there are 54 in Devon CC Area and Lower Super Output Area level (approximately 483 LSOAs in the Devon CC area).
Some of the headings have an Office of National Statistics (ONS) table code – this refers to the original source of the census data.
1. Population
This chapter looks at the national situation over time and then more locally to Devon.
First results for Devon
This section uses the preliminary data released from the 2011 Census by the Office for National Statistics. This data uses rounded figures and they show an increasing and ageing population both nationally and in Devon. Other comparison figures are missing from some of this section.
1.1 The national picture
The figures show that the population of England is 56,597,300. This is an increase of 3,490,100 – or 6.6% – over the past ten years. The largest increases have been in the South East (an increase of just over 9,300,000 – 7.5%) and London (a 8,800,000 – 7.7% increase). In percentage terms the largest increase was East of England (up 6,300,000 8.3%) followed by the South West with an increase of 5,700,000 7.8%.
Figure 1.1 – England Total Population 1801-2021

Figure 1.2 – England Intercensal Population Change 1801-2021

Figure 1.3 – England Age Structure
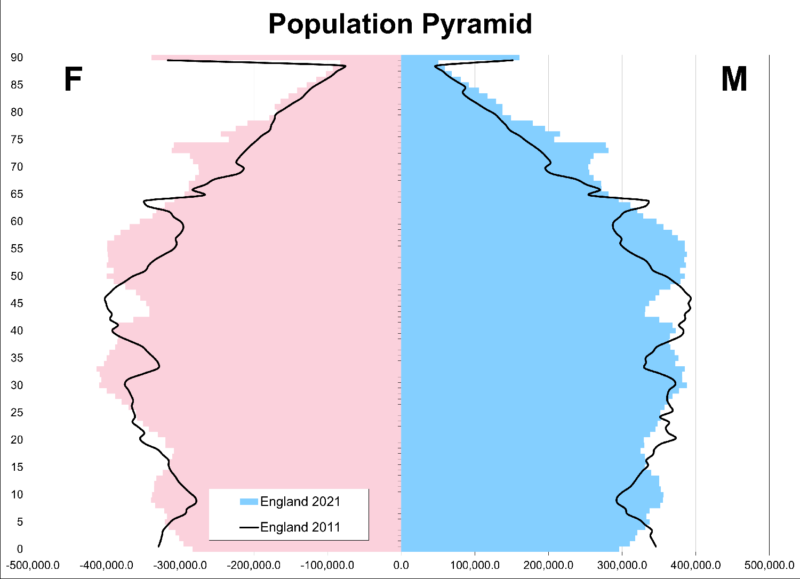
The population structure is also ageing. There are now 11.1 million people aged 65 and over, which is 18.6% of the population. In 2011 the figure stood at 9.2 million, or 16.4%.
1.2 The local picture
The Census puts the population of Devon at 811,600. This is up from 746,400 ten years ago – an increase of 65,200 or 8.7%. The largest increase was East Devon which saw an increase of 18,400 people – up 13.9% from 2011 to 150,800. West Devon saw the smallest increase with 3,600 extra people taking the total to 57,100 – an increase of 6.7%.
Table 1.1 Population change 2011-2021
| 2011 | 2021 | Change | % | |
|---|---|---|---|---|
| East Devon | 132,400 | 150,800 | 18,400 | 13.9% |
| Exeter | 117,800 | 130,800 | 13,000 | 11.0% |
| Mid Devon | 77,800 | 82,800 | 5,000 | 6.4% |
| North Devon | 93,600 | 98,600 | 5,100 | 5.3% |
| South Hams | 83,100 | 88,600 | 5,500 | 6.6% |
| Teignbridge | 124,300 | 134,800 | 10,500 | 8.4% |
| Torridge | 63,900 | 68,100 | 4,900 | 6.6% |
| West Devon | 53,500 | 57,100 | 3,600 | 6.7% |
| Devon CC | 746,400 | 811,600 | 65,200 | 8.7% |
| Plymouth | 256,400 | 264,700 | 8,300 | 3.2% |
| Torbay | 131,000 | 139,300 | 8,300 | 6.4% |
| One Devon | 1,133,800 | 1,215,600 | 81,800 | 7.2% |
| South West | 5,288,900 | 5,701,200 | 412,300 | 7.8% |
| England | 53,012,500 | 56,489,800 | 3,477,300 | 6.6% |
The past fifty years have seen a steady growth in population across all Devon’s districts. The change is generally steady except East Devon & Exeter which have accelerated recently?
Figure 1.4 – District Population Change 1981-2021

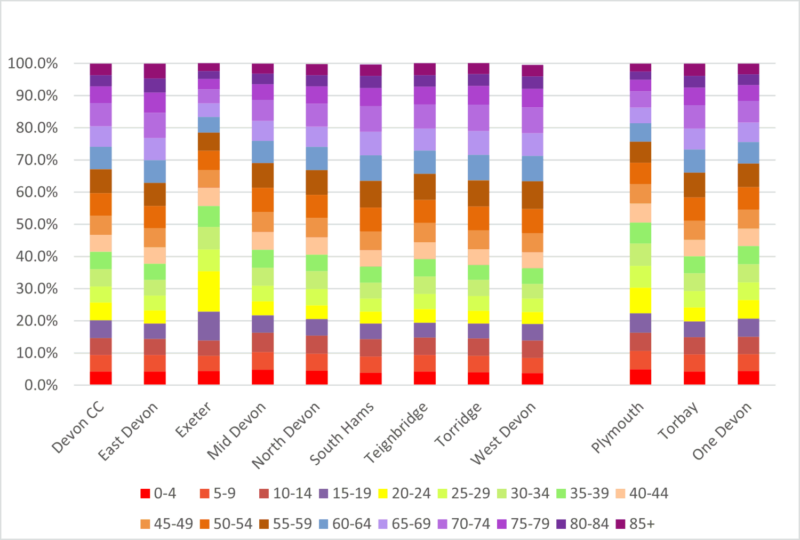
The age structure differs significantly between districts with 49% in Exeter aged under 35 compared to just 32% in West Devon. However, just 17% of people in Exeter are aged 65 and over compared to 30% in East Devon.
Figure 1.5 Age structure of Devon County Council area
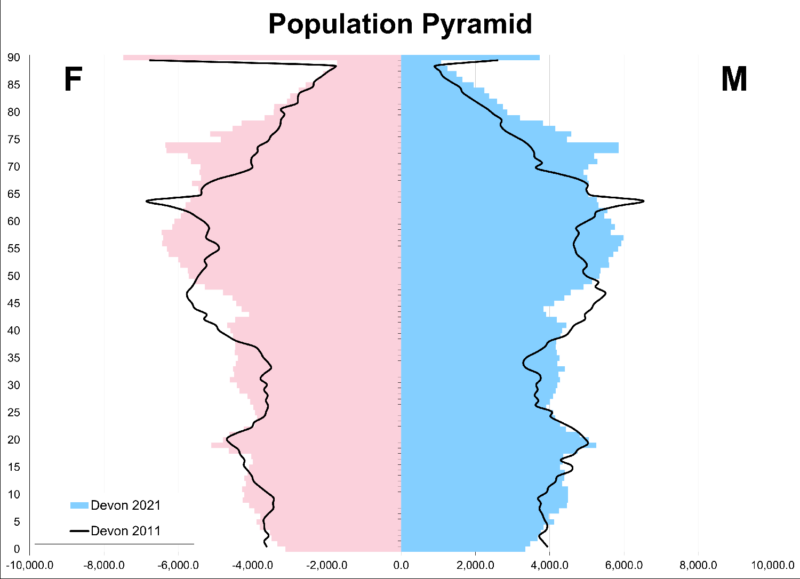
The Population Pyramid shows that since the 2011 Census the age groups bulge appears to moved from 65ish to 75ish for both sexes. Comparing this to the England Population Pyramid earlier it shows that Devon is much older.
Figure 1.6 Age structure of Devon areas
There has also been a corresponding increase in the number of households in the county. The largest increases were East Devon and Teignbridge, which saw an increases of 7,700 (13.0%) and 5,800 (10.7%) respectively.
Table 1.2 Household change 2011 to 2021
| Area | 2011 | 2021 | Change | % |
|---|---|---|---|---|
| East Devon | 59,100 | 66,800 | 7,700 | 13.0% |
| Exeter | 49,200 | 52,500 | 3,300 | 6.7% |
| Mid Devon | 32,800 | 35,600 | 2,800 | 8.5% |
| North Devon | 40,000 | 43,200 | 3,200 | 8.0% |
| South Hams | 36,900 | 39,300 | 2,400 | 6.5% |
| Teignbridge | 54,000 | 59,800 | 5,800 | 10.7% |
| Torridge | 28,000 | 30,500 | 2,500 | 8.9% |
| West Devon | 22,700 | 24,800 | 2,100 | 9.3% |
| Devon CC | 322,700 | 352,600 | 29,900 | 9.3% |
| Plymouth | 109,300 | 114,600 | 5,300 | 4.8% |
| Torbay | 59,000 | 63,000 | 4,000 | 6.8% |
| One Devon | 491,000 | 530,200 | 39,200 | 8.0% |
| South West | 2,264,600 | 2,448,800 | 184,200 | 8.1% |
| England | 22,063,400 | 23,435,700 | 1,372,300 | 6.2% |
In Devon there are, on average, 2.3 people per household. This compares to 2.41 people in England as a whole. If the average household size in Devon matched the national figure there would be 12,200 fewer households. This relatively small household size may be due to the age structure of the population with more older people living alone, although the full picture won’t be known until more data are released later in the year.
Except in Exeter, East Devon & South Hams, the household size has decreased across all Devon districts between 2011 and 2021.
Table 1.3 Change in average household size 2011 to 2021
| Area | 2011 | 2021 |
|---|---|---|
| East Devon | 2.24 | 2.26 |
| Exeter | 2.39 | 2.49 |
| Mid Devon | 2.37 | 2.33 |
| North Devon | 2.34 | 2.28 |
| South Hams | 2.25 | 2.25 |
| Teignbrige | 2.30 | 2.25 |
| Torridge | 2.28 | 2.24 |
| West Devon | 2.36 | 2.30 |
| Devon CC | 2.31 | 2.30 |
| Plymouth | 2.35 | 2.31 |
| Torbay | 2.22 | 2.21 |
| One Devon | 2.31 | 2.29 |
| South West | 2.34 | 2.33 |
| England | 2.40 | 2.41 |
The most densely populated district is Exeter with 2,783 people per square kilometre. By comparison, the least densely populated district is West Devon with 49 people per square kilometre.
Table 1.4 Population and household density (per ha.)
| Area | Size (km2) | Population Density | Household Density |
|---|---|---|---|
| East Devon | 814 | 185 | 82 |
| Exeter | 47 | 2,783 | 1,117 |
| Mid Devon | 913 | 91 | 39 |
| North Devon | 1,086 | 91 | 40 |
| South Hams | 886 | 100 | 44 |
| Teignbridge | 674 | 200 | 89 |
| Torridge | 984 | 69 | 31 |
| West Devon | 1,160 | 49 | 21 |
| Devon CC | 6,564 | 124 | 54 |
| Plymouth | 798 | 332 | 144 |
| Torbay | 629 | 221 | 100 |
| One Devon | 7,991 | 152 | 66 |
| South West | 23,837 | 239 | 103 |
| England | 130,278 | 434 | 180 |
Map 1.1 0-15 year olds by Lower Super Output Area
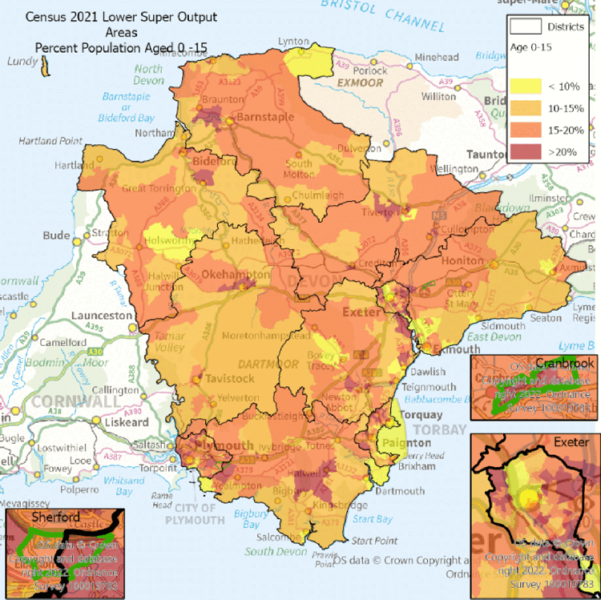
The highest numbers of under 16s are spread around the county with notable numbers in Exeter, Plymouth, Torquay, Cranbrook and Sherford as well as Braunton, Bideford, Tiverton, Okehampton, a rural area in South Hams and the larger centres in Teignbridge.
Map 1.2 16-64 year olds by Lower Super Output Area –

The larger percentages of working age people are in Exeter, Plymouth, an area of Dartmoor (where Princetown is probably the main centre),Ashburton/Buckfastleigh and Lympstone in East Devon.
Map 1.3 65 and Over year olds by Lower Super Output Area

Areas with large percentages of over 65s are mainly in South
Hams (Dartmouth/Kingswear), Torbay (Brixham)and East Devon (Budleigh, Sidmouth and Seaton).
Map 1.4 Population Density by Output Area
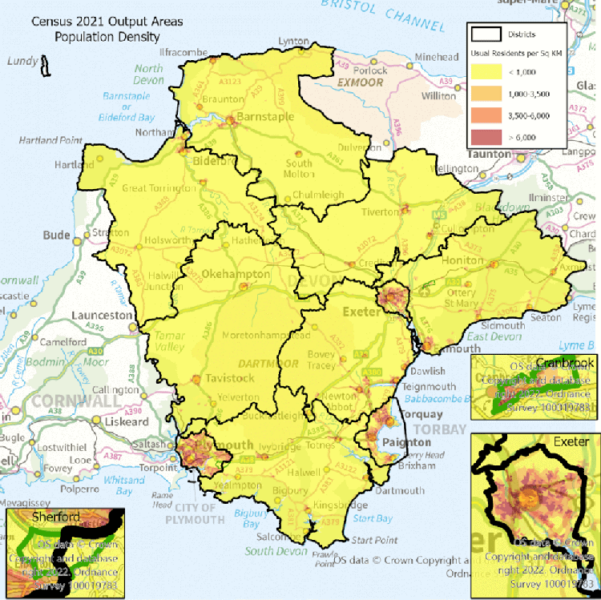
– not surprisingly the larger population centres have the highest population densities
2. Household Characteristics and Migration
2.1 Household size
(ONS Table TS017)
Table 2.1 a) Household size by District
| Area | 1 Person in Household | 2 People in Household | 3 People in Household | 4 People in Household | 5 People in Household | 6 People in Household | 7 People in Household | 8 People in Household | Total Households |
|---|---|---|---|---|---|---|---|---|---|
| East Devon | 20,056 | 27,221 | 8,914 | 7,329 | 2,324 | 646 | 182 | 116 | 66,788 |
| Exeter | 17,021 | 17,881 | 7,823 | 6,378 | 2,215 | 814 | 263 | 158 | 52,553 |
| Mid Devon | 10,238 | 13,825 | 5,031 | 4,448 | 1,468 | 427 | 119 | 75 | 35,631 |
| North Devon | 13,257 | 16,576 | 6,096 | 4,968 | 1,605 | 477 | 136 | 82 | 43,197 |
| South Hams | 11,621 | 15,975 | 5,492 | 4,368 | 1,369 | 361 | 90 | 61 | 39,337 |
| Teignbridge | 18,406 | 23,537 | 8,351 | 6,722 | 2,012 | 573 | 157 | 79 | 59,837 |
| Torridge | 9,330 | 12,392 | 4,058 | 3,100 | 1,066 | 364 | 97 | 53 | 30,460 |
| West Devon | 7,300 | 10,182 | 3,325 | 2,711 | 919 | 251 | 72 | 59 | 24,819 |
| Devon CC | 107,229 | 137,589 | 49,090 | 40,024 | 12,978 | 3,913 | 1,116 | 683 | 352,622 |
| Plymouth | 37,338 | 40,178 | 17,651 | 13,129 | 4,290 | 1,347 | 379 | 245 | 114,557 |
| Torbay | 21,883 | 22,917 | 8,508 | 6,310 | 2,235 | 714 | 245 | 182 | 62,994 |
| One Devon | 166,450 | 200,684 | 75,249 | 59,463 | 19,503 | 5,974 | 1,740 | 1,110 | 530,173 |
| South West | 741,323 | 910,536 | 364,516 | 298,067 | 93,966 | 27,509 | 8,116 | 4,848 | 2,448,881 |
| England | 7,052,229 | 7,978,497 | 3,742,887 | 3,024,796 | 1,060,448 | 358,795 | 126,018 | 92,418 | 23,436,088 |
| Area | 1 Person in Household | 2 People in Household | 3 People in Household | 4 People in Household | 5 People in Household | 6 People in Household | 7 People in Household | 8 People in Household |
|---|---|---|---|---|---|---|---|---|
| East Devon | 30.0% | 40.8% | 13.3% | 11.0% | 3.5% | 1.0% | 0.3% | 0.2% |
| Exeter | 32.4% | 34.0% | 14.9% | 12.1% | 4.2% | 1.5% | 0.5% | 0.3% |
| Mid Devon | 28.7% | 38.8% | 14.1% | 12.5% | 4.1% | 1.2% | 0.3% | 0.2% |
| North Devon | 30.7% | 38.4% | 14.1% | 11.5% | 3.7% | 1.1% | 0.3% | 0.2% |
| South Hams | 29.5% | 40.6% | 14.0% | 11.1% | 3.5% | 0.9% | 0.2% | 0.2% |
| Teignbridge | 30.8% | 39.3% | 14.0% | 11.2% | 3.4% | 1.0% | 0.3% | 0.1% |
| Torridge | 30.6% | 40.7% | 13.3% | 10.2% | 3.5% | 1.2% | 0.3% | 0.2% |
| West Devon | 29.4% | 41.0% | 13.4% | 10.9% | 3.7% | 1.0% | 0.3% | 0.2% |
| Devon CC | 30.4% | 39.0% | 13.9% | 11.4% | 3.7% | 1.1% | 0.3% | 0.2% |
| Plymouth | 32.6% | 35.1% | 15.4% | 11.5% | 3.7% | 1.2% | 0.3% | 0.2% |
| Torbay | 34.7% | 36.4% | 13.5% | 10.0% | 3.5% | 1.1% | 0.4% | 0.3% |
| One Devon | 31.4% | 37.9% | 14.2% | 11.2% | 3.7% | 1.1% | 0.3% | 0.2% |
| South West | 30.3% | 37.2% | 14.9% | 12.2% | 3.8% | 1.1% | 0.3% | 0.2% |
| England | 30.1% | 34.0% | 16.0% | 12.9% | 4.5% | 1.5% | 0.5% | 0.4% |
Figure 2.1 a) Household Size by District
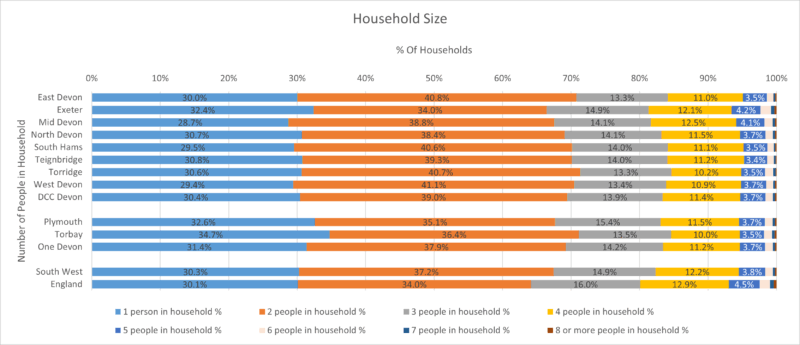
Devon has more 1 and 2 person households than the English average but less in the larger households – the districts are roughly the same, with the exception of Exeter which is closer to the English profile.
Table 2.1 b) Household Size by Devon Town
| Area | 1 person in household | 2 people in household | 3 people in household | 4 people in household | 5 people in household | 6 people in household | 7 people in household | 8 or more people in household | Total Households |
|---|---|---|---|---|---|---|---|---|---|
| Ashburton-Buckfastleigh | 1,208 | 1,223 | 532 | 391 | 128 | 36 | 10 | 2 | 3,530 |
| Axminster | 2,070 | 3,060 | 975 | 711 | 289 | 75 | 22 | 11 | 7,213 |
| Barnstaple | 6,500 | 7,995 | 3,095 | 2,487 | 807 | 229 | 62 | 46 | 21,221 |
| Bideford-Northam | 5,839 | 7,100 | 2,390 | 1,721 | 586 | 176 | 43 | 20 | 17,875 |
| Braunton | 1,456 | 1,953 | 737 | 771 | 181 | 50 | 9 | 2 | 5,159 |
| Cranbrook | 541 | 996 | 599 | 554 | 157 | 55 | 11 | 4 | 2,917 |
| Crediton | 2,758 | 3,731 | 1,332 | 1,182 | 381 | 107 | 28 | 26 | 9,545 |
| Cullompton | 2,921 | 4,027 | 1,632 | 1,472 | 462 | 132 | 34 | 19 | 10,699 |
| Dartmouth | 1,632 | 2,181 | 560 | 403 | 131 | 42 | 12 | 5 | 4,966 |
| Dawlish | 2,625 | 3,086 | 945 | 748 | 221 | 62 | 26 | 7 | 7,720 |
| Exeter (Wider) | 19,593 | 21,814 | 9,277 | 7,732 | 2,598 | 936 | 275 | 187 | 62,412 |
| Exmouth | 6,929 | 8,758 | 2,814 | 2,365 | 740 | 163 | 55 | 33 | 21,857 |
| Great Torrington | 1,376 | 1,972 | 646 | 521 | 171 | 59 | 26 | 5 | 4,776 |
| Holsworthy | 2,012 | 3,198 | 1,000 | 811 | 283 | 118 | 35 | 22 | 7,479 |
| Honiton | 2,674 | 3,475 | 1,096 | 898 | 256 | 108 | 34 | 25 | 8,566 |
| Ilfracombe | 2,649 | 2,796 | 1,036 | 778 | 272 | 96 | 26 | 25 | 7,678 |
| Ivybridge | 4,088 | 6,457 | 2,445 | 1,996 | 598 | 142 | 37 | 25 | 15,788 |
| Kingsbridge | 2,587 | 3,348 | 996 | 842 | 275 | 79 | 17 | 13 | 8,157 |
| Lynton-Lynmouth | 264 | 339 | 68 | 62 | 13 | 2 | 2 | 0 | 750 |
| Moretonhampstead | 570 | 836 | 243 | 203 | 59 | 25 | 5 | 2 | 1,943 |
| Newton Abbot | 9,488 | 12,874 | 4,924 | 3,888 | 1,163 | 335 | 90 | 49 | 32,811 |
| Okehampton | 3,520 | 4,984 | 1,622 | 1,414 | 502 | 146 | 41 | 41 | 12,270 |
| Ottery St Mary | 1,740 | 2,649 | 960 | 934 | 278 | 59 | 24 | 6 | 6,650 |
| Seaton | 2,190 | 2,684 | 673 | 464 | 141 | 40 | 6 | 4 | 6,202 |
| Sidmouth | 2,686 | 3,438 | 915 | 608 | 225 | 68 | 14 | 14 | 7,968 |
| South Molton | 1,924 | 2,727 | 932 | 684 | 272 | 73 | 23 | 10 | 6,645 |
| Tavistock | 4,070 | 5,640 | 1,804 | 1,405 | 451 | 118 | 28 | 14 | 13,530 |
| Teignmouth | 3,072 | 3,514 | 1,033 | 849 | 259 | 68 | 19 | 7 | 8,821 |
| Tiverton | 4,928 | 6,750 | 2,311 | 2,002 | 697 | 215 | 75 | 33 | 17,011 |
| Totnes | 3,312 | 3,988 | 1,486 | 1,126 | 362 | 99 | 25 | 20 | 10,418 |
| DCC Devon | 107,229 | 137,589 | 49,050 | 40,024 | 12,978 | 3,913 | 1,116 | 683 | 352,622 |
| Plymouth | 37,338 | 40,178 | 17,651 | 13,129 | 4,290 | 1,347 | 379 | 245 | 114,557 |
| Torbay | 21,883 | 22,917 | 8,508 | 6,310 | 2,235 | 714 | 245 | 182 | 62,994 |
| One Devon | 166,450 | 200,684 | 75,249 | 59,463 | 19,503 | 5,974 | 1,740 | 1,110 | 530,173 |
| South West | 741,323 | 910,536 | 364,516 | 298,067 | 93,966 | 27,509 | 8,116 | 4,848 | 2,448,881 |
| England | 7,052,229 | 7,978,497 | 3,742,887 | 3,024,796 | 1,060,448 | 358,795 | 126,018 | 92,418 | 23,436,088 |
| Area | 1 person in household % | 2 people in household % | 3 people in household % | 4 people in household % | 5 people in household % | 6 people in household % | 7 people in household % | 8 or more people in household % |
|---|---|---|---|---|---|---|---|---|
| Ashburton-Buckfastleigh | 34.2% | 34.6% | 15.1% | 11.1% | 3.6% | 1.0% | 0.3% | 0.1% |
| Axminster | 28.7% | 42.4% | 13.5% | 9.9% | 4.0% | 1.0% | 0.3% | 0.2% |
| Barnstaple | 30.6% | 37.7% | 14.6% | 11.7% | 3.8% | 1.1% | 0.3% | 0.2% |
| Bideford-Northam | 32.7% | 39.7% | 13.4% | 9.6% | 3.3% | 1.0% | 0.2% | 0.1% |
| Braunton | 28.2% | 37.9% | 14.3% | 14.9% | 3.5% | 1.0% | 0.2% | 0.0% |
| Cranbrook | 18.5% | 34.1% | 20.5% | 19.0% | 5.4% | 1.9% | 0.4% | 0.1% |
| Crediton | 28.9% | 39.1% | 14.0% | 12.4% | 4.0% | 1.1% | 0.3% | 0.3% |
| Cullompton | 27.3% | 37.6% | 15.3% | 13.8% | 4.3% | 1.2% | 0.3% | 0.2% |
| Dartmouth | 32.9% | 43.9% | 11.3% | 8.1% | 2.6% | 0.8% | 0.2% | 0.1% |
| Dawlish | 34.0% | 40.0% | 12.2% | 9.7% | 2.9% | 0.8% | 0.3% | 0.1% |
| Exeter (Wider) | 31.4% | 35.0% | 14.9% | 12.4% | 4.2% | 1.5% | 0.4% | 0.3% |
| Exmouth | 31.7% | 40.1% | 12.9% | 10.8% | 3.4% | 0.7% | 0.3% | 0.2% |
| Great Torrington | 28.8% | 41.3% | 13.5% | 10.9% | 3.6% | 1.2% | 0.5% | 0.1% |
| Holsworthy | 26.9% | 42.8% | 13.4% | 10.8% | 3.8% | 1.6% | 0.5% | 0.3% |
| Honiton | 31.2% | 40.6% | 12.8% | 10.5% | 3.0% | 1.3% | 0.4% | 0.3% |
| Ilfracombe | 34.5% | 36.4% | 13.5% | 10.1% | 3.5% | 1.3% | 0.3% | 0.3% |
| Ivybridge | 25.9% | 40.9% | 15.5% | 12.6% | 3.8% | 0.9% | 0.2% | 0.2% |
| Kingsbridge | 31.7% | 41.0% | 12.2% | 10.3% | 3.4% | 1.0% | 0.2% | 0.2% |
| Lynton-Lynmouth | 35.2% | 45.2% | 9.1% | 8.3% | 1.7% | 0.3% | 0.3% | 0.0% |
| Moretonhampstead | 29.3% | 43.0% | 12.5% | 10.4% | 3.0% | 1.3% | 0.3% | 0.1% |
| Newton Abbot | 28.9% | 39.2% | 15.0% | 11.8% | 3.5% | 1.0% | 0.3% | 0.1% |
| Okehampton | 28.7% | 40.6% | 13.2% | 11.5% | 4.1% | 1.2% | 0.3% | 0.3% |
| Ottery St Mary | 26.2% | 39.8% | 14.4% | 14.0% | 4.2% | 0.9% | 0.4% | 0.1% |
| Seaton | 35.3% | 43.3% | 10.9% | 7.5% | 2.3% | 0.6% | 0.1% | 0.1% |
| Sidmouth | 33.7% | 43.1% | 11.5% | 7.6% | 2.8% | 0.9% | 0.2% | 0.2% |
| South Molton | 29.0% | 41.0% | 14.0% | 10.3% | 4.1% | 1.1% | 0.3% | 0.2% |
| Tavistock | 30.1% | 41.7% | 13.3% | 10.4% | 3.3% | 0.9% | 0.2% | 0.1% |
| Teignmouth | 34.8% | 39.8% | 11.7% | 9.6% | 2.9% | 0.8% | 0.2% | 0.1% |
| Tiverton | 29.0% | 39.7% | 13.6% | 11.8% | 4.1% | 1.3% | 0.4% | 0.2% |
| Totnes | 31.8% | 38.3% | 14.3% | 10.8% | 3.5% | 1.0% | 0.2% | 0.2% |
| DCC Devon | 30.4% | 39.0% | 13.9% | 11.4% | 3.7% | 1.1% | 0.3% | 0.2% |
| Plymouth | 32.6% | 35.1% | 15.4% | 11.5% | 3.7% | 1.2% | 0.3% | 0.2% |
| Torbay | 34.7% | 36.4% | 13.5% | 10.0% | 3.5% | 1.1% | 0.4% | 0.3% |
| One Devon | 31.4% | 37.9% | 14.2% | 11.2% | 3.7% | 1.1% | 0.3% | 0.2% |
| South West | 30.3% | 37.2% | 14.9% | 12.2% | 3.8% | 1.1% | 0.3% | 0.2% |
| England | 30.1% | 34.0% | 16.0% | 12.9% | 4.5% | 1.5% | 0.5% | 0.4% |
Figure 2.1 b) Household Size by Devon Town

Cranbrook stands out as different with more 3, 4 and 5 person households than everywhere else. Most of the coastal areas have larger numbers of 1 and 2 person households (Dartmouth, Dawlish, Lynton-Lynmouth, Seaton and Sidmouth).
Map 2.1 a) One Person Households by Output Area

Some in central Exeter & Plymouth and spread in urban centres across the county.
Map 2.1 b) Eight Person Households by Output Area
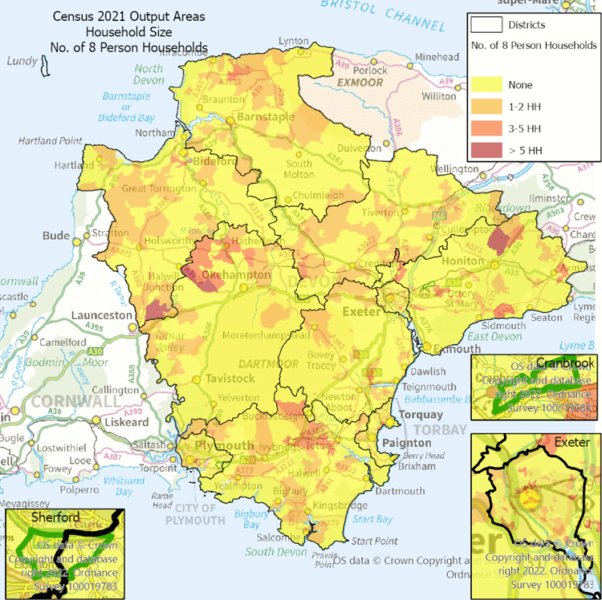
Only a few Isolated areas have 5+ numbers of 8 person households – mostly in rural areas.
2.2 Household composition
(ONS Table TS003)
Table 2.2 a) Household Composition by District
| Area | One-person household: Aged 66 years and over | One-person household: Other | Single family household: All aged 66 years and over | Single family household: Cohabiting couple family: All children non-dependent | Single family household: Cohabiting couple family: No children | Single family household: Cohabiting couple family: With dependent children | Single family household: Other single family household: Other family composition | Single family household: Lone parent family: With dependent children | Single family household: Married or civil partnership couple: All children non-dependent | Single family household: Married or civil partnership couple: No children | Single family household: Married or civil partnership couple: Dependent children | Single family household: Other single family household: Other family composition | Other household types: With dependent children | Other household types: Other, including all full-time students and all aged 66 years and over | Total Households |
|---|---|---|---|---|---|---|---|---|---|---|---|---|---|---|---|
| East Devon | 11,845 | 8,213 | 11,008 | 394 | 3,936 | 2,710 | 2,113 | 3,023 | 3,409 | 8,466 | 8,332 | 211 | 1,077 | 2,051 | 66,788 |
| Exeter | 7,116 | 9,905 | 4,372 | 324 | 4,070 | 2,169 | 1,804 | 2,853 | 2,248 | 5,143 | 6,787 | 367 | 856 | 4,542 | 52,556 |
| Mid Devon | 5,215 | 5,017 | 4,560 | 223 | 2,248 | 1,663 | 1,203 | 1,919 | 1,952 | 4,713 | 5,017 | 121 | 707 | 1,069 | 35,627 |
| North Devon | 6,830 | 6,433 | 5,764 | 274 | 2,587 | 2,016 | 1,506 | 2,355 | 2,294 | 5,472 | 5,297 | 189 | 827 | 1,353 | 43,197 |
| South Hams | 6,562 | 5,060 | 5,848 | 229 | 2,217 | 1,555 | 1,266 | 1,839 | 2,158 | 5,501 | 5,058 | 125 | 668 | 1,241 | 39,327 |
| Teignbridge | 9,885 | 8,516 | 8,246 | 429 | 3,689 | 2,590 | 2,039 | 3,191 | 3,128 | 7,722 | 7,241 | 172 | 1,038 | 1,899 | 59,785 |
| Torridge | 4,972 | 4,357 | 4,440 | 183 | 1,811 | 1,352 | 954 | 1,520 | 1,618 | 4,299 | 3,288 | 107 | 586 | 968 | 30,455 |
| West Devon | 4,068 | 3,230 | 3,719 | 119 | 1,435 | 940 | 773 | 1,130 | 1,389 | 3,644 | 3,064 | 80 | 473 | 755 | 24,819 |
| DCC Devon | 56,493 | 50,731 | 47,957 | 2,175 | 21,993 | 14,995 | 11,658 | 17,830 | 18,196 | 44,960 | 44,084 | 1,372 | 6,232 | 13,878 | 352,554 |
| Plymouth | 15,090 | 22,252 | 10,005 | 858 | 8,226 | 6,042 | 4,551 | 8,143 | 5,454 | 12,133 | 13,835 | 652 | 2,067 | 5,260 | 114,568 |
| Torbay | 11,074 | 10,791 | 7,634 | 439 | 3,533 | 2,756 | 2,439 | 3,980 | 3,050 | 6,959 | 6,275 | 322 | 1,425 | 2,311 | 62,988 |
| One Devon | 82,657 | 83,774 | 65,596 | 3,472 | 33,762 | 23,793 | 18,648 | 29,953 | 26,700 | 64,052 | 64,194 | 2,346 | 9,724 | 21,449 | 530,110 |
| South West | 356,329 | 384,994 | 284,123 | 16,029 | 163,957 | 108,519 | 85,379 | 138,453 | 129,194 | 328,880 | 288,960 | 12,817 | 46,913 | 104,334 | 2,448,881 |
| England | 3,001,792 | 4,050,440 | 2,145,279 | 169,017 | 1,486,961 | 1,053,000 | 977,827 | 1,617,077 | 1,314,184 | 3,375,402 | 2,440,210 | 183,970 | 630,336 | 990,594 | 23,436,089 |
| Area | One-person household: Aged 66 years and over | One-person household: Other | Single family household: All aged 66 years and over | Single family household: Cohabiting couple family: All children non-dependent | Single family household: Cohabiting couple family: No children | Single family household: Cohabiting couple family: With dependent children | Single family household: Lone parent family: All children non-dependent | Single family household: Lone parent family: With dependent children | Single family household: Married or civil partnership couple: All children non-dependent | Single family household: Married or civil partnership couple: No children | Single family household: Married or civil partnership couple: Dependent children | Single family household: Other single family household: Other family composition | Other household types: With dependent children | Other household types: Other, including all full-time students and all aged 66 years and over |
|---|---|---|---|---|---|---|---|---|---|---|---|---|---|---|
| East Devon | 17.7% | 12.3% | 16.5% | 0.6% | 5.9% | 4.1% | 3.2% | 4.5% | 5.1% | 12.7% | 12.5% | 0.3% | 1.6% | 3.1% |
| Exeter | 13.5% | 18.8% | 8.3% | 0.6% | 7.7% | 4.1% | 3.4% | 5.4% | 4.3% | 9.8% | 12.9% | 0.7% | 1.6% | 8.6% |
| Mid Devon | 14.6% | 14.1% | 12.8% | 0.6% | 6.3% | 4.7% | 3.4% | 5.4% | 5.5% | 13.2% | 14.1% | 0.3% | 2.0% | 3.0% |
| North Devon | 15.8% | 14.9% | 13.3% | 0.6% | 6.0% | 4.7% | 3.5% | 5.5% | 5.3% | 12.7% | 12.3% | 0.4% | 1.9% | 3.1% |
| South Hams | 16.7% | 12.9% | 14.9% | 0.6% | 5.6% | 4.0% | 3.2% | 4.7% | 5.5% | 14.0% | 12.9% | 0.3% | 1.7% | 3.2% |
| Teignbridge | 16.5% | 14.2% | 13.8% | 0.7% | 6.2% | 4.3% | 3.4% | 5.3% | 5.2% | 12.9% | 12.1% | 0.3% | 1.7% | 3.2% |
| Torridge | 16.3% | 14.3% | 14.6% | 0.6% | 5.9% | 4.4% | 3.1% | 5.0% | 5.3% | 14.1% | 10.8% | 0.4% | 1.9% | 3.2% |
| West Devon | 16.4% | 13.0% | 15.0% | 0.5% | 5.8% | 3.8% | 3.1% | 4.6% | 5.6% | 14.7% | 12.3% | 0.3% | 1.9% | 3.0% |
| DCC Devon | 16.0% | 14.4% | 13.6% | 0.6% | 6.2% | 4.3% | 3.3% | 5.1% | 5.2% | 12.8% | 12.5% | 0.4% | 1.8% | 3.9% |
| Plymouth | 13.2% | 19.4% | 8.7% | 0.7% | 7.2% | 5.3% | 4.0% | 7.1% | 4.8% | 10.6% | 12.1% | 0.6% | 1.8% | 4.6% |
| Torbay | 17.6% | 17.1% | 12.1% | 0.7% | 5.6% | 4.4% | 3.9% | 6.3% | 4.8% | 11.0% | 10.0% | 0.5% | 2.3% | 3.7% |
| One Devon | 15.6% | 15.8% | 12.4% | 0.7% | 6.4% | 4.5% | 3.5% | 5.7% | 5.0% | 12.1% | 12.1% | 0.4% | 1.8% | 4.0% |
| South West | 14.6% | 15.7% | 11.6% | 0.7% | 6.7% | 4.4% | 3.5% | 5.7% | 5.3% | 13.4% | 11.8% | 0.5% | 1.9% | 4.3% |
| England | 12.8% | 17.3% | 9.2% | 0.7% | 6.3% | 4.5% | 4.2% | 6.9% | 5.6% | 14.4% | 10.4% | 0.8% | 2.7% | 4.2% |
Figure 2.2 a) Household Composition by District

With the exception of Exeter all the districts have over average percentages of the two 66+ measures – One person and single family households
Table 2.2 b) Household Composition by Devon Town
| Area | One-person household: Aged 66 years and over | One-person household: Other | Single family household: All aged 66 years and over | Single family household: Cohabiting couple family: All children non-dependent | Single family household: Cohabiting couple family: No children | Single family household: Cohabiting couple family: With dependent children | Single family household: Lone parent family: All children non-dependent | Single family household: Lone parent family: With dependent children | Single family household: Married or civil partnership couple: All children non-dependent | Single family household: Married or civil partnership couple: No children | Single family household: Married or civil partnership couple: Dependent children | Single family household: Other single family household: Other family composition | Other household types: With dependent children | Other household types: Other, including all full-time students and all aged 66 years and over | Total Households |
|---|---|---|---|---|---|---|---|---|---|---|---|---|---|---|---|
| Ashburton-Buckfastleigh | 644 | 564 | 385 | 33 | 196 | 123 | 171 | 240 | 160 | 380 | 412 | 14 | 68 | 128 | 3,518 |
| Axminster | 1,227 | 842 | 1,230 | 61 | 373 | 255 | 292 | 292 | 393 | 1,027 | 857 | 22 | 119 | 215 | 7,205 |
| Barnstaple | 3,244 | 3,253 | 2,633 | 141 | 1,332 | 797 | 1,063 | 1,286 | 1,135 | 2,561 | 2,621 | 104 | 396 | 649 | 21,215 |
| Bideford-Northam | 3,047 | 2,796 | 2,521 | 107 | 1,081 | 591 | 800 | 979 | 905 | 2,341 | 1,826 | 56 | 293 | 541 | 17,884 |
| Braunton | 827 | 632 | 782 | 22 | 259 | 165 | 227 | 236 | 273 | 633 | 875 | 17 | 78 | 140 | 5,166 |
| Cranbrook | 91 | 452 | 110 | 17 | 373 | 84 | 261 | 277 | 93 | 305 | 683 | 18 | 62 | 92 | 2,918 |
| Crediton | 1,439 | 1,319 | 1,283 | 59 | 590 | 312 | 412 | 490 | 513 | 1,275 | 1,332 | 29 | 194 | 289 | 9,536 |
| Cullompton | 1,444 | 1,471 | 1,258 | 74 | 698 | 319 | 529 | 574 | 655 | 1,436 | 1,695 | 29 | 224 | 293 | 10,699 |
| Dartmouth | 963 | 669 | 861 | 29 | 272 | 142 | 163 | 183 | 243 | 778 | 432 | 20 | 68 | 144 | 4,967 |
| Dawlish | 1,453 | 1,170 | 1,173 | 49 | 403 | 260 | 301 | 408 | 400 | 1,018 | 686 | 20 | 144 | 229 | 7,714 |
| Exeter (Wider) | 8,465 | 11,127 | 5,690 | 371 | 4,842 | 2,066 | 2,620 | 3,314 | 2,758 | 6,449 | 8,380 | 394 | 1,076 | 4,875 | 62,427 |
| Exmouth | 4,081 | 2,844 | 3,540 | 128 | 1,185 | 719 | 850 | 987 | 1,145 | 2,700 | 2,560 | 73 | 336 | 707 | 21,855 |
| Great Torrington | 783 | 590 | 702 | 34 | 295 | 152 | 211 | 231 | 264 | 695 | 541 | 19 | 104 | 156 | 4,777 |
| Holsworthy | 1,091 | 921 | 1,174 | 37 | 429 | 209 | 322 | 283 | 457 | 1,212 | 873 | 31 | 176 | 265 | 7,480 |
| Honiton | 1,481 | 1,197 | 1,351 | 46 | 551 | 273 | 349 | 353 | 431 | 1,085 | 967 | 30 | 148 | 298 | 8,560 |
| Ilfracombe | 1,257 | 1,398 | 971 | 61 | 428 | 275 | 342 | 445 | 355 | 891 | 779 | 41 | 168 | 262 | 7,673 |
| Ivybridge | 2,185 | 1,901 | 2,295 | 97 | 956 | 485 | 665 | 762 | 952 | 2,335 | 2,413 | 43 | 278 | 431 | 15,798 |
| Kingsbridge | 1,536 | 1,044 | 1,341 | 39 | 440 | 281 | 328 | 322 | 395 | 1,079 | 950 | 22 | 119 | 245 | 8,141 |
| Lynton-Lynmouth | 144 | 120 | 100 | 1 | 54 | 25 | 19 | 16 | 39 | 145 | 57 | 1 | 11 | 18 | 750 |
| Moretonhampstead | 336 | 231 | 300 | 13 | 118 | 65 | 69 | 68 | 93 | 310 | 236 | 6 | 39 | 58 | 1,942 |
| Newton Abbot | 4,937 | 4,552 | 4,298 | 262 | 2,146 | 1,125 | 1,534 | 1,846 | 1,813 | 4,229 | 4,325 | 110 | 568 | 1,053 | 32,798 |
| Okehampton | 1,885 | 1,634 | 1,724 | 74 | 758 | 381 | 501 | 582 | 644 | 1,770 | 1,555 | 40 | 288 | 428 | 12,264 |
| Ottery St Mary | 1,034 | 709 | 1,074 | 39 | 371 | 212 | 280 | 292 | 385 | 882 | 1,078 | 8 | 109 | 180 | 6,653 |
| Seaton | 1,441 | 749 | 1,298 | 35 | 302 | 204 | 186 | 228 | 287 | 763 | 493 | 15 | 63 | 145 | 6,209 |
| Sidmouth | 1,878 | 807 | 1,726 | 43 | 336 | 238 | 213 | 303 | 371 | 972 | 726 | 25 | 101 | 221 | 7,960 |
| South Molton | 1,068 | 857 | 986 | 41 | 401 | 197 | 306 | 324 | 366 | 957 | 767 | 22 | 137 | 216 | 6,645 |
| Tavistock | 2,348 | 1,722 | 2,165 | 51 | 726 | 419 | 474 | 593 | 785 | 2,041 | 1,613 | 43 | 209 | 359 | 13,548 |
| Teignmouth | 1,716 | 1,354 | 1,355 | 46 | 472 | 319 | 317 | 448 | 414 | 1,110 | 842 | 13 | 123 | 275 | 8,804 |
| Tiverton | 2,570 | 2,360 | 2,280 | 101 | 1,057 | 607 | 791 | 896 | 904 | 2,272 | 2,247 | 67 | 330 | 545 | 17,027 |
| Totnes | 1,878 | 1,446 | 1,351 | 64 | 549 | 358 | 399 | 572 | 568 | 1,309 | 1,263 | 40 | 203 | 421 | 10,421 |
| DCC Devon | 56,493 | 50,731 | 47,957 | 2,175 | 21,993 | 11,658 | 14,995 | 17,830 | 18,196 | 44,960 | 44,084 | 1,372 | 6,232 | 13,878 | 352,554 |
| Plymouth | 15,090 | 22,252 | 10,005 | 858 | 8,226 | 4,551 | 6,042 | 8,143 | 5,454 | 12,133 | 13,835 | 652 | 2,067 | 5,260 | 114,568 |
| Torbay | 11,074 | 10,791 | 7,634 | 439 | 3,533 | 2,439 | 2,756 | 3,980 | 3,050 | 6,959 | 6,275 | 322 | 1,425 | 2,311 | 62,988 |
| One Devon | 82,657 | 83,774 | 65,596 | 3,472 | 33,752 | 18,648 | 23,793 | 29,953 | 26,700 | 64,052 | 64,194 | 2,346 | 9,724 | 21,449 | 530,110 |
| South West | 356,329 | 384,994 | 284,123 | 16,029 | 163,957 | 108,519 | 85,379 | 138,453 | 129,194 | 328,880 | 288,960 | 12,817 | 46,913 | 104,334 | 2,448,881 |
| England | 3,001,792 | 4,050,440 | 2,145,279 | 169,017 | 1,486,961 | 1,053,000 | 977,827 | 1,617,077 | 1,314,184 | 3,375,402 | 2,440,210 | 183,970 | 630,336 | 990,594 | 23,436,089 |
| Area | One-person household: Aged 66 years and over | One-person household: Other | Single family household: All aged 66 years and over | Single family household: Cohabiting couple family: All children non-dependent | Single family household: Cohabiting couple family: No children | Single family household: Cohabiting couple family: With dependent children | Single family household: Lone parent family: All children non-dependent | Single family household: Lone parent family: With dependent children | Single family household: Married or civil partnership couple: All children non-dependent | Single family household: Married or civil partnership couple: No children | Single family household: Married or civil partnership couple: Dependent children | Single family household: Other single family household: Other family composition | Other household types: With dependent children | Other household types: Other, including all full-time students and all aged 66 years and over |
|---|---|---|---|---|---|---|---|---|---|---|---|---|---|---|
| Ashburton-Buckfastleigh | 18.3% | 16.0% | 10.9% | 0.9% | 5.6% | 3.5% | 4.9% | 6.8% | 4.5% | 10.8% | 11.7% | 0.4% | 1.9% | 3.6% |
| Axminster | 17.0% | 11.7% | 17.1% | 0.8% | 5.2% | 3.5% | 4.1% | 4.1% | 5.5% | 14.3% | 11.9% | 0.3% | 1.7% | 3.0% |
| Barnstaple | 15.3% | 15.3% | 12.4% | 0.7% | 6.3% | 3.8% | 5.0% | 6.1% | 5.3% | 12.1% | 12.4% | 0.5% | 1.9% | 3.1% |
| Bideford-Northam | 17.0% | 15.6% | 14.1% | 0.6% | 6.0% | 3.3% | 4.5% | 5.5% | 5.1% | 13.1% | 10.2% | 0.3% | 1.6% | 3.0% |
| Braunton | 16.0% | 12.2% | 15.1% | 0.4% | 5.0% | 3.2% | 4.4% | 4.6% | 5.3% | 12.3% | 16.9% | 0.3% | 1.5% | 2.7% |
| Cranbrook | 3.1% | 15.5% | 3.8% | 0.6% | 12.8% | 2.9% | 8.9% | 9.5% | 3.2% | 10.5% | 23.4% | 0.6% | 2.1% | 3.2% |
| Crediton | 15.1% | 13.8% | 13.5% | 0.6% | 6.2% | 3.3% | 4.3% | 5.1% | 5.4% | 13.4% | 14.0% | 0.3% | 2.0% | 3.0% |
| Cullompton | 13.5% | 13.7% | 11.8% | 0.7% | 6.5% | 3.0% | 4.9% | 5.4% | 6.1% | 13.4% | 15.8% | 0.3% | 2.1% | 2.7% |
| Dartmouth | 19.4% | 13.5% | 17.3% | 0.6% | 5.5% | 2.9% | 3.3% | 3.7% | 4.9% | 15.7% | 8.7% | 0.4% | 1.4% | 2.9% |
| Dawlish | 18.8% | 15.2% | 15.2% | 0.6% | 5.2% | 3.4% | 3.9% | 5.3% | 5.2% | 13.2% | 8.9% | 0.3% | 1.9% | 3.0% |
| Exeter (Wider) | 13.6% | 17.8% | 9.1% | 0.6% | 7.8% | 3.3% | 4.2% | 5.3% | 4.4% | 10.3% | 13.4% | 0.6% | 1.7% | 7.8% |
| Exmouth | 18.7% | 13.0% | 16.2% | 0.6% | 5.4% | 3.3% | 3.9% | 4.5% | 5.2% | 12.4% | 11.7% | 0.3% | 1.5% | 3.2% |
| Great Torrington | 16.4% | 12.4% | 14.7% | 0.7% | 6.2% | 3.2% | 4.4% | 4.8% | 5.5% | 14.5% | 11.3% | 0.4% | 2.2% | 3.3% |
| Holsworthy | 14.6% | 12.3% | 15.7% | 0.5% | 5.7% | 2.8% | 4.3% | 3.8% | 6.1% | 16.2% | 11.7% | 0.4% | 2.4% | 3.5% |
| Honiton | 17.3% | 14.0% | 15.8% | 0.5% | 6.4% | 3.2% | 4.1% | 4.1% | 5.0% | 12.7% | 11.3% | 0.4% | 1.7% | 3.5% |
| Ilfracombe | 16.4% | 18.2% | 12.7% | 0.8% | 5.6% | 3.6% | 4.5% | 5.8% | 4.6% | 11.6% | 10.2% | 0.5% | 2.2% | 3.4% |
| Ivybridge | 13.8% | 12.0% | 14.5% | 0.6% | 6.1% | 3.1% | 4.2% | 4.8% | 6.0% | 14.8% | 15.3% | 0.3% | 1.8% | 2.7% |
| Kingsbridge | 18.9% | 12.8% | 16.5% | 0.5% | 5.4% | 3.5% | 4.0% | 4.0% | 4.9% | 13.3% | 11.7% | 0.3% | 1.5% | 3.0% |
| Lynton-Lynmouth | 19.2% | 16.0% | 13.3% | 0.1% | 7.2% | 3.3% | 2.5% | 2.1% | 5.2% | 19.3% | 7.6% | 0.1% | 1.5% | 2.4% |
| Moretonhampstead | 17.3% | 11.9% | 15.4% | 0.7% | 6.1% | 3.3% | 3.6% | 3.5% | 4.8% | 16.0% | 12.2% | 0.3% | 2.0% | 3.0% |
| Newton Abbot | 15.1% | 13.9% | 13.1% | 0.8% | 6.5% | 3.4% | 4.7% | 5.6% | 5.5% | 12.9% | 13.2% | 0.3% | 1.7% | 3.2% |
| Okehampton | 15.4% | 13.3% | 14.1% | 0.6% | 6.2% | 3.1% | 4.1% | 4.7% | 5.3% | 14.4% | 12.7% | 0.3% | 2.3% | 3.5% |
| Ottery St Mary | 15.5% | 10.7% | 16.1% | 0.6% | 5.6% | 3.2% | 4.2% | 4.4% | 5.8% | 13.3% | 16.2% | 0.1% | 1.6% | 2.7% |
| Seaton | 23.2% | 12.1% | 20.9% | 0.6% | 4.9% | 3.3% | 3.0% | 3.7% | 4.6% | 12.3% | 7.9% | 0.2% | 1.0% | 2.3% |
| Sidmouth | 23.6% | 10.1% | 21.7% | 0.5% | 4.2% | 3.0% | 2.7% | 3.8% | 4.7% | 12.2% | 9.1% | 0.3% | 1.3% | 2.8% |
| South Molton | 16.1% | 12.9% | 14.8% | 0.6% | 6.0% | 3.0% | 4.6% | 4.9% | 5.5% | 14.4% | 11.5% | 0.3% | 2.1% | 3.3% |
| Tavistock | 17.3% | 12.7% | 16.0% | 0.4% | 5.4% | 3.1% | 3.5% | 4.4% | 5.8% | 15.1% | 11.9% | 0.3% | 1.5% | 2.6% |
| Teignmouth | 19.5% | 15.4% | 15.4% | 0.5% | 5.4% | 3.6% | 3.6% | 5.1% | 4.7% | 12.6% | 9.6% | 0.1% | 1.4% | 3.1% |
| Tiverton | 15.1% | 13.9% | 13.4% | 0.6% | 6.2% | 3.6% | 4.6% | 5.3% | 5.3% | 13.3% | 13.2% | 0.4% | 1.9% | 3.2% |
| Totnes | 18.0% | 13.9% | 13.0% | 0.6% | 5.3% | 3.4% | 3.8% | 5.5% | 5.5% | 12.6% | 12.1% | 0.4% | 1.9% | 4.0% |
| DCC Devon | 16.0% | 14.4% | 13.6% | 0.6% | 6.2% | 3.3% | 4.3% | 5.1% | 5.2% | 12.8% | 12.5% | 0.4% | 1.8% | 3.9% |
| Plymouth | 13.2% | 19.4% | 8.7% | 0.7% | 7.2% | 4.0% | 5.3% | 7.1% | 4.8% | 10.6% | 12.1% | 0.6% | 1.8% | 4.6% |
| Torbay | 17.6% | 17.1% | 12.1% | 0.7% | 5.6% | 3.9% | 4.4% | 6.3% | 4.8% | 11.0% | 10.0% | 0.5% | 2.3% | 3.7% |
| One Devon | 15.6% | 15.8% | 12.4% | 0.7% | 6.4% | 3.5% | 4.5% | 5.7% | 5.0% | 12.1% | 12.1% | 0.4% | 1.8% | 4.0% |
| South West | 14.6% | 15.7% | 11.6% | 0.7% | 6.7% | 4.4% | 3.5% | 5.7% | 5.3% | 13.4% | 11.8% | 0.5% | 1.9% | 4.3% |
| England | 12.8% | 17.3% | 9.2% | 0.7% | 6.3% | 4.5% | 4.2% | 6.9% | 5.6% | 14.4% | 10.4% | 0.8% | 2.7% | 4.2% |
Figure 2.2 b) Household Composition by Devon Town

Cranbrook stands out because it lacks the 66 plus categories that the other towns have. In contrast both Seaton and Sidmouth have more than 40% in those 66 plus categories.
2.3 Living arrangements
(ONS Table: TS010)
Table 2.3 a) Living Arrangements by District
| Area | Does not apply | Separated, but still married or in a civil partnership | Living in a same-sex couple: Cohabiting | Living in a same-sex couple: Married or in a civil partnership | Living in an opposite-sex couple: Cohabiting | Living in an opposite-sex couple: Married or in a civil partnership | Divorced or formerly in a civil partnership which is now legally dissolved | Not living in a couple: Married or in a registered civil partnership | Not living in a couple: Separated (including those who are married and those who are in civil partnerships) | Never married and never registered a same-sex civil partnership | Widowed or surviving partner from a civil partnership | Usual Residents 16 Plus | |
|---|---|---|---|---|---|---|---|---|---|---|---|---|---|
| East Devon | 23,411 | 99 | 703 | 399 | 16,386 | 63,784 | 8,753 | 1,074 | 2,027 | 22,650 | 9,078 | 148,364 | |
| Exeter | 19,350 | 76 | 844 | 343 | 14,561 | 38,142 | 7,087 | 882 | 1,621 | 33,085 | 4,946 | 120,937 | |
| Mid Devon | 14,579 | 63 | 334 | 261 | 9,583 | 33,513 | 4,439 | 531 | 1,257 | 13,364 | 4,259 | 82,183 | |
| North Devon | 16,375 | 61 | 423 | 242 | 11,250 | 38,944 | 5,805 | 632 | 1,462 | 16,364 | 5,559 | 97,117 | |
| South Hams | 13,651 | 39 | 343 | 319 | 9,437 | 38,033 | 5,497 | 619 | 1,200 | 13,736 | 4,845 | 87,719 | |
| Teignbridge | 21,304 | 105 | 662 | 412 | 15,686 | 53,827 | 8,705 | 845 | 1,959 | 21,706 | 7,485 | 132,696 | |
| Torridge | 10,504 | 56 | 324 | 212 | 7,834 | 28,150 | 4,120 | 421 | 1,028 | 10,685 | 3,994 | 67,328 | |
| West Devon | 8,611 | 54 | 244 | 148 | 5,842 | 24,510 | 3,265 | 422 | 767 | 8,593 | 3,200 | 55,656 | |
| DCC Total | 127,785 | 553 | 3,877 | 2,336 | 90,579 | 318,903 | 47,671 | 5,426 | 11,321 | 140,183 | 43,366 | 792,000 | |
| Plymouth | 46,009 | 197 | 1,851 | 692 | 32,626 | 84,781 | 16,850 | 1,734 | 4,438 | 56,496 | 11,805 | 257,479 | |
| Torbay | 22,276 | 109 | 838 | 617 | 15,772 | 49,172 | 10,376 | 1,130 | 2,249 | 26,671 | 8,079 | 137,289 | |
| One Devon | 196,070 | 859 | 6,566 | 3,645 | 138,977 | 452,856 | 74,897 | 8,290 | 18,008 | 223,350 | 63,250 | 1,186,768 | |
| South West | 959,355 | 4,207 | 29,817 | 16,414 | 653,187 | 2,121,408 | 327,469 | 41,917 | 78,574 | 1,072,488 | 277,763 | 5,582,599 | |
| England | 10,448,846 | 45,382 | 300,421 | 150,393 | 6,037,611 | 19,527,902 | 2,976,317 | 629,736 | 841,329 | 12,033,302 | 2,513,060 | 55,504,299 | |
| Area | Does not apply | Separated, but still married or in a civil partnership | Living in a same-sex couple: Cohabiting | Living in a same-sex couple: Married or in a civil partnership | Living in an opposite-sex couple: Cohabiting | Living in an opposite-sex couple: Married or in a civil partnership | Divorced or formerly in a civil partnership which is now legally dissolved | Not living in a couple: Married or in a registered civil partnership | Not living in a couple: Separated (including those who are married and those who are in civil partnerships) | Never married and never registered a same-sex civil partnership | Widowed or surviving partner from a civil partnership |
|---|---|---|---|---|---|---|---|---|---|---|---|
| East Devon | 15.8% | 0.1% | 0.5% | 0.3% | 11.0% | 43.0% | 5.9% | 0.7% | 1.4% | 15.3% | 6.1% |
| Exeter | 16.0% | 0.1% | 0.7% | 0.3% | 12.0% | 31.5% | 5.9% | 0.7% | 1.3% | 27.4% | 4.1% |
| Mid Devon | 17.7% | 0.1% | 0.4% | 0.3% | 11.7% | 40.8% | 5.4% | 0.6% | 1.5% | 16.3% | 5.2% |
| North Devon | 16.9% | 0.1% | 0.4% | 0.2% | 11.6% | 40.1% | 6.0% | 0.7% | 1.5% | 16.8% | 5.7% |
| South Hams | 15.6% | 0.0% | 0.4% | 0.4% | 10.8% | 43.4% | 6.3% | 0.7% | 1.4% | 15.7% | 5.5% |
| Teignbridge | 16.1% | 0.1% | 0.5% | 0.3% | 11.8% | 40.6% | 6.6% | 0.6% | 1.5% | 16.4% | 5.6% |
| Torridge | 15.6% | 0.1% | 0.5% | 0.3% | 11.6% | 41.8% | 6.1% | 0.6% | 1.5% | 15.9% | 5.9% |
| West Devon | 15.5% | 0.1% | 0.4% | 0.3% | 10.5% | 44.0% | 5.9% | 0.8% | 1.4% | 15.4% | 5.7% |
| DCC Total | 16.1% | 0.1% | 0.5% | 0.3% | 11.4% | 40.3% | 6.0% | 0.7% | 1.4% | 17.7% | 5.5% |
| Plymouth | 17.9% | 0.1% | 0.7% | 0.3% | 12.7% | 32.9% | 6.5% | 0.7% | 1.7% | 21.9% | 4.6% |
| Torbay | 16.2% | 0.1% | 0.6% | 0.4% | 11.5% | 35.8% | 7.6% | 0.8% | 1.6% | 19.4% | 5.9% |
| One Devon | 16.5% | 0.1% | 0.6% | 0.3% | 11.7% | 38.2% | 6.3% | 0.7% | 1.5% | 18.8% | 5.3% |
| South West | 17.2% | 0.1% | 0.5% | 0.3% | 11.7% | 38.0% | 5.9% | 0.8% | 1.4% | 19.2% | 5.0% |
| England | 18.8% | 0.1% | 0.5% | 0.3% | 10.9% | 35.2% | 5.4% | 1.1% | 1.5% | 21.7% | 4.5% |
Figure 2.3 a) Living Arrangements by District

Most districts follow roughly the national averages with opposite-sex couples cohabiting, opposite-sex married and never married being the largest types (More than 60%). Exeter differs in that it has much larger percentage of never married. 6% in Devon are Divorced with another 1.4% separated. Less than 1% live in same sex relationships.
2.4 Household deprivation
(ONS Table TS011)
Table 2.4 a) Household Deprivation by District
| Area | Household is not deprived in any dimension | Household is deprived in one dimension | Household is deprived in two dimensions | Household is deprived in three dimensions | Household is deprived in four dimensions | Total Households | Household is not deprived in any dimension % | Household is deprived in one dimension % | Household is deprived in two dimensions % | Household is deprived in three dimensions % | Household is deprived in four dimensions % |
|---|---|---|---|---|---|---|---|---|---|---|---|
| East Devon | 33,892 | 23,613 | 7,814 | 1,386 | 87 | 66,792 | 50.7% | 35.4% | 11.7% | 2.1% | 0.1% |
| Exeter | 26,183 | 17,444 | 7,025 | 1,779 | 132 | 52,563 | 49.8% | 33.2% | 13.4% | 3.4% | 0.3% |
| Mid Devon | 17,498 | 12,497 | 4,651 | 928 | 49 | 35,623 | 49.1% | 35.1% | 13.1% | 2.6% | 0.1% |
| North Devon | 20,708 | 15,120 | 6,008 | 1,279 | 91 | 43,206 | 47.9% | 35.0% | 13.9% | 3.0% | 0.2% |
| South Hams | 20,847 | 13,175 | 4,427 | 829 | 47 | 39,325 | 53.0% | 33.5% | 11.3% | 2.1% | 0.1% |
| Teignbridge | 29,571 | 20,908 | 7,764 | 1,482 | 107 | 59,832 | 49.4% | 34.9% | 13.0% | 2.5% | 0.2% |
| Torridge | 14,051 | 10,957 | 4,486 | 907 | 59 | 30,460 | 46.1% | 36.0% | 14.7% | 3.0% | 0.2% |
| West Devon | 12,238 | 8,736 | 3,175 | 621 | 47 | 24,817 | 49.3% | 35.2% | 12.8% | 2.5% | 0.2% |
| DCC Devon | 174,988 | 122,450 | 45,350 | 9,211 | 619 | 352,618 | 49.6% | 34.7% | 12.9% | 2.6% | 0.2% |
| Plymouth | 52,097 | 38,898 | 18,225 | 5,057 | 279 | 114,556 | 45.5% | 34.0% | 15.9% | 4.4% | 0.2% |
| Torbay | 26,538 | 22,610 | 10,612 | 2,987 | 250 | 62,997 | 42.1% | 35.9% | 16.8% | 4.7% | 0.4% |
| One Devon | 253,623 | 183,958 | 74,187 | 17,255 | 1,148 | 530,171 | 47.8% | 34.7% | 14.0% | 3.3% | 0.2% |
| South West | 1,225,986 | 828,631 | 317,350 | 72,014 | 4,900 | 2,448,881 | 50.1% | 33.8% | 13.0% | 2.9% | 0.2% |
| England | 11,349,743 | 7,842,690 | 3,320,576 | 868,106 | 54,970 | 23,436,085 | 48.4% | 33.5% | 14.2% | 3.7% | 0.2% |
Figure 2.4 a) Household Deprivation by District

Devon and it’s districts are generally close to SW and England averages. Plymouth and especially Torbay have higher percentages with two and three dimensions
Table 2.4 b) Household Deprivation by Devon Town
| Area | Household is not deprived in any dimension | Household is deprived in one dimension | Household is deprived in two dimensions | Household is deprived in three dimensions | Household is deprived in four dimensions | Total Households | Household is not deprived in any dimension % | Household is deprived in one dimension % | Household is deprived in two dimensions % | Household is deprived in three dimensions % | Household is deprived in four dimensions % |
|---|---|---|---|---|---|---|---|---|---|---|---|
| Ashburton-Buckfastleigh | 1,680 | 1,205 | 528 | 102 | 5 | 3,520 | 47.7% | 34.2% | 15.0% | 2.9% | 0.1% |
| Axminster | 3,579 | 2,578 | 898 | 149 | 5 | 7,209 | 49.6% | 35.8% | 12.5% | 2.1% | 0.1% |
| Barnstaple | 10,071 | 7,358 | 3,066 | 686 | 41 | 21,222 | 47.5% | 34.7% | 14.4% | 3.2% | 0.2% |
| Bideford-Northam | 8,313 | 6,342 | 2,602 | 579 | 39 | 17,875 | 46.5% | 35.5% | 14.6% | 3.2% | 0.2% |
| Braunton | 2,787 | 1,765 | 546 | 69 | 4 | 5,171 | 53.9% | 34.1% | 10.6% | 1.3% | 0.1% |
| Cranbrook | 1,820 | 810 | 233 | 54 | 6 | 2,923 | 62.3% | 27.7% | 8.0% | 1.8% | 0.2% |
| Crediton | 4,662 | 3,362 | 1,254 | 253 | 13 | 9,544 | 48.8% | 35.2% | 13.1% | 2.7% | 0.1% |
| Cullompton | 5,506 | 3,677 | 1,289 | 226 | 8 | 10,706 | 51.4% | 34.3% | 12.0% | 2.1% | 0.1% |
| Dartmouth | 2,528 | 1,734 | 569 | 121 | 7 | 4,959 | 51.0% | 35.0% | 11.5% | 2.4% | 0.1% |
| Dawlish | 3,492 | 2,809 | 1,145 | 260 | 16 | 7,722 | 45.2% | 36.4% | 14.8% | 3.4% | 0.2% |
| Exeter (Wider) | 31,729 | 20,578 | 8,034 | 1,949 | 138 | 62,428 | 50.8% | 33.0% | 12.9% | 3.1% | 0.2% |
| Exmouth | 10,772 | 7,758 | 2,750 | 541 | 39 | 21,860 | 49.3% | 35.5% | 12.6% | 2.5% | 0.2% |
| Great Torrington | 2,252 | 1,741 | 667 | 114 | 7 | 4,781 | 47.1% | 36.4% | 14.0% | 2.4% | 0.1% |
| Holsworthy | 3,380 | 2,740 | 1,143 | 206 | 14 | 7,483 | 45.2% | 36.6% | 15.3% | 2.8% | 0.2% |
| Honiton | 4,039 | 3,200 | 1,126 | 187 | 11 | 8,563 | 47.2% | 37.4% | 13.1% | 2.2% | 0.1% |
| Ilfracombe | 3,472 | 2,733 | 1,130 | 308 | 29 | 7,672 | 45.3% | 35.6% | 14.7% | 4.0% | 0.4% |
| Ivybridge | 8,813 | 5,134 | 1,566 | 270 | 11 | 15,794 | 55.8% | 32.5% | 9.9% | 1.7% | 0.1% |
| Kingsbridge | 4,227 | 2,742 | 975 | 195 | 14 | 8,153 | 51.8% | 33.6% | 12.0% | 2.4% | 0.2% |
| Lynton-Lynmouth | 361 | 274 | 94 | 21 | – | 750 | 48.1% | 36.5% | 12.5% | 2.8% | 0.0% |
| Moretonhampstead | 1,063 | 657 | 192 | 29 | – | 1,941 | 54.8% | 33.8% | 9.9% | 1.5% | 0.0% |
| Newton Abbot | 16,396 | 11,419 | 4,147 | 791 | 59 | 32,812 | 50.0% | 34.8% | 12.6% | 2.4% | 0.2% |
| Okehampton | 5,929 | 4,351 | 1,642 | 322 | 31 | 12,275 | 48.3% | 35.4% | 13.4% | 2.6% | 0.3% |
| Ottery St Mary | 3,605 | 2,295 | 634 | 110 | 8 | 6,652 | 54.2% | 34.5% | 9.5% | 1.7% | 0.1% |
| Seaton | 2,908 | 2,384 | 801 | 102 | 11 | 6,206 | 46.9% | 38.4% | 12.9% | 1.6% | 0.2% |
| Sidmouth | 4,023 | 2,934 | 848 | 153 | 3 | 7,961 | 50.5% | 36.9% | 10.7% | 1.9% | 0.0% |
| South Molton | 3,185 | 2,361 | 925 | 165 | 14 | 6,650 | 47.9% | 35.5% | 13.9% | 2.5% | 0.2% |
| Tavistock | 6,773 | 4,749 | 1,680 | 318 | 16 | 13,536 | 50.0% | 35.1% | 12.4% | 2.3% | 0.1% |
| Teignmouth | 4,208 | 3,165 | 1,212 | 216 | 25 | 8,826 | 47.7% | 35.9% | 13.7% | 2.4% | 0.3% |
| Tiverton | 8,136 | 6,030 | 2,337 | 472 | 30 | 17,005 | 47.8% | 35.5% | 13.7% | 2.8% | 0.2% |
| Totnes | 5,279 | 3,565 | 1,317 | 243 | 15 | 10,419 | 50.7% | 34.2% | 12.6% | 2.3% | 0.1% |
| Plymouth | 52,097 | 38,898 | 18,225 | 5,057 | 279 | 114,556 | 45.5% | 34.0% | 15.9% | 4.4% | 0.2% |
| Torbay | 26,538 | 22,610 | 10,612 | 2,987 | 250 | 62,997 | 42.1% | 35.9% | 16.8% | 4.7% | 0.4% |
| One Devon | 253,623 | 183,958 | 74,187 | 17,255 | 1,148 | 530,171 | 47.8% | 34.7% | 14.0% | 3.3% | 0.2% |
| DCC Devon | 174,988 | 122,450 | 45,350 | 9,211 | 619 | 352,618 | 49.6% | 34.7% | 12.9% | 2.6% | 0.2% |
| South West | 1,225,986 | 828,631 | 317,350 | 72,014 | 4,900 | 2,448,881 | 50.1% | 33.8% | 13.0% | 2.9% | 0.2% |
| England | 11,349,743 | 7,842,690 | 3,320,576 | 868,106 | 54,970 | 23,436,085 | 48.4% | 33.5% | 14.2% | 3.7% | 0.2% |
Figure 2.4 b) Household Deprivation by Devon Town

Most of the towns closely follow the SW and England figures. Cranbrook, Braunton, Ivybridge, Moretonhampstead and Ottery St Mary all have high percentages of no deprivation.
Map 2.4 a) Household Deprivation with 3 plus Dimensions by Output Area
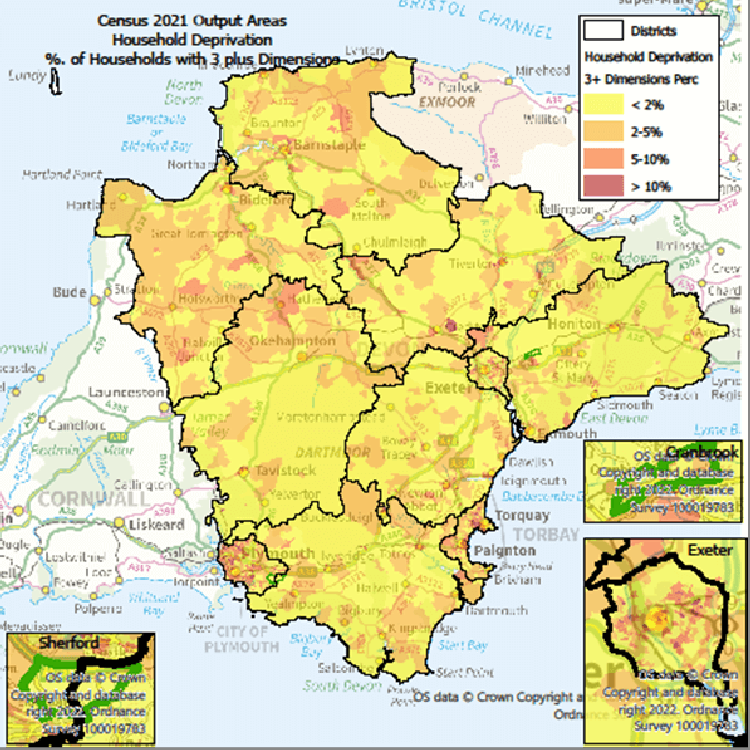
Most of the deprived output areas are in Exeter, Torbay & Plymouth.
2.5 Marital or civil partnership status
(ONS Table TS002)
Table 2.5 a) Marital or civil partnership status by District
| Area | Does not apply | Never married and never registered a civil partnership | Married: Opposite sex | Married: Same sex | In a registered civil partnership: Opposite sex | In a registered civil partnership: Same sex | Separated, but still married | Separated, but still in a registered civil partnership | Divorced | Formerly in a civil partnership now legally dissolved | Widowed | Surviving partner from civil partnership | All Usual Residents |
|---|---|---|---|---|---|---|---|---|---|---|---|---|---|
| East Devon | 23,439 | 35,235 | 65,367 | 295 | 112 | 201 | 2,568 | 22 | 13,197 | 22 | 10,357 | 15 | 150,830 |
| Exeter | 19,378 | 54,224 | 39,287 | 273 | 86 | 130 | 2,029 | 20 | 9,738 | 32 | 5,505 | 9 | 130,711 |
| Mid Devon | 14,647 | 20,480 | 34,249 | 200 | 42 | 114 | 1,569 | 10 | 6,805 | 18 | 4,713 | 5 | 82,852 |
| North Devon | 16,418 | 25,062 | 40,008 | 208 | 48 | 100 | 1,850 | 8 | 8,692 | 16 | 6,187 | 13 | 98,610 |
| South Hams | 13,659 | 20,612 | 38,839 | 210 | 80 | 150 | 1,457 | 12 | 8,110 | 28 | 5,462 | 9 | 88,628 |
| Teignbridge | 21,342 | 33,413 | 55,149 | 293 | 80 | 211 | 2,503 | 16 | 13,109 | 39 | 8,639 | 10 | 134,804 |
| Torridge | 10,555 | 16,317 | 28,787 | 165 | 47 | 97 | 1,296 | 17 | 6,275 | 16 | 4,540 | 3 | 68,115 |
| West Devon | 8,733 | 13,211 | 25,139 | 109 | 50 | 72 | 1,030 | 2 | 5,061 | 8 | 3,677 | 5 | 57,097 |
| Torbay | 22,292 | 38,409 | 50,931 | 456 | 58 | 270 | 2,803 | 21 | 14,703 | 30 | 9,338 | 12 | 139,323 |
| Plymouth | 46,071 | 87,840 | 87,275 | 603 | 140 | 264 | 5,527 | 105 | 23,443 | 80 | 13,329 | 21 | 264,698 |
| One Devon | 196,534 | 344,803 | 465,031 | 2,812 | 743 | 1,609 | 22,632 | 233 | 109,133 | 289 | 71,747 | 102 | 1,215,668 |
| DCC Devon | 128,171 | 218,554 | 326,825 | 1,753 | 545 | 1,075 | 14,302 | 107 | 70,987 | 179 | 49,080 | 69 | 811,647 |
| South West | 965,346 | 1,641,415 | 2,179,876 | 12,698 | 3,528 | 7,132 | 99,224 | 736 | 476,871 | 1,208 | 312,673 | 479 | 5,701,186 |
| England | 10,483,091 | 17,450,123 | 20,336,565 | 127,510 | 34,066 | 63,501 | 1,025,980 | 7,541 | 4,160,359 | 11,277 | 2,785,998 | 4,035 | 56,490,046 |
| Area | Does not apply | Never married and never registered a civil partnership | Married: Opposite sex | Married: Same sex | In a registered civil partnership: Opposite sex | In a registered civil partnership: Same sex | Separated, but still married | Separated, but still in a registered civil partnership | Divorced | Formerly in a civil partnership now legally dissolved | Widowed | Surviving partner from civil partnership |
|---|---|---|---|---|---|---|---|---|---|---|---|---|
| East Devon | 15.5% | 23.4% | 43.3% | 0.2% | 0.1% | 0.1% | 1.7% | 0.0% | 8.7% | 0.0% | 6.9% | 0.0% |
| Exeter | 14.8% | 41.5% | 30.1% | 0.2% | 0.1% | 0.1% | 1.6% | 0.0% | 7.5% | 0.0% | 4.2% | 0.0% |
| Mid Devon | 17.7% | 24.7% | 41.3% | 0.2% | 0.1% | 0.1% | 1.9% | 0.0% | 8.2% | 0.0% | 5.7% | 0.0% |
| North Devon | 16.6% | 25.4% | 40.6% | 0.2% | 0.0% | 0.1% | 1.9% | 0.0% | 8.8% | 0.0% | 6.3% | 0.0% |
| South Hams | 15.4% | 23.3% | 43.8% | 0.2% | 0.1% | 0.2% | 1.6% | 0.0% | 9.2% | 0.0% | 6.2% | 0.0% |
| Teignbridge | 15.8% | 24.8% | 40.9% | 0.2% | 0.1% | 0.2% | 1.9% | 0.0% | 9.7% | 0.0% | 6.4% | 0.0% |
| Torridge | 15.5% | 24.0% | 42.3% | 0.2% | 0.1% | 0.1% | 1.9% | 0.0% | 9.2% | 0.0% | 6.7% | 0.0% |
| West Devon | 15.3% | 23.1% | 44.0% | 0.2% | 0.1% | 0.1% | 1.8% | 0.0% | 8.9% | 0.0% | 6.4% | 0.0% |
| Torbay | 16.0% | 27.6% | 36.6% | 0.3% | 0.0% | 0.2% | 2.0% | 0.0% | 10.6% | 0.0% | 6.7% | 0.0% |
| Plymouth | 17.4% | 33.2% | 33.0% | 0.2% | 0.1% | 0.1% | 2.1% | 0.0% | 8.9% | 0.0% | 5.0% | 0.0% |
| One Devon | 16.2% | 28.4% | 38.3% | 0.2% | 0.1% | 0.1% | 1.9% | 0.0% | 9.0% | 0.0% | 5.9% | 0.0% |
| DCC Devon | 15.8% | 26.9% | 40.3% | 0.2% | 0.1% | 0.1% | 1.8% | 0.0% | 8.7% | 0.0% | 6.0% | 0.0% |
| South West | 16.9% | 28.8% | 38.2% | 0.2% | 0.1% | 0.1% | 1.7% | 0.0% | 8.4% | 0.0% | 5.5% | 0.0% |
| England | 18.6% | 30.9% | 36.0% | 0.2% | 0.1% | 0.1% | 1.8% | 0.0% | 7.4% | 0.0% | 4.9% | 0.0% |
Figure 2.5 a) Marital or civil partnership status by District
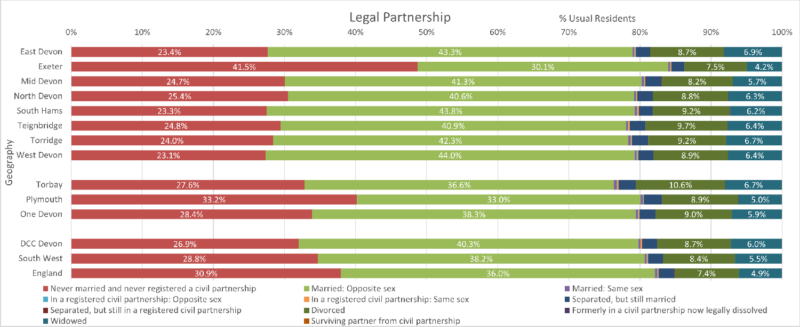
Most of Devon roughly follows the national figures with the main groups being Never Married, Married Opposite Sex, Divorced and Widowed. Exeter and Plymouth differ with more Never Married maybe because of higher numbers of university students. There are more Widowed in most areas but especially East Devon, Torridge and Torbay.
2.6 Armed Forces Veterans
(ONS Table TS071)
Table 2.6 a) Armed Forces Veterans by District
| LowerTier | Does not apply | Has not previously served in any UK armed forces | Previously served in both regular and reserve UK armed forces | Previously served in UK armed forces | Previously served in UK reserve armed forces | Total Previously Served | Usual Residents | Percent Does Not Apply | Percent Has not previously served in any UK armed forces | Percent Previously served in both regular and reserve UK armed forces | Percent Previously served in UK armed forces | Percent Previously served in UK reserve armed forces | Percent Total Previously Served |
|---|---|---|---|---|---|---|---|---|---|---|---|---|---|
| East Devon | 23,439 | 118,831 | 371 | 6,969 | 1,219 | 8,559 | 150,829 | 15.54 | 78.79 | 0.25 | 4.62 | 0.81 | 5.7% |
| Exeter | 19,378 | 106,978 | 215 | 3,339 | 798 | 4,352 | 130,708 | 14.83 | 81.85 | 0.16 | 2.55 | 0.61 | 3.3% |
| Mid Devon | 14,647 | 64,646 | 190 | 2,795 | 573 | 3,558 | 82,851 | 17.68 | 78.03 | 0.23 | 3.37 | 0.69 | 4.3% |
| North Devon | 16,418 | 77,342 | 192 | 3,984 | 675 | 4,851 | 98,611 | 16.65 | 78.43 | 0.19 | 4.04 | 0.68 | 4.9% |
| South Hams | 13,659 | 69,971 | 166 | 4,099 | 732 | 4,997 | 88,627 | 15.41 | 78.95 | 0.19 | 4.63 | 0.83 | 5.6% |
| Teignbridge | 21,342 | 106,574 | 293 | 5,577 | 1,016 | 6,886 | 134,802 | 15.83 | 79.06 | 0.22 | 4.14 | 0.75 | 5.1% |
| Torridge | 10,555 | 54,343 | 127 | 2,587 | 502 | 3,216 | 68,114 | 15.50 | 79.78 | 0.19 | 3.80 | 0.74 | 4.7% |
| West Devon | 8,733 | 44,855 | 168 | 2,849 | 491 | 3,508 | 57,096 | 15.30 | 78.56 | 0.29 | 4.99 | 0.86 | 6.1% |
| Plymouth | 46,071 | 200,345 | 629 | 15,507 | 2,143 | 18,279 | 264,695 | 17.41 | 75.69 | 0.24 | 5.86 | 0.81 | 6.9% |
| Torbay | 22,292 | 110,095 | 246 | 5,636 | 1,054 | 6,936 | 139,323 | 16.00 | 79.02 | 0.18 | 4.05 | 0.76 | 5.0% |
| One Devon | 196,534 | 953,980 | 2,597 | 53,342 | 9,203 | 65,142 | 1,215,656 | 16.17 | 78.47 | 0.21 | 4.39 | 0.76 | 5.4% |
| DCC Area | 128,171 | 643,540 | 1,722 | 32,199 | 6,006 | 39,927 | 811,638 | 15.79 | 79.29 | 0.21 | 3.97 | 0.74 | 4.9% |
| South West | 965,346 | 4,471,093 | 11,509 | 212,657 | 40,584 | 264,750 | 5,701,189 | 16.93 | 78.42 | 0.20 | 3.73 | 0.71 | 4.6% |
| England & Wales | 11,031,166 | 46,713,259 | 79,041 | 1,413,290 | 360,773 | 1,853,104 | 59,597,529 | 18.51 | 78.38 | 0.13 | 2.37 | 0.61 | 3.1% |
Figure 2.6 a) Armed Forces Veterans by District
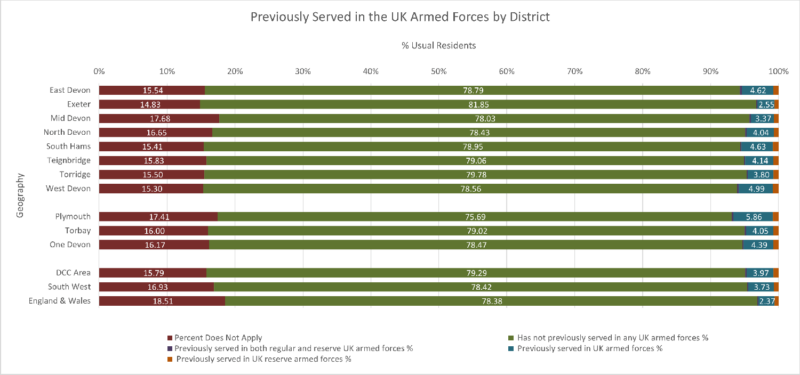
Though most people have never served in the UK Armed Forces the figures in Devon are higher than the national average. Plymouth has the highest figure.
Map 2.6 a) Armed Forces Veterans by Middle Super Output Area
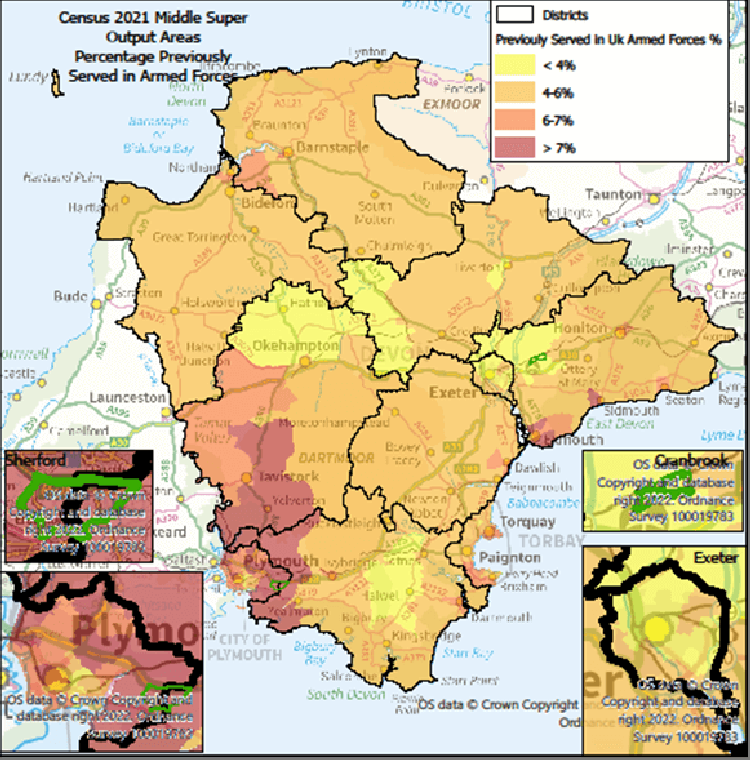
Plymouth and the areas around it in South Hams and West Devon show the highest numbers of veterans. Elsewhere there are a couple of hotspots in Exmouth and Sidmouth.
2.7 Migration
(ONS Table TS019)
Table 2.7 a) Migration by District
| Area | Address one year ago is the same as the address of enumeration | Migrant from within the UK: Address one year ago was in the UK | Migrant from outside the UK: Address one year ago was outside the UK | Address one year ago is student term-time or boarding school address in the UK | Does not apply (Under 1s?) | Usual Residents | Address one year ago is the same as the address of enumeration Perc | Migrant from within the UK: Address one year ago was in the UK Perc | Migrant from outside the UK: Address one year ago was outside the UK Perc | Address one year ago is student term-time or boarding school address in the UK Perc | Does not apply (Under 1s?) Perc |
|---|---|---|---|---|---|---|---|---|---|---|---|
| East Devon | 133,747 | 14,785 | 742 | 362 | 1,192 | 150,828 | 88.7% | 9.8% | 0.5% | 0.2% | 0.8% |
| Exeter | 101,262 | 20,068 | 2,568 | 5,648 | 1,163 | 130,709 | 77.5% | 15.4% | 2.0% | 4.3% | 0.9% |
| Mid Devon | 73,913 | 7,668 | 350 | 168 | 752 | 82,851 | 89.2% | 9.3% | 0.4% | 0.2% | 0.9% |
| North Devon | 87,346 | 9,740 | 545 | 191 | 789 | 98,611 | 88.6% | 9.9% | 0.6% | 0.2% | 0.8% |
| South Hams | 78,377 | 8,945 | 532 | 192 | 581 | 88,627 | 88.4% | 10.1% | 0.6% | 0.2% | 0.7% |
| Teignbridge | 120,897 | 12,136 | 487 | 241 | 1,042 | 134,803 | 89.7% | 9.0% | 0.4% | 0.2% | 0.8% |
| Torridge | 60,863 | 6,320 | 301 | 113 | 517 | 68,114 | 89.4% | 9.3% | 0.4% | 0.2% | 0.8% |
| West Devon | 51,150 | 5,097 | 287 | 145 | 417 | 57,096 | 89.6% | 8.9% | 0.5% | 0.3% | 0.7% |
| Plymouth | 228,569 | 28,731 | 1,712 | 3,233 | 2,450 | 264,695 | 86.4% | 10.9% | 0.6% | 1.2% | 0.9% |
| Torbay | 125,210 | 12,087 | 673 | 271 | 1,083 | 139,324 | 89.9% | 8.7% | 0.5% | 0.2% | 0.8% |
| One Devon | 1,061,334 | 125,577 | 8,197 | 10,564 | 9,986 | 1,215,658 | 87.3% | 10.3% | 0.7% | 0.9% | 0.8% |
| DCC Devon | 707,555 | 84,759 | 5,812 | 7,060 | 6,453 | 811,639 | 87.2% | 10.4% | 0.7% | 0.9% | 0.8% |
| South West | 4,980,674 | 585,443 | 42,238 | 41,833 | 50,998 | 5,701,186 | 87.4% | 10.3% | 0.7% | 0.7% | 0.9% |
| England | 49,709,802 | 5,343,417 | 528,760 | 329,081 | 578,985 | 56,490,045 | 88.0% | 9.5% | 0.9% | 0.6% | 1.0% |
Figure 2.7 a) Migration by District

Most people haven’t moved in the last 12 months with about 10% moving in from elsewhere in the UK. Exeter differs in that it had more than 15% from within UK ,2% from outside the UK and 4.3% students.
Table 2.7 b) Migration by Devon Town
| Devon Towns | Address one year ago is the same as the address of enumeration | Migrant from within the UK: Address one year ago was in the UK | Migrant from outside the UK: Address one year ago was outside the UK | Address one year ago is student term-time or boarding school address in the UK | Does not apply (Under 1s?) | Usual Residents | Address one year ago is the same as the address of enumeration % | Migrant from within the UK: Address one year ago was in the UK% | Migrant from outside the UK: Address one year ago was outside the UK% | Address one year ago is student term-time or boarding school address in the UK% |
|---|---|---|---|---|---|---|---|---|---|---|
| Ashburton-Buckfastleigh | 7,013 | 701 | 27 | 9 | 41 | 7,791 | 90.0% | 9.0% | 0.3% | 0.1% |
| Axminster | 14,484 | 1,529 | 82 | 30 | 117 | 16,242 | 89.2% | 9.4% | 0.5% | 0.2% |
| Barnstaple | 42,781 | 4,747 | 280 | 84 | 412 | 48,304 | 88.6% | 9.8% | 0.6% | 0.2% |
| Bideford-Northam | 34,837 | 3,631 | 173 | 67 | 305 | 39,013 | 89.3% | 9.3% | 0.4% | 0.2% |
| Braunton | 10,944 | 1,279 | 96 | 30 | 76 | 12,425 | 88.1% | 10.3% | 0.8% | 0.2% |
| Cranbrook | 6,546 | 1,080 | 35 | 13 | 142 | 7,816 | 83.8% | 13.8% | 0.4% | 0.2% |
| Crediton | 19,678 | 2,049 | 93 | 49 | 195 | 22,064 | 89.2% | 9.3% | 0.4% | 0.2% |
| Cullompton | 22,951 | 2,134 | 88 | 33 | 264 | 25,470 | 90.1% | 8.4% | 0.3% | 0.1% |
| Dartmouth | 9,271 | 1,155 | 79 | 18 | 50 | 10,573 | 87.7% | 10.9% | 0.7% | 0.2% |
| Dawlish | 14,898 | 1,555 | 48 | 20 | 110 | 16,631 | 89.6% | 9.4% | 0.3% | 0.1% |
| Exeter (Wider) | 121,915 | 22,443 | 2,689 | 5,705 | 1,406 | 154,158 | 79.1% | 14.6% | 1.7% | 3.7% |
| Exmouth | 43,452 | 4,989 | 266 | 130 | 337 | 49,174 | 88.4% | 10.1% | 0.5% | 0.3% |
| Great Torrington | 9,828 | 928 | 38 | 15 | 111 | 10,920 | 90.0% | 8.5% | 0.3% | 0.1% |
| Holsworthy | 15,534 | 1,696 | 80 | 26 | 114 | 17,450 | 89.0% | 9.7% | 0.5% | 0.1% |
| Honiton | 17,211 | 1,574 | 94 | 34 | 154 | 19,067 | 90.3% | 8.3% | 0.5% | 0.2% |
| Ilfracombe | 15,264 | 1,546 | 65 | 40 | 107 | 17,022 | 89.7% | 9.1% | 0.4% | 0.2% |
| Ivybridge | 32,614 | 3,791 | 186 | 81 | 271 | 36,943 | 88.3% | 10.3% | 0.5% | 0.2% |
| Kingsbridge | 15,825 | 1,770 | 120 | 33 | 103 | 17,851 | 88.7% | 9.9% | 0.7% | 0.2% |
| Lynton-Lynmouth | 1,424 | 171 | 6 | 1 | 5 | 1,607 | 88.6% | 10.6% | 0.4% | 0.1% |
| Moretonhampstead | 3,937 | 323 | 32 | 10 | 29 | 4,331 | 90.9% | 7.5% | 0.7% | 0.2% |
| Newton Abbot | 67,609 | 7,070 | 265 | 145 | 654 | 75,743 | 89.3% | 9.3% | 0.3% | 0.2% |
| Okehampton | 25,393 | 2,518 | 148 | 55 | 217 | 28,331 | 89.6% | 8.9% | 0.5% | 0.2% |
| Ottery St Mary | 14,038 | 1,409 | 75 | 49 | 127 | 15,698 | 89.4% | 9.0% | 0.5% | 0.3% |
| Seaton | 11,486 | 1,146 | 44 | 25 | 60 | 12,761 | 90.0% | 9.0% | 0.3% | 0.2% |
| Sidmouth | 14,932 | 1,545 | 64 | 37 | 95 | 16,673 | 89.6% | 9.3% | 0.4% | 0.2% |
| South Molton | 13,405 | 1,538 | 79 | 30 | 155 | 15,207 | 88.2% | 10.1% | 0.5% | 0.2% |
| Tavistock | 27,723 | 2,786 | 152 | 92 | 202 | 30,955 | 89.6% | 9.0% | 0.5% | 0.3% |
| Teignmouth | 17,054 | 1,517 | 73 | 36 | 120 | 18,800 | 90.7% | 8.1% | 0.4% | 0.2% |
| Tiverton | 34,840 | 3,899 | 181 | 85 | 314 | 39,319 | 88.6% | 9.9% | 0.5% | 0.2% |
| Totnes | 20,661 | 2,228 | 145 | 62 | 154 | 23,250 | 88.9% | 9.6% | 0.6% | 0.3% |
| Plymouth | 228,569 | 28,731 | 1,712 | 3,233 | 2,450 | 264,695 | 86.4% | 10.9% | 0.6% | 1.2% |
| Torbay | 125,210 | 12,087 | 673 | 271 | 1,083 | 139,324 | 89.9% | 8.7% | 0.5% | 0.2% |
| One Devon | 1,061,334 | 125,577 | 8,197 | 10,564 | 9,986 | 1,215,658 | 87.3% | 10.3% | 0.7% | 0.9% |
| DCC Devon | 707,548 | 84,747 | 5,803 | 7,044 | 6,447 | 811,589 | 87.2% | 10.4% | 0.7% | 0.9% |
| South West | 4,980,674 | 585,443 | 42,238 | 41,833 | 50,998 | 5,701,186 | 87.4% | 10.3% | 0.7% | 0.7% |
| England | 49,709,802 | 5,343,417 | 528,760 | 329,081 | 578,985 | 56,490,045 | 88.0% | 9.5% | 0.9% | 0.6% |
Figure 2.7 b) Migration in last 12 Months by Devon Town
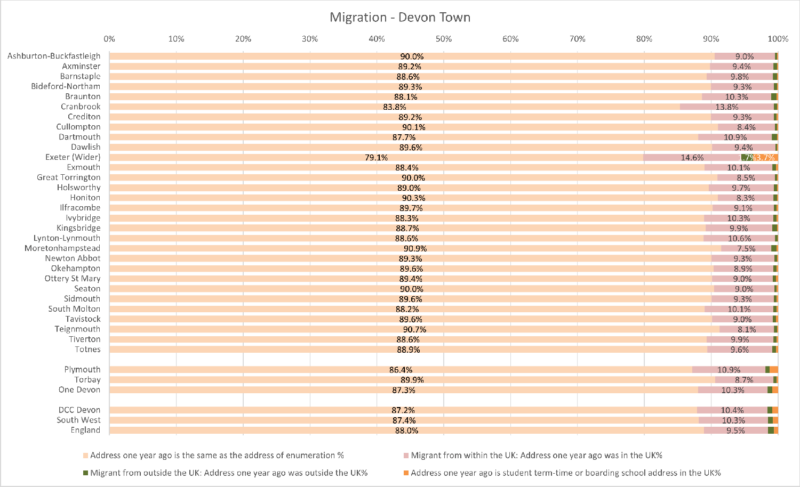
Most towns follow the SW and England comparisons fairly closely. Exeter (Wider) differs with more migrants from within UK, from Outside the UK and Students. Cranbrook has more migrants from within the UK.
Map 2.7 a) Migration from Within UK Within Last 12 Months by Output Area
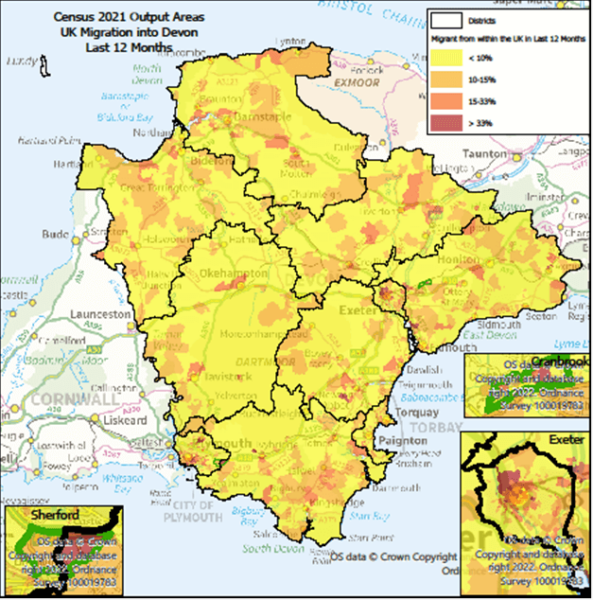
Exeter around the university seems the biggest area for internal UK migration with some other areas including Sherford and Cranbrook
Map 2.7 b) Migration from Outside UK Within Last 12 Months by Output Area
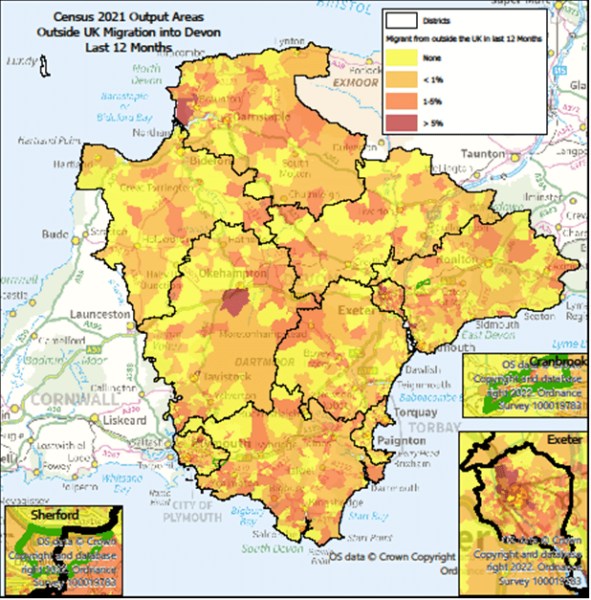
Exeter around the university seems the biggest area for outside the UK migration with some other areas including Okehampton and Braunton.
2.8 Country of birth
(ONS table TS004)
Table 2.8 a) Country of birth by District
| Area | United Kingdom | Older EU countries Incl Ireland, France, Germany etc | All Other EU Countries | All other non-EU countries | Africa | Middle East and Asia | The Americas and the Caribbean | Antarctica and Oceania | British Overseas | Usual Residents |
|---|---|---|---|---|---|---|---|---|---|---|
| East Devon | 141,530 | 2,315 | 1,947 | 450 | 1,361 | 1,874 | 840 | 490 | 24 | 150,831 |
| Exeter | 111,104 | 3,860 | 4,344 | 1,129 | 1,882 | 6,430 | 1,484 | 436 | 40 | 130,709 |
| Mid Devon | 77,676 | 1,078 | 1,846 | 210 | 679 | 768 | 368 | 215 | 10 | 82,850 |
| North Devon | 93,196 | 1,317 | 1,079 | 192 | 799 | 1,250 | 487 | 280 | 11 | 98,611 |
| South Hams | 83,086 | 1,557 | 738 | 252 | 862 | 1,063 | 692 | 349 | 28 | 88,627 |
| Teignbridge | 127,824 | 1,810 | 1,274 | 379 | 1,148 | 1,349 | 651 | 339 | 29 | 134,803 |
| Torridge | 65,384 | 780 | 507 | 132 | 423 | 464 | 264 | 146 | 14 | 68,114 |
| West Devon | 53,989 | 795 | 550 | 163 | 509 | 597 | 312 | 166 | 15 | 57,096 |
| Plymouth | 240,345 | 4,604 | 7,396 | 956 | 3,036 | 6,235 | 1,510 | 518 | 95 | 264,695 |
| Torbay | 129,424 | 2,212 | 2,881 | 488 | 1,113 | 2,282 | 624 | 271 | 26 | 139,321 |
| One Devon | 1,123,558 | 20,328 | 22,562 | 4,351 | 11,812 | 22,312 | 7,232 | 3,210 | 292 | 1,215,657 |
| DCC Devon | 753,789 | 13,512 | 12,285 | 2,907 | 7,663 | 13,795 | 5,098 | 2,421 | 171 | 811,641 |
| South West | 5,119,492 | 122,751 | 141,783 | 24,877 | 77,765 | 143,568 | 51,397 | 17,644 | 1,909 | 5,701,186 |
| England | 46,687,506 | 1,578,674 | 1,973,090 | 491,066 | 1,555,858 | 3,241,701 | 773,376 | 168,004 | 20,775 | 56,490,050 |
| Area | United Kingdom | Older EU countries Incl Ireland, France, Germany etc | All Other EU Countries | All other non-EU countries | Africa | Middle East and Asia | The Americas and the Caribbean | Antarctica and Oceania | British Overseas |
|---|---|---|---|---|---|---|---|---|---|
| East Devon | 93.8% | 1.5% | 1.3% | 0.3% | 0.9% | 1.2% | 0.6% | 0.3% | 0.0% |
| Exeter | 85.0% | 3.0% | 3.3% | 0.9% | 1.4% | 4.9% | 1.1% | 0.3% | 0.0% |
| Mid Devon | 93.8% | 1.3% | 2.2% | 0.3% | 0.8% | 0.9% | 0.4% | 0.3% | 0.0% |
| North Devon | 94.5% | 1.3% | 1.1% | 0.2% | 0.8% | 1.3% | 0.5% | 0.3% | 0.0% |
| South Hams | 93.7% | 1.8% | 0.8% | 0.3% | 1.0% | 1.2% | 0.8% | 0.4% | 0.0% |
| Teignbridge | 94.8% | 1.3% | 0.9% | 0.3% | 0.9% | 1.0% | 0.5% | 0.3% | 0.0% |
| Torridge | 96.0% | 1.1% | 0.7% | 0.2% | 0.6% | 0.7% | 0.4% | 0.2% | 0.0% |
| West Devon | 94.6% | 1.4% | 1.0% | 0.3% | 0.9% | 1.0% | 0.5% | 0.3% | 0.0% |
| DCC Devon | 92.9% | 1.7% | 1.5% | 0.4% | 0.9% | 1.7% | 0.6% | 0.3% | 0.0% |
| Plymouth | 90.8% | 1.7% | 2.8% | 0.4% | 1.1% | 2.4% | 0.6% | 0.2% | 0.0% |
| Torbay | 92.9% | 1.6% | 2.1% | 0.4% | 0.8% | 1.6% | 0.4% | 0.2% | 0.0% |
| One Devon | 92.4% | 1.7% | 1.9% | 0.4% | 1.0% | 1.8% | 0.6% | 0.3% | 0.0% |
| South West | 89.8% | 2.2% | 2.5% | 0.4% | 1.4% | 2.5% | 0.9% | 0.3% | 0.0% |
| England | 82.6% | 2.8% | 3.5% | 0.9% | 2.8% | 5.7% | 1.4% | 0.3% | 0.0% |
Figure 2.8 a) Country of birth by District
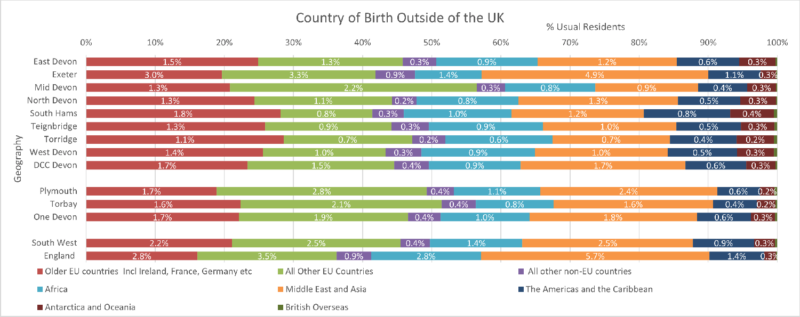
93% of DCC Devon area were born in the UK – of the rest 3.5% were from various parts of Europe, 1% Africa, 2% Middle East and Asia and 0.5% from the Americas and Caribbean.
3. Education
3.1 People in full-time education
(ONS Table TS068)
Table 3.1 a) People in full-time education by District
| Area | Student | Not a student | Does not apply (U5?) | Usual Residents | Student % | Not a student % | Does not apply U5 % |
|---|---|---|---|---|---|---|---|
| East Devon | 21,957 | 122,380 | 6,491 | 150,828 | 14.6% | 81.1% | 4.3% |
| Exeter | 35,774 | 89,049 | 5,884 | 130,707 | 27.4% | 68.1% | 4.5% |
| Mid Devon | 13,656 | 65,174 | 4,022 | 82,852 | 16.5% | 78.7% | 4.9% |
| North Devon | 15,381 | 78,718 | 4,512 | 98,611 | 15.6% | 79.8% | 4.6% |
| South Hams | 13,407 | 71,691 | 3,529 | 88,627 | 15.1% | 80.9% | 4.0% |
| Teignbridge | 20,107 | 108,790 | 5,906 | 134,803 | 14.9% | 80.7% | 4.4% |
| Torridge | 9,868 | 55,443 | 2,803 | 68,114 | 14.5% | 81.4% | 4.1% |
| West Devon | 8,556 | 46,344 | 2,196 | 57,096 | 15.0% | 81.2% | 3.8% |
| Plymouth | 54,709 | 196,781 | 13,205 | 264,695 | 20.7% | 74.3% | 5.0% |
| Torbay | 21,501 | 111,763 | 6,059 | 139,323 | 15.4% | 80.2% | 4.3% |
| One Devon | 214,916 | 946,133 | 54,607 | 1,215,656 | 17.7% | 77.8% | 4.5% |
| DCC Devon | 138,706 | 637,589 | 35,343 | 811,638 | 17.1% | 78.6% | 4.4% |
| South West | 1,014,579 | 4,412,161 | 274,446 | 5,701,186 | 17.8% | 77.4% | 4.8% |
| England | 10,920,505 | 42,492,593 | 3,076,951 | 56,490,049 | 19.3% | 75.2% | 5.4% |
Figure 3.1 a) People in full-time education by District

Most of Devon has a smaller than the SW and England figures for Students – the exceptions being Plymouth with 21% and Exeter with 27%
Table 3.1 b) People in full-time education by Devon Town
| Devon Town | Student | Not A Student | Does Not Apply (U5s) | Usual Residents | Student % | Not A Student % | Does Not Apply (U5s) % |
|---|---|---|---|---|---|---|---|
| Ashburton-Buckfastleigh | 1,278 | 6,168 | 349 | 7,795 | 16.4% | 79.1% | 4.5% |
| Axminster | 2,252 | 13,322 | 665 | 16,239 | 13.9% | 82.0% | 4.1% |
| Barnstaple | 7,612 | 38,204 | 2,492 | 48,308 | 15.8% | 79.1% | 5.2% |
| Bideford-Northam | 5,673 | 31,747 | 1,601 | 39,021 | 14.5% | 81.4% | 4.1% |
| Braunton | 2,162 | 9,734 | 528 | 12,424 | 17.4% | 78.3% | 4.2% |
| Cranbrook | 1,666 | 5,380 | 773 | 7,819 | 21.3% | 68.8% | 9.9% |
| Crediton | 3,534 | 17,509 | 1,026 | 22,069 | 16.0% | 79.3% | 4.6% |
| Cullompton | 4,319 | 19,835 | 1,323 | 25,477 | 17.0% | 77.9% | 5.2% |
| Dartmouth | 1,278 | 8,969 | 332 | 10,579 | 12.1% | 84.8% | 3.1% |
| Dawlish | 2,213 | 13,767 | 652 | 16,632 | 13.3% | 82.8% | 3.9% |
| Exeter (Wider) | 39,483 | 107,505 | 7,161 | 154,149 | 25.6% | 69.7% | 4.6% |
| Exmouth | 7,095 | 40,256 | 1,823 | 49,174 | 14.4% | 81.9% | 3.7% |
| Great Torrington | 1,524 | 8,927 | 464 | 10,915 | 14.0% | 81.8% | 4.3% |
| Holsworthy | 2,480 | 14,253 | 718 | 17,451 | 14.2% | 81.7% | 4.1% |
| Honiton | 2,636 | 15,615 | 816 | 19,067 | 13.8% | 81.9% | 4.3% |
| Ilfracombe | 2,656 | 13,748 | 628 | 17,032 | 15.6% | 80.7% | 3.7% |
| Ivybridge | 6,005 | 29,367 | 1,583 | 36,955 | 16.2% | 79.5% | 4.3% |
| Kingsbridge | 2,570 | 14,587 | 694 | 17,851 | 14.4% | 81.7% | 3.9% |
| Lynton-Lynmouth | 136 | 1,426 | 48 | 1,610 | 8.4% | 88.6% | 3.0% |
| Moretonhampstead | 619 | 3,557 | 151 | 4,327 | 14.3% | 82.2% | 3.5% |
| Newton Abbot | 11,644 | 60,545 | 3,549 | 75,738 | 15.4% | 79.9% | 4.7% |
| Okehampton | 4,347 | 22,825 | 1,159 | 28,331 | 15.3% | 80.6% | 4.1% |
| Ottery St Mary | 2,684 | 12,332 | 686 | 15,702 | 17.1% | 78.5% | 4.4% |
| Sidmouth | 2,053 | 14,101 | 524 | 16,678 | 12.3% | 84.5% | 3.1% |
| South Molton | 2,291 | 12,243 | 679 | 15,213 | 15.1% | 80.5% | 4.5% |
| Tavistock | 4,555 | 25,308 | 1,092 | 30,955 | 14.7% | 81.8% | 3.5% |
| Teignmouth | 2,589 | 15,521 | 694 | 18,804 | 13.8% | 82.5% | 3.7% |
| Tiverton | 6,441 | 31,061 | 1,824 | 39,326 | 16.4% | 79.0% | 4.6% |
| Totnes | 3,560 | 18,771 | 923 | 23,254 | 15.3% | 80.7% | 4.0% |
| Plymouth | 54,709 | 196,781 | 13,205 | 264,695 | 20.7% | 74.3% | 5.0% |
| Torbay | 21,501 | 111,763 | 6,059 | 139,323 | 15.4% | 80.2% | 4.3% |
| One Devon | 214,916 | 946,133 | 54,607 | 1,215,656 | 17.7% | 77.8% | 4.5% |
| DCC Devon | 137,355 | 626,583 | 34,957 | 798,895 | 17.2% | 78.4% | 4.4% |
| South West | 1,014,579 | 4,412,161 | 274,446 | 5,701,186 | 17.8% | 77.4% | 4.8% |
| England | 10,920,505 | 42,492,593 | 3,076,951 | 56,490,049 | 19.3% | 75.2% | 5.4% |
Figure 3.1 b) People in full-time education by Devon Town
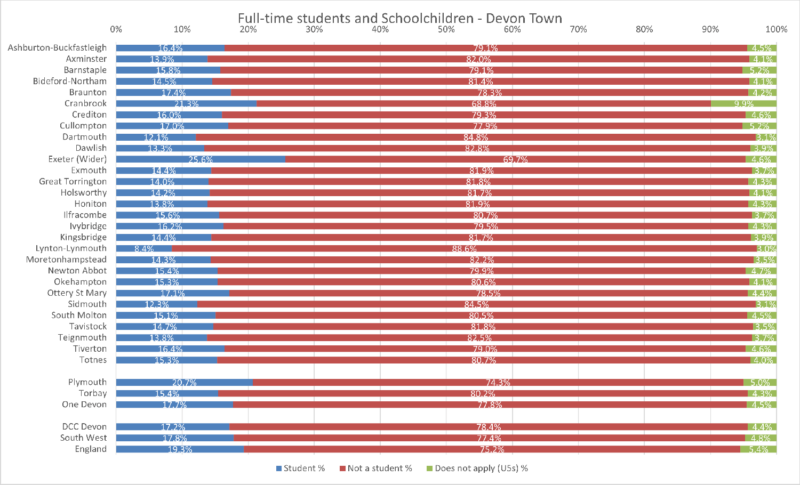
Most of the Devon Towns have smaller than the SW and England figures for Students – the exceptions being Plymouth with 21%, Cranbrook (21%) and Exeter (26%).
Map 3.1 a) People in full-time education by Output Area

Most students live closely to the universities in Plymouth and Exeter. There are two rural areas with high percentages, South Molton and the northern part of Exmouth (Bicton?).
3.2 Highest level of qualification
(ONS Table TS067)
Table 3.2a) Highest level of qualification by District
| District | Level 1 | Level 2 | Apprenticeship | Level 3 | Level 4 | Other Vocational | No qualifications | Does not apply | Total Usual Residents | |||||||
| East Devon | 12,642 | 19,010 | 8,200 | 21,727 | 43,113 | 3,474 | 19,208 | 23,437 | 150,811 | |||||||
| Exeter | 9,094 | 12,726 | 5,313 | 27,921 | 38,615 | 2,586 | 15,077 | 19,375 | 130,707 | |||||||
| Mid Devon | 6,966 | 10,547 | 4,121 | 12,262 | 20,931 | 1,766 | 11,618 | 14,641 | 82,852 | |||||||
| North Devon | 9,098 | 12,745 | 5,558 | 14,599 | 23,454 | 2,132 | 14,588 | 16,419 | 98,593 | |||||||
| South Hams | 6,331 | 10,127 | 4,392 | 12,678 | 29,878 | 1,840 | 9,729 | 13,672 | 88,647 | |||||||
| Teignbridge | 11,480 | 16,818 | 7,421 | 19,726 | 37,166 | 3,083 | 17,764 | 21,342 | 134,800 | |||||||
| Torridge | 6,636 | 9,077 | 4,205 | 10,142 | 15,057 | 1,628 | 10,822 | 10,556 | 68,123 | |||||||
| West Devon | 4,859 | 7,080 | 3,050 | 8,120 | 16,471 | 1,256 | 7,528 | 8,736 | 57,100 | |||||||
| Plymouth | 21,397 | 30,721 | 15,841 | 47,369 | 60,151 | 5,262 | 37,900 | 46,077 | 264,718 | |||||||
| Torbay | 13,696 | 18,094 | 8,689 | 20,221 | 29,623 | 3,555 | 23,140 | 22,290 | 139,308 | |||||||
| One Devon | 102,199 | 146,945 | 66,790 | 194,765 | 314,459 | 26,582 | 167,374 | 196,545 | 1,215,659 | |||||||
| DCC Devon | 67,106 | 98,130 | 42,260 | 127,175 | 224,685 | 17,765 | 106,334 | 128,178 | 811,633 | |||||||
| South West | 465,970 | 678,280 | 283,597 | 876,607 | 1,566,774 | 123,429 | 741,183 | 965,346 | 5,701,186 | |||||||
| England | 4,679,223 | 6,493,487 | 2,590,252 | 8,225,629 | 16,413,231 | 1,337,076 | 8,827,469 | 11,031,169 | 59,597,536 | |||||||
| District | Level 1 | Level 2 | Apprenticeship | Level 3 | Level 4 | Other Vocational | No qualifications | |||||||||
| East Devon | 8.4% | 12.6% | 5.4% | 14.4% | 28.6% | 2.3% | 12.7% | |||||||||
| Exeter | 7.0% | 9.7% | 4.1% | 21.4% | 29.5% | 2.0% | 11.5% | |||||||||
| Mid Devon | 8.4% | 12.7% | 5.0% | 14.8% | 25.3% | 2.1% | 14.0% | |||||||||
| North Devon | 9.2% | 12.9% | 5.6% | 14.8% | 23.8% | 2.2% | 14.8% | |||||||||
| South Hams | 7.1% | 11.4% | 5.0% | 14.3% | 33.7% | 2.1% | 11.0% | |||||||||
| Teignbridge | 8.5% | 12.5% | 5.5% | 14.6% | 27.6% | 2.3% | 13.2% | |||||||||
| Torridge | 9.7% | 13.3% | 6.2% | 14.9% | 22.1% | 2.4% | 15.9% | |||||||||
| West Devon | 8.5% | 12.4% | 5.3% | 14.2% | 28.8% | 2.2% | 13.2% | |||||||||
| Plymouth | 8.1% | 11.6% | 6.0% | 17.9% | 22.7% | 2.0% | 14.3% | |||||||||
| Torbay | 9.8% | 13.0% | 6.2% | 14.5% | 21.3% | 2.6% | 16.6% | |||||||||
| One Devon | 8.4% | 12.1% | 5.5% | 16.0% | 25.9% | 2.2% | 13.8% | |||||||||
| DCC Devon | 8.3% | 12.1% | 5.2% | 15.7% | 27.7% | 2.2% | 13.1% | |||||||||
| South West | 8.2% | 11.9% | 5.0% | 15.4% | 27.5% | 2.2% | 13.0% | |||||||||
| England | 7.9% | 10.9% | 4.3% | 13.8% | 27.5% | 2.2% | 14.8% | |||||||||
| Level 1 | Level 1 and entry level qualifications: 1 to 4 GCSEs grade A* to C , Any GCSEs at other grades, O levels or CSEs (any grades), 1 AS level, NVQ level 1, Foundation GNVQ, Basic or Essential Skills |
| Level 2 | Level 2 qualifications: 5 or more GCSEs (A* to C or 9 to 4), O levels (passes), CSEs (grade 1), School Certification, 1 A level, 2 to 3 AS levels, VCEs, Intermediate or Higher Diploma, Welsh Baccalaureate Intermediate Diploma, NVQ level 2, Intermediate GNVQ, City and Guilds Craft, BTEC First or General Diploma, RSA Diploma |
| Level 3 | Level 3 qualifications: 2 or more A levels or VCEs, 4 or more AS levels, Higher School Certificate, Progression or Advanced Diploma, Welsh Baccalaureate Advance Diploma, NVQ level 3; Advanced GNVQ, City and Guilds Advanced Craft, ONC, OND, BTEC National, RSA Advanced Diploma |
| Level 4 | Level 4 qualifications and above: degree (BA, BSc), higher degree (MA, PhD, PGCE), NVQ level 4 to 5, HNC, HND, RSA Higher Diploma, BTEC Higher level, professional qualifications (for example, teaching, nursing, accountancy) |
Figure 3.2a) Highest level of qualification by District
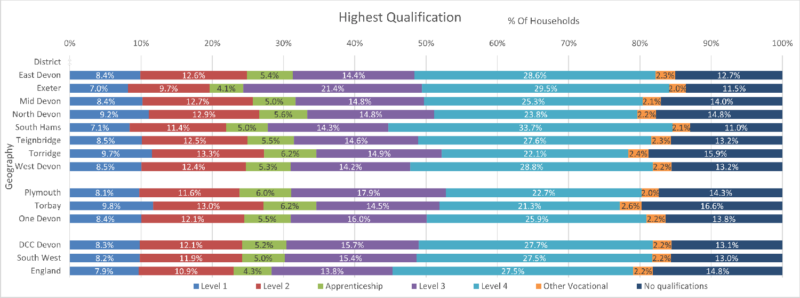
With the exceptions of Exeter, all Devon areas have higher percentages of apprentices than the English figure. In the top two levels of Qualifications several districts are worse than the English average of 41.3% – Torridge 37%, Torbay 37.1%, North Devon 38.5% and Mid Devon 40.1%. Two have better percentages – Exeter 51% and South Hams 48%. Those same two districts have the lowest percentages with no qualifications – the worst districts being Torridge 16% and Torbay 17% compared to the English figure of 15%.
Table 3.2b) Highest level of qualification by Devon Town
| Devon Town | Level 1 | Level 2 | Apprenticeship | Level 3 | Level 4 | Other Qual | No Qualifications | Does Not Apply | Usual Residents |
|---|---|---|---|---|---|---|---|---|---|
| Ashburton-Buckfastleigh | 601 | 856 | 373 | 1,021 | 2,370 | 155 | 1,090 | 1,324 | 7,790 |
| Axminster | 1,430 | 2,072 | 898 | 2,322 | 4,512 | 402 | 2,180 | 2,424 | 16,240 |
| Barnstaple | 4,443 | 6,261 | 2,674 | 7,154 | 10,975 | 986 | 7,363 | 8,441 | 48,297 |
| Bideford-Northam | 3,715 | 5,080 | 2,478 | 5,789 | 8,960 | 925 | 6,028 | 6,051 | 39,026 |
| Braunton | 962 | 1,493 | 728 | 1,900 | 3,362 | 289 | 1,503 | 2,184 | 12,421 |
| Cranbrook | 526 | 915 | 292 | 1,344 | 2,031 | 74 | 489 | 2,150 | 7,821 |
| Crediton | 1,882 | 2,727 | 1,104 | 3,165 | 5,972 | 448 | 3,016 | 3,762 | 22,076 |
| Cullompton | 2,140 | 3,292 | 1,186 | 3,899 | 6,314 | 543 | 3,365 | 4,732 | 25,471 |
| Dartmouth | 854 | 1,233 | 591 | 1,498 | 3,428 | 330 | 1,375 | 1,271 | 10,580 |
| Dawlish | 1,617 | 2,092 | 1,031 | 2,434 | 4,190 | 422 | 2,507 | 2,346 | 16,639 |
| Exeter (Wider) | 10,753 | 15,497 | 6,428 | 31,285 | 46,023 | 2,997 | 17,660 | 23,488 | 154,131 |
| Exmouth | 4,179 | 6,325 | 2,656 | 7,108 | 14,002 | 1,228 | 6,427 | 7,245 | 49,170 |
| Great Torrington | 1,078 | 1,407 | 632 | 1,677 | 2,464 | 257 | 1,726 | 1,675 | 10,916 |
| Holsworthy | 1,704 | 2,432 | 1,061 | 2,580 | 3,644 | 439 | 2,936 | 2,661 | 17,457 |
| Honiton | 1,751 | 2,414 | 1,168 | 2,737 | 4,639 | 456 | 3,037 | 2,859 | 19,061 |
| Ilfracombe | 1,745 | 2,196 | 1,011 | 2,422 | 3,956 | 408 | 2,636 | 2,655 | 17,029 |
| Ivybridge | 2,569 | 4,263 | 1,862 | 5,571 | 12,071 | 705 | 3,707 | 6,208 | 36,956 |
| Kingsbridge | 1,358 | 2,244 | 978 | 2,577 | 5,463 | 376 | 2,209 | 2,648 | 17,853 |
| Lynton-Lynmouth | 154 | 203 | 97 | 242 | 494 | 28 | 237 | 155 | 1,610 |
| Moretonhampstead | 284 | 463 | 195 | 632 | 1,591 | 90 | 445 | 630 | 4,330 |
| Newton Abbot | 6,574 | 9,725 | 4,187 | 11,364 | 19,837 | 1,675 | 9,862 | 12,519 | 75,743 |
| Okehampton | 2,709 | 3,641 | 1,432 | 4,107 | 7,258 | 602 | 4,030 | 4,554 | 28,333 |
| Ottery St Mary | 1,172 | 1,860 | 747 | 2,241 | 4,956 | 293 | 1,667 | 2,763 | 15,699 |
| Seaton | 1,213 | 1,575 | 867 | 1,774 | 3,507 | 360 | 2,018 | 1,444 | 12,758 |
| Sidmouth | 1,418 | 2,216 | 959 | 2,252 | 5,293 | 444 | 2,059 | 2,037 | 16,678 |
| South Molton | 1,477 | 2,085 | 831 | 2,288 | 3,580 | 310 | 2,211 | 2,427 | 15,209 |
| Tavistock | 2,390 | 3,758 | 1,735 | 4,327 | 9,709 | 701 | 3,821 | 4,517 | 30,958 |
| Teignmouth | 1,588 | 2,359 | 1,073 | 2,665 | 5,448 | 515 | 2,485 | 2,673 | 18,806 |
| Tiverton | 3,270 | 5,059 | 2,025 | 5,768 | 9,720 | 878 | 5,807 | 6,790 | 39,317 |
| Totnes | 1,550 | 2,387 | 961 | 3,032 | 8,916 | 429 | 2,438 | 3,545 | 23,258 |
| Plymouth | 21,397 | 30,721 | 15,841 | 47,369 | 60,151 | 5,262 | 37,900 | 46,077 | 264,718 |
| Torbay | 13,696 | 18,094 | 8,689 | 20,221 | 29,623 | 3,555 | 23,140 | 22,290 | 139,308 |
| One Devon | 102,199 | 146,945 | 66,790 | 194,765 | 314,459 | 26,582 | 167,374 | 196,545 | 1,215,659 |
| Devon CC Area | 67,106 | 98,130 | 42,260 | 127,175 | 224,685 | 17,765 | 106,334 | 128,178 | 811,633 |
| South West | 465,970 | 678,280 | 283,597 | 876,607 | 1,566,774 | 123,429 | 741,183 | 965,346 | 5,701,186 |
| England | 4,679,223 | 6,493,487 | 2,590,252 | 8,225,629 | 16,413,231 | 1,337,076 | 8,827,469 | 11,031,169 | 59,597,536 |
| Devon Town | Level 1 | Level 2 | Apprenticeship | Level 3 | Level 4 | Other Vocational | No qualifications |
|---|---|---|---|---|---|---|---|
| Ashburton-Buckfastleigh | 7.7% | 11.0% | 4.8% | 13.1% | 30.4% | 2.0% | 14.0% |
| Axminster | 8.8% | 12.8% | 5.5% | 14.3% | 27.8% | 2.5% | 13.4% |
| Barnstaple | 9.2% | 13.0% | 5.5% | 14.8% | 22.7% | 2.0% | 15.2% |
| Bideford-Northam | 9.5% | 13.0% | 6.3% | 14.8% | 23.0% | 2.4% | 15.4% |
| Braunton | 7.7% | 12.0% | 5.9% | 15.3% | 27.1% | 2.3% | 12.1% |
| Cranbrook | 6.7% | 11.7% | 3.7% | 17.2% | 26.0% | 0.9% | 6.3% |
| Crediton | 8.5% | 12.4% | 5.0% | 14.3% | 27.1% | 2.0% | 13.7% |
| Cullompton | 8.4% | 12.9% | 4.7% | 15.3% | 24.8% | 2.1% | 13.2% |
| Dartmouth | 8.1% | 11.7% | 5.6% | 14.2% | 32.4% | 3.1% | 13.0% |
| Dawlish | 9.7% | 12.6% | 6.2% | 14.6% | 25.2% | 2.5% | 15.1% |
| Exeter (Wider) | 7.0% | 10.1% | 4.2% | 20.3% | 29.9% | 1.9% | 11.5% |
| Exmouth | 8.5% | 12.9% | 5.4% | 14.5% | 28.5% | 2.5% | 13.1% |
| Great Torrington | 9.9% | 12.9% | 5.8% | 15.4% | 22.6% | 2.4% | 15.8% |
| Holsworthy | 9.8% | 13.9% | 6.1% | 14.8% | 20.9% | 2.5% | 16.8% |
| Honiton | 9.2% | 12.7% | 6.1% | 14.4% | 24.3% | 2.4% | 15.9% |
| Ilfracombe | 10.2% | 12.9% | 5.9% | 14.2% | 23.2% | 2.4% | 15.5% |
| Ivybridge | 7.0% | 11.5% | 5.0% | 15.1% | 32.7% | 1.9% | 10.0% |
| Kingsbridge | 7.6% | 12.6% | 5.5% | 14.4% | 30.6% | 2.1% | 12.4% |
| Lynton-Lynmouth | 9.6% | 12.6% | 6.0% | 15.0% | 30.7% | 1.7% | 14.7% |
| Moretonhampstead | 6.6% | 10.7% | 4.5% | 14.6% | 36.7% | 2.1% | 10.3% |
| Newton Abbot | 8.7% | 12.8% | 5.5% | 15.0% | 26.2% | 2.2% | 13.0% |
| Okehampton | 9.6% | 12.9% | 5.1% | 14.5% | 25.6% | 2.1% | 14.2% |
| Ottery St Mary | 7.5% | 11.8% | 4.8% | 14.3% | 31.6% | 1.9% | 10.6% |
| Seaton | 9.5% | 12.3% | 6.8% | 13.9% | 27.5% | 2.8% | 15.8% |
| Sidmouth | 8.5% | 13.3% | 5.8% | 13.5% | 31.7% | 2.7% | 12.3% |
| South Molton | 9.7% | 13.7% | 5.5% | 15.0% | 23.5% | 2.0% | 14.5% |
| Tavistock | 7.7% | 12.1% | 5.6% | 14.0% | 31.4% | 2.3% | 12.3% |
| Teignmouth | 8.4% | 12.5% | 5.7% | 14.2% | 29.0% | 2.7% | 13.2% |
| Tiverton | 8.3% | 12.9% | 5.2% | 14.7% | 24.7% | 2.2% | 14.8% |
| Totnes | 6.7% | 10.3% | 4.1% | 13.0% | 38.3% | 1.8% | 10.5% |
| Plymouth | 8.1% | 11.6% | 6.0% | 17.9% | 22.7% | 2.0% | 14.3% |
| Torbay | 9.8% | 13.0% | 6.2% | 14.5% | 21.3% | 2.6% | 16.6% |
| One Devon | 8.4% | 12.1% | 5.5% | 16.0% | 25.9% | 2.2% | 13.8% |
| Devon CC Area | 8.3% | 12.1% | 5.2% | 15.7% | 27.7% | 2.2% | 13.1% |
| South West | 8.2% | 11.9% | 5.0% | 15.4% | 27.5% | 2.2% | 13.0% |
| England | 7.9% | 10.9% | 4.3% | 13.8% | 27.5% | 2.2% | 14.8% |
Figure 3.2b) Highest level of qualification by Devon Town

Three towns have comparatively high percentages with No Qualifications – Holsworthy (17%), Honiton (16%) and Seaton (16%) – Towns with low percentages are Cranbrook (6%), Ivybridge (10%), Moretonhampstead (10%) and Ottery St Mary (11%).
Map 3.2 c) Map showing no qualifications by output area
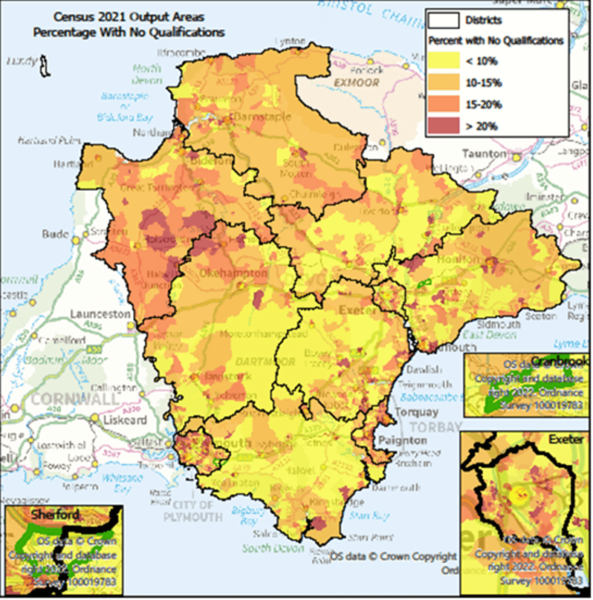
Torridge (with bordering West Devon) appears to stand out with several areas with high percentages with no qualifications. There are also other localised urban areas with some no qualification areas.
4. Identity
4.1 Ethnic group
(ONS Table TS021)
Table 4.1 a) Broad Ethnic Groups by District
| Asian | Black | Mixed | Other | White | Usual Residents | Asian% | Black% | Mixed% | Other% | White % | |
|---|---|---|---|---|---|---|---|---|---|---|---|
| East Devon | 1,452 | 349 | 1,730 | 449 | 146,853 | 150,833 | 1.0% | 0.2% | 1.1% | 0.3% | 97.4% |
| Exeter | 6,385 | 1,134 | 3,314 | 1,842 | 118,030 | 130,705 | 4.9% | 0.9% | 2.5% | 1.4% | 90.3% |
| Mid Devon | 558 | 100 | 912 | 223 | 81,067 | 82,860 | 0.7% | 0.1% | 1.1% | 0.3% | 97.8% |
| North Devon | 1,132 | 327 | 1,169 | 338 | 95,640 | 98,606 | 1.1% | 0.3% | 1.2% | 0.3% | 97.0% |
| South Hams | 612 | 148 | 1,042 | 392 | 86,425 | 88,619 | 0.7% | 0.2% | 1.2% | 0.4% | 97.5% |
| Teignbridge | 1,005 | 217 | 1,560 | 345 | 131,663 | 134,790 | 0.7% | 0.2% | 1.2% | 0.3% | 97.7% |
| Torridge | 356 | 75 | 634 | 132 | 66,923 | 68,120 | 0.5% | 0.1% | 0.9% | 0.2% | 98.2% |
| West Devon | 330 | 124 | 619 | 159 | 55,843 | 57,075 | 0.6% | 0.2% | 1.1% | 0.3% | 97.8% |
| Plymouth | 5,962 | 2,783 | 4,668 | 2,579 | 248,726 | 264,718 | 2.3% | 1.1% | 1.8% | 1.0% | 94.0% |
| Torbay | 2,255 | 444 | 2,079 | 615 | 133,916 | 139,309 | 1.6% | 0.3% | 1.5% | 0.4% | 96.1% |
| One Devon | 20,047 | 5,701 | 17,727 | 7,074 | 1,165,086 | 1,215,635 | 1.6% | 0.5% | 1.5% | 0.6% | 95.8% |
| DCC Devon | 11,830 | 2,474 | 10,980 | 3,880 | 782,444 | 811,608 | 1.5% | 0.3% | 1.4% | 0.5% | 96.4% |
| South West | 159,184 | 69,614 | 114,074 | 48,706 | 5,309,608 | 5,701,186 | 2.8% | 1.2% | 2.0% | 0.9% | 93.1% |
| England | 5,426,392 | 2,381,724 | 1,669,378 | 1,229,153 | 45,783,401 | 56,490,048 | 9.6% | 4.2% | 3.0% | 2.2% | 81.0% |
Figure 4.1 a) Broad Ethnic Groups by District

DCC Devon is 96.4% White compared to the England figure of 81%. Only Exeter is different with 90% white and 5% Asian and 2.5% Mixed.
Table 4.1 b) Detailed Ethnic Groups by District
| Area | Asian – Bangladeshi | Asian – Chinese | Asian – Indian | Asian – Other | Asian – Pakistani | Black – African | Black – Caribbean | Black – Other | Mixed – Other | Mixed – White and Asian | Mixed -White and Black African | Mixed – White and Black Caribbean | Other – Any | Other – Arab | White – British | White – Gypsy or Irish Traveller | White – Irish | White – Other | White – Roma | Usual Residents |
|---|---|---|---|---|---|---|---|---|---|---|---|---|---|---|---|---|---|---|---|---|
| East Devon | 178 | 304 | 272 | 670 | 28 | 203 | 99 | 47 | 489 | 628 | 222 | 391 | 360 | 89 | 142,015 | 146 | 714 | 3,922 | 56 | 150,833 |
| Exeter | 516 | 2,017 | 1,583 | 1,988 | 281 | 890 | 139 | 105 | 1,019 | 1,305 | 479 | 511 | 1,043 | 799 | 108,095 | 98 | 873 | 8,790 | 174 | 130,705 |
| Mid Devon | 22 | 185 | 166 | 172 | 13 | 62 | 22 | 16 | 269 | 322 | 126 | 195 | 189 | 34 | 77,695 | 144 | 327 | 2,853 | 48 | 82,860 |
| North Devon | 88 | 190 | 323 | 442 | 89 | 179 | 83 | 65 | 324 | 415 | 134 | 296 | 256 | 82 | 92,943 | 57 | 388 | 2,194 | 58 | 98,606 |
| South Hams | 34 | 159 | 174 | 210 | 35 | 70 | 61 | 17 | 316 | 410 | 105 | 211 | 243 | 149 | 83,487 | 80 | 453 | 2,353 | 52 | 88,619 |
| Teignbridge | 111 | 256 | 186 | 418 | 34 | 136 | 52 | 29 | 492 | 565 | 189 | 314 | 280 | 65 | 127,939 | 133 | 570 | 2,981 | 40 | 134,790 |
| Torridge | 12 | 107 | 65 | 158 | 14 | 31 | 31 | 13 | 169 | 251 | 66 | 148 | 113 | 19 | 65,452 | 55 | 288 | 1,111 | 17 | 68,120 |
| West Devon | 18 | 98 | 66 | 138 | 10 | 68 | 27 | 29 | 223 | 219 | 63 | 114 | 116 | 43 | 54,193 | 38 | 274 | 1,303 | 35 | 57,075 |
| Plymouth | 542 | 1,428 | 1,403 | 2,199 | 390 | 2,023 | 462 | 298 | 1,341 | 1,353 | 863 | 1,111 | 1,903 | 676 | 236,802 | 168 | 1,050 | 10,540 | 166 | 264,718 |
| Torbay | 128 | 432 | 526 | 1,004 | 165 | 264 | 133 | 47 | 536 | 671 | 293 | 579 | 481 | 134 | 128,372 | 40 | 715 | 4,711 | 78 | 139,309 |
| One Devon | 1,649 | 5,176 | 4,764 | 7,399 | 1,059 | 3,926 | 1,109 | 666 | 5,178 | 6,139 | 2,540 | 3,870 | 4,984 | 2,090 | 1,116,993 | 959 | 5,652 | 40,758 | 724 | 1,215,635 |
| DCC Devon | 979 | 3,316 | 2,835 | 4,196 | 504 | 1,639 | 514 | 321 | 3,301 | 4,115 | 1,384 | 2,180 | 2,600 | 1,280 | 751,819 | 751 | 3,887 | 25,507 | 480 | 811,608 |
| South West | 12,217 | 26,516 | 58,847 | 44,172 | 17,432 | 43,318 | 17,226 | 9,070 | 30,253 | 34,960 | 15,644 | 33,217 | 38,404 | 10,302 | 5,008,149 | 6,382 | 31,698 | 257,594 | 5,785 | 5,701,186 |
| England | 629,567 | 431,165 | 1,843,248 | 952,127 | 1,570,285 | 1,468,474 | 619,419 | 293,831 | 454,350 | 474,190 | 241,528 | 499,310 | 908,950 | 320,203 | ######## | 64,218 | 494,251 | 3,585,003 | 99,138 | ######## |
| Area | Asian – Bangladeshi | Asian – Chinese | Asian – Indian | Asian – Other | Asian – Pakistani | Black – African | Black – Caribbean | Black – Other | Mixed – Other | Mixed – White and Asian | Mixed -White and Black African | Mixed – White and Black Caribbean | Other – Any | Other – Arab | White – British | White – Gypsy or Irish Traveller | White – Irish | White – Other | White – Roma |
|---|---|---|---|---|---|---|---|---|---|---|---|---|---|---|---|---|---|---|---|
| East Devon | 0.1% | 0.2% | 0.2% | 0.4% | 0.0% | 0.1% | 0.1% | 0.0% | 0.3% | 0.4% | 0.1% | 0.3% | 0.2% | 0.1% | 94.2% | 0.1% | 0.5% | 2.6% | 0.0% |
| Exeter | 0.4% | 1.5% | 1.2% | 1.5% | 0.2% | 0.7% | 0.1% | 0.1% | 0.8% | 1.0% | 0.4% | 0.4% | 0.8% | 0.6% | 82.7% | 0.1% | 0.7% | 6.7% | 0.1% |
| Mid Devon | 0.0% | 0.2% | 0.2% | 0.2% | 0.0% | 0.1% | 0.0% | 0.0% | 0.3% | 0.4% | 0.2% | 0.2% | 0.2% | 0.0% | 93.8% | 0.2% | 0.4% | 3.4% | 0.1% |
| North Devon | 0.1% | 0.2% | 0.3% | 0.4% | 0.1% | 0.2% | 0.1% | 0.1% | 0.3% | 0.4% | 0.1% | 0.3% | 0.3% | 0.1% | 94.3% | 0.1% | 0.4% | 2.2% | 0.1% |
| South Hams | 0.0% | 0.2% | 0.2% | 0.2% | 0.0% | 0.1% | 0.1% | 0.0% | 0.4% | 0.5% | 0.1% | 0.2% | 0.3% | 0.2% | 94.2% | 0.1% | 0.5% | 2.7% | 0.1% |
| Teignbridge | 0.1% | 0.2% | 0.1% | 0.3% | 0.0% | 0.1% | 0.0% | 0.0% | 0.4% | 0.4% | 0.1% | 0.2% | 0.2% | 0.0% | 94.9% | 0.1% | 0.4% | 2.2% | 0.0% |
| Torridge | 0.0% | 0.2% | 0.1% | 0.2% | 0.0% | 0.0% | 0.0% | 0.0% | 0.2% | 0.4% | 0.1% | 0.2% | 0.2% | 0.0% | 96.1% | 0.1% | 0.4% | 1.6% | 0.0% |
| West Devon | 0.0% | 0.2% | 0.1% | 0.2% | 0.0% | 0.1% | 0.0% | 0.1% | 0.4% | 0.4% | 0.1% | 0.2% | 0.2% | 0.1% | 95.0% | 0.1% | 0.5% | 2.3% | 0.1% |
| Plymouth | 0.2% | 0.5% | 0.5% | 0.8% | 0.1% | 0.8% | 0.2% | 0.1% | 0.5% | 0.5% | 0.3% | 0.4% | 0.7% | 0.3% | 89.5% | 0.1% | 0.4% | 4.0% | 0.1% |
| Torbay | 0.1% | 0.3% | 0.4% | 0.7% | 0.1% | 0.2% | 0.1% | 0.0% | 0.4% | 0.5% | 0.2% | 0.4% | 0.3% | 0.1% | 92.1% | 0.0% | 0.5% | 3.4% | 0.1% |
| One Devon | 0.1% | 0.4% | 0.4% | 0.6% | 0.1% | 0.3% | 0.1% | 0.1% | 0.4% | 0.5% | 0.2% | 0.3% | 0.4% | 0.2% | 91.9% | 0.1% | 0.5% | 3.4% | 0.1% |
| DCC Devon | 0.1% | 0.4% | 0.3% | 0.5% | 0.1% | 0.2% | 0.1% | 0.0% | 0.4% | 0.5% | 0.2% | 0.3% | 0.3% | 0.2% | 92.6% | 0.1% | 0.5% | 3.1% | 0.1% |
| South West | 0.2% | 0.5% | 1.0% | 0.8% | 0.3% | 0.8% | 0.3% | 0.2% | 0.5% | 0.6% | 0.3% | 0.6% | 0.7% | 0.2% | 87.8% | 0.1% | 0.6% | 4.5% | 0.1% |
| England | 1.1% | 0.8% | 3.3% | 1.7% | 2.8% | 2.6% | 1.1% | 0.5% | 0.8% | 0.8% | 0.4% | 0.9% | 1.6% | 0.6% | 73.5% | 0.1% | 0.9% | 6.3% | 0.2% |
Figure 4.1 b) Detailed Ethnic Groups by District

Most of the diverse ethnic groups are based in Plymouth and Exeter.
Table 4.1 c) Broad Ethnic Groups by Devon Town
| Devon Town | Asian | Black | Mixed | Other | White | Asian % | Black % | Mixed % | Other % | White % |
|---|---|---|---|---|---|---|---|---|---|---|
| Ashburton-Buckfastleigh | 49 | 10 | 144 | 19 | 7,571 | 0.6% | 0.1% | 1.8% | 0.2% | 97.2% |
| Axminster | 165 | 18 | 182 | 40 | 15,835 | 1.0% | 0.1% | 1.1% | 0.2% | 97.5% |
| Barnstaple | 735 | 169 | 575 | 162 | 46,667 | 1.5% | 0.3% | 1.2% | 0.3% | 96.6% |
| Bideford-Northam | 231 | 48 | 418 | 99 | 38,233 | 0.6% | 0.1% | 1.1% | 0.3% | 98.0% |
| Braunton | 152 | 78 | 191 | 69 | 11,934 | 1.2% | 0.6% | 1.5% | 0.6% | 96.1% |
| Cranbrook | 76 | 40 | 149 | 46 | 7,504 | 1.0% | 0.5% | 1.9% | 0.6% | 96.0% |
| Crediton | 130 | 34 | 248 | 70 | 21,586 | 0.6% | 0.2% | 1.1% | 0.3% | 97.8% |
| Cullompton | 198 | 34 | 286 | 67 | 24,893 | 0.8% | 0.1% | 1.1% | 0.3% | 97.7% |
| Dartmouth | 81 | 30 | 96 | 126 | 10,243 | 0.8% | 0.3% | 0.9% | 1.2% | 96.9% |
| Dawlish | 125 | 12 | 156 | 39 | 16,300 | 0.8% | 0.1% | 0.9% | 0.2% | 98.0% |
| Exeter (Wider) | 6,611 | 1,190 | 3,642 | 1,924 | 140,772 | 4.3% | 0.8% | 2.4% | 1.2% | 91.3% |
| Exmouth | 429 | 115 | 504 | 117 | 48,010 | 0.9% | 0.2% | 1.0% | 0.2% | 97.6% |
| Great Torrington | 37 | 8 | 75 | 14 | 10,779 | 0.3% | 0.1% | 0.7% | 0.1% | 98.8% |
| Holsworthy | 90 | 18 | 121 | 26 | 17,200 | 0.5% | 0.1% | 0.7% | 0.1% | 98.5% |
| Honiton | 142 | 45 | 217 | 47 | 18,621 | 0.7% | 0.2% | 1.1% | 0.2% | 97.6% |
| Ilfracombe | 83 | 31 | 203 | 48 | 16,667 | 0.5% | 0.2% | 1.2% | 0.3% | 97.9% |
| Ivybridge | 240 | 42 | 346 | 109 | 36,203 | 0.6% | 0.1% | 0.9% | 0.3% | 98.0% |
| Kingsbridge | 85 | 29 | 151 | 48 | 17,535 | 0.5% | 0.2% | 0.8% | 0.3% | 98.2% |
| Lynton-Lynmouth | 7 | 2 | 20 | 4 | 1,573 | 0.4% | 0.1% | 1.2% | 0.2% | 97.9% |
| Moretonhampstead | 25 | 3 | 48 | 10 | 4,235 | 0.6% | 0.1% | 1.1% | 0.2% | 98.0% |
| Newton Abbot | 559 | 146 | 854 | 189 | 74,003 | 0.7% | 0.2% | 1.1% | 0.2% | 97.7% |
| Okehampton | 168 | 62 | 332 | 92 | 27,674 | 0.6% | 0.2% | 1.2% | 0.3% | 97.7% |
| Ottery St Mary | 107 | 28 | 182 | 45 | 15,336 | 0.7% | 0.2% | 1.2% | 0.3% | 97.7% |
| Seaton | 173 | 31 | 111 | 41 | 12,406 | 1.4% | 0.2% | 0.9% | 0.3% | 97.2% |
| Sidmouth | 201 | 30 | 189 | 59 | 16,200 | 1.2% | 0.2% | 1.1% | 0.4% | 97.1% |
| South Molton | 131 | 46 | 160 | 44 | 14,828 | 0.9% | 0.3% | 1.1% | 0.3% | 97.5% |
| Tavistock | 170 | 63 | 312 | 67 | 30,325 | 0.5% | 0.2% | 1.0% | 0.2% | 98.0% |
| Teignmouth | 169 | 30 | 223 | 58 | 18,321 | 0.9% | 0.2% | 1.2% | 0.3% | 97.4% |
| Tiverton | 255 | 35 | 396 | 92 | 38,546 | 0.6% | 0.1% | 1.0% | 0.2% | 98.0% |
| Totnes | 206 | 47 | 449 | 109 | 22,444 | 0.9% | 0.2% | 1.9% | 0.5% | 96.5% |
| Plymouth | 5,962 | 2,783 | 4,668 | 2,579 | 248,726 | 2.3% | 1.1% | 1.8% | 1.0% | 94.0% |
| Torbay | 2,255 | 444 | 2,079 | 615 | 133,916 | 1.6% | 0.3% | 1.5% | 0.4% | 96.1% |
| One Devon | 20,047 | 5,701 | 17,727 | 7,074 | 1,165,086 | 1.6% | 0.5% | 1.5% | 0.6% | 95.8% |
| Devon CC Area | 11,830 | 2,474 | 10,980 | 3,880 | 782,444 | 1.5% | 0.3% | 1.4% | 0.5% | 96.4% |
| South West | 159,184 | 69,614 | 114,074 | 48,706 | 5,309,608 | 2.8% | 1.2% | 2.0% | 0.9% | 93.1% |
| England | 5,426,392 | 2,381,724 | 1,669,378 | 1,229,153 | 45,783,401 | 9.6% | 4.2% | 3.0% | 2.2% | 81.0% |
Figure 4.1 c) Broad Ethnic Groups by Devon Town
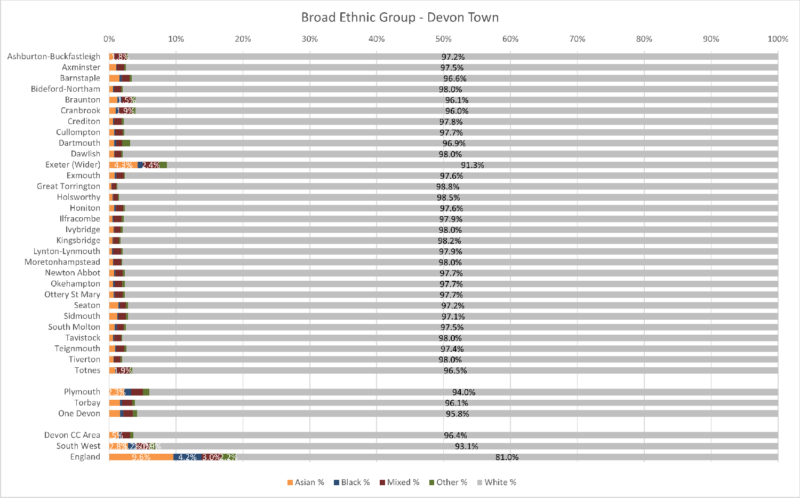
Exeter (Wider) is the most diverse Devon Town though some Devon Towns have notable percentages of Mixed Race.
Map 4.1 d) Distribution of Asian People by Output Area
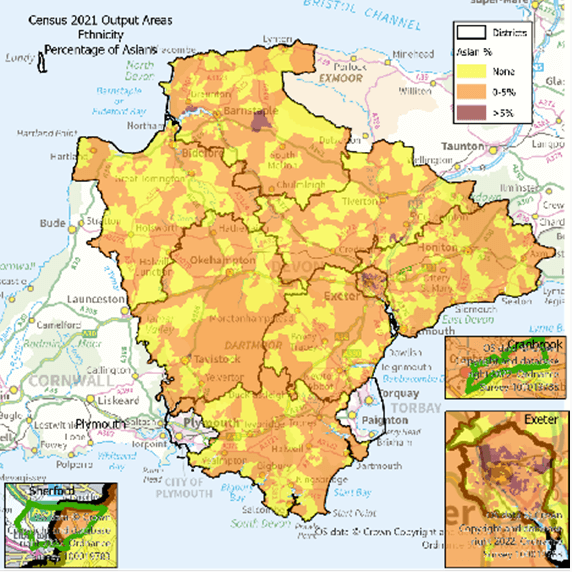
Highest percentages are in Exeter with some in the Barnstaple area
Map 4.1 e) Distribution of Black People by Output Area
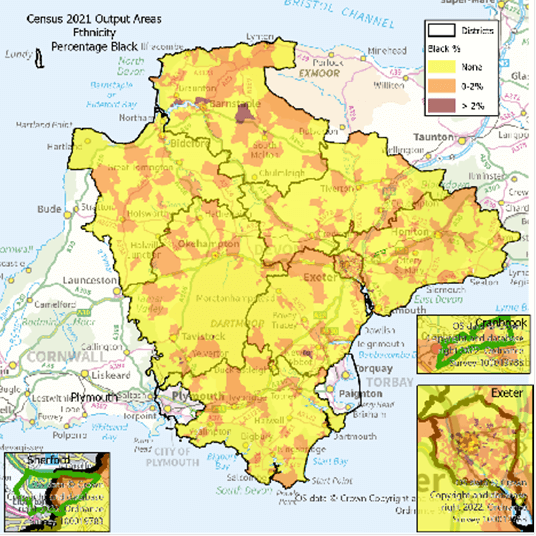
Highest percentages are in Exeter with some in the Barnstaple area.
Map 4.1 f) Distribution of Mixed Race People by Output Area

Mixed Race are well distributed throughout the County.
Map 4.1 g) Distribution of Other Races by Output Area
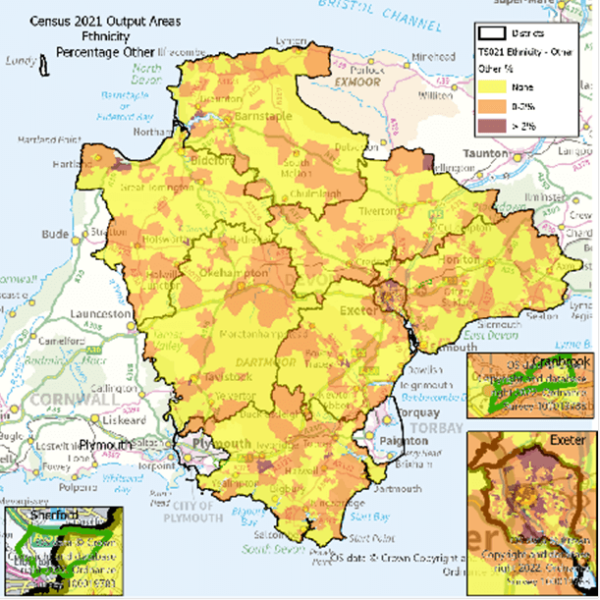
Highest percentages are in Exeter with some in rural areas.
Map 4.1 h) Distribution of White People by Output Area

Lowest percentages are in Exeter with some in the Barnstaple area.
4.2 Language
(ONS Tables TS025/6 or TS024)
Table 4.2 a) English Language Households by Broad Categories by District
| Area | All adults in household have English as a main language | At least one but not all adults in household have English as a main language | No adults in household, but at least one person aged 3 to 15 years, has English in as a main language | No people in household have English as a main language | Total Households | All adults in household have English as a main language % | At least one but not all adults in household have English as a main language % | No adults in household, but at least one person aged 3 to 15 years, has English in as a main language % | No people in household have English as a main language % |
|---|---|---|---|---|---|---|---|---|---|
| East Devon | 65,208 | 864 | 190 | 526 | 66,788 | 97.6 | 1.3 | 0.3 | 0.8 |
| Exeter | 47,829 | 1,960 | 549 | 2,216 | 52,554 | 91.0 | 3.7 | 1.0 | 4.2 |
| Mid Devon | 34,532 | 428 | 133 | 540 | 35,633 | 96.9 | 1.2 | 0.4 | 1.5 |
| North Devon | 42,200 | 450 | 100 | 448 | 43,198 | 97.7 | 1.0 | 0.2 | 1.0 |
| South Hams | 38,578 | 496 | 84 | 177 | 39,335 | 98.1 | 1.3 | 0.2 | 0.4 |
| Teignbridge | 58,706 | 646 | 115 | 371 | 59,838 | 98.1 | 1.1 | 0.2 | 0.6 |
| Torridge | 30,064 | 219 | 46 | 128 | 30,457 | 98.7 | 0.7 | 0.2 | 0.4 |
| West Devon | 24,386 | 251 | 36 | 145 | 24,818 | 98.3 | 1.0 | 0.1 | 0.6 |
| Plymouth | 108,465 | 2,180 | 857 | 3,056 | 114,558 | 94.7 | 1.9 | 0.7 | 2.7 |
| Torbay | 60,735 | 992 | 272 | 994 | 62,993 | 96.4 | 1.6 | 0.4 | 1.6 |
| One Devon | 510,703 | 8,486 | 2,382 | 8,601 | 530,172 | 96.3 | 1.6 | 0.4 | 1.6 |
| DCC Devon | 341,503 | 5,314 | 1,253 | 4,551 | 352,621 | 96.8 | 1.5 | 0.4 | 1.3 |
| South West | 2,316,582 | 54,060 | 16,893 | 61,346 | 2,448,881 | 94.6 | 2.2 | 0.7 | 2.5 |
| England | 20,920,337 | 1,016,271 | 323,408 | 1,176,067 | 23,436,083 | 89.3 | 4.3 | 1.4 | 5.0 |
Figure 4.2 a) English Language Households by Broad Categories by District

97% of Households in DCC Devon have all adults with English as their main language and 1.3% not having as a main language. In Exeter this falls to 91% English and 4.2% as not main language.
Table 4.2 b) Multi Language Households by Broad Categories by District
| Area | All household members have the same main language | One person household | Any other combination of multiple main languages | Main language differs between generations, but not within partnerships | Main language differs within partnerships | Households |
|---|---|---|---|---|---|---|
| East Devon | 45,622 | 20,056 | 292 | 212 | 605 | 66,787 |
| Exeter | 32,813 | 17,021 | 994 | 615 | 1,111 | 52,554 |
| Mid Devon | 24,800 | 10,238 | 153 | 133 | 309 | 35,633 |
| North Devon | 29,336 | 13,257 | 153 | 134 | 317 | 43,197 |
| South Hams | 27,123 | 11,621 | 156 | 99 | 335 | 39,334 |
| Teignbridge | 40,636 | 18,406 | 208 | 137 | 451 | 59,838 |
| Torridge | 20,846 | 9,330 | 62 | 55 | 163 | 30,456 |
| West Devon | 17,214 | 7,300 | 70 | 46 | 188 | 24,818 |
| Plymouth | 73,955 | 37,338 | 977 | 1,005 | 1,283 | 114,558 |
| Torbay | 39,764 | 21,883 | 352 | 355 | 640 | 62,994 |
| One Devon | 352,109 | 166,450 | 3,417 | 2,791 | 5,402 | 530,169 |
| DCC Devon | 238,390 | 107,229 | 2,088 | 1,431 | 3,479 | 352,617 |
| South West | 1,631,077 | 741,323 | 22,727 | 19,939 | 33,815 | 2,448,881 |
| England | 14,932,521 | 7,052,229 | 457,145 | 471,863 | 522,328 | 23,436,086 |
| Area | All household members have the same main language | One person household | Any other combination of multiple main languages | Main language differs between generations, but not within partnerships | Main language differs within partnerships |
|---|---|---|---|---|---|
| East Devon | 68.3 | 30.0 | 0.4 | 0.3 | 0.9 |
| Exeter | 62.4 | 32.4 | 1.9 | 1.2 | 2.1 |
| Mid Devon | 69.6 | 28.7 | 0.4 | 0.4 | 0.9 |
| North Devon | 67.9 | 30.7 | 0.4 | 0.3 | 0.7 |
| South Hams | 69.0 | 29.5 | 0.4 | 0.3 | 0.9 |
| Teignbridge | 67.9 | 30.8 | 0.3 | 0.2 | 0.8 |
| Torridge | 68.4 | 30.6 | 0.2 | 0.2 | 0.5 |
| West Devon | 69.4 | 29.4 | 0.3 | 0.2 | 0.8 |
| Plymouth | 64.6 | 32.6 | 0.9 | 0.9 | 1.1 |
| Torbay | 63.1 | 34.7 | 0.6 | 0.6 | 1.0 |
| One Devon | 66.4 | 31.4 | 0.6 | 0.5 | 1.0 |
| DCC Devon | 67.6 | 30.4 | 0.6 | 0.4 | 1.0 |
| South West | 66.6 | 30.3 | 0.9 | 0.8 | 1.4 |
| England | 63.7 | 30.1 | 2.0 | 2.0 | 2.2 |
Figure 4.2 b) Multi Language Households by Broad Categories by District

98% of DCC Devon households (either one person or all members) have the same main language. Exeter differs by being quite close to the English figures.
Table 4.2 c) English Language Households by Broad Categories by Devon Town
| Devon Town | All adults in household have English as a main language | At least one but not all adults in household have English as a main language | No adults in household, but at least one person aged 3 to 15 years, has English as a main language | No people in household have English as a main language | Total HouseHolds | All adults in household have English as a main language % | At least one but not all adults in household have English as a main language % | No adults in household, but at least one person aged 3 to 15 years, has as a main language % | No people in household have English as a main language % |
|---|---|---|---|---|---|---|---|---|---|
| Ashburton-Buckfastleigh | 3,458 | 43 | 7 | 15 | 3,523 | 98.2% | 1.2% | 0.2% | 0.4% |
| Axminster | 7,060 | 98 | 13 | 32 | 7,203 | 98.0% | 1.4% | 0.2% | 0.4% |
| Barnstaple | 20,605 | 266 | 65 | 280 | 21,216 | 97.1% | 1.3% | 0.3% | 1.3% |
| Bideford-Northam | 17,660 | 122 | 30 | 67 | 17,879 | 98.8% | 0.7% | 0.2% | 0.4% |
| Braunton | 5,063 | 53 | 11 | 42 | 5,169 | 97.9% | 1.0% | 0.2% | 0.8% |
| Cranbrook | 2,753 | 58 | 40 | 65 | 2,916 | 94.4% | 2.0% | 1.4% | 2.2% |
| Crediton | 9,298 | 121 | 22 | 113 | 9,554 | 97.3% | 1.3% | 0.2% | 1.2% |
| Cullompton | 10,356 | 130 | 49 | 171 | 10,706 | 96.7% | 1.2% | 0.5% | 1.6% |
| Dartmouth | 4,866 | 54 | 12 | 38 | 4,970 | 97.9% | 1.1% | 0.2% | 0.8% |
| Dawlish | 7,574 | 77 | 24 | 48 | 7,723 | 98.1% | 1.0% | 0.3% | 0.6% |
| Exeter (Wider) | 57,487 | 2,082 | 563 | 2,285 | 62,417 | 92.1% | 3.3% | 0.9% | 3.7% |
| Exmouth | 21,374 | 259 | 58 | 167 | 21,858 | 97.8% | 1.2% | 0.3% | 0.8% |
| Great Torrington | 4,702 | 45 | 11 | 20 | 4,778 | 98.4% | 0.9% | 0.2% | 0.4% |
| Holsworthy | 7,388 | 54 | 5 | 33 | 7,480 | 98.8% | 0.7% | 0.1% | 0.4% |
| Honiton | 8,385 | 105 | 20 | 55 | 8,565 | 97.9% | 1.2% | 0.2% | 0.6% |
| Ilfracombe | 7,537 | 58 | 12 | 65 | 7,672 | 98.2% | 0.8% | 0.2% | 0.8% |
| Ivybridge | 15,533 | 162 | 31 | 61 | 15,787 | 98.4% | 1.0% | 0.2% | 0.4% |
| Kingsbridge | 8,013 | 94 | 18 | 29 | 8,154 | 98.3% | 1.2% | 0.2% | 0.4% |
| Lynton-Lynmouth | 723 | 12 | 2 | 11 | 748 | 96.7% | 1.6% | 0.3% | 1.5% |
| Moretonhampstead | 1,904 | 27 | 4 | 10 | 1,945 | 97.9% | 1.4% | 0.2% | 0.5% |
| Newton Abbot | 32,179 | 341 | 61 | 228 | 32,809 | 98.1% | 1.0% | 0.2% | 0.7% |
| Okehampton | 11,983 | 161 | 26 | 102 | 12,272 | 97.6% | 1.3% | 0.2% | 0.8% |
| Ottery St Mary | 6,522 | 82 | 14 | 29 | 6,647 | 98.1% | 1.2% | 0.2% | 0.4% |
| Seaton | 6,059 | 68 | 14 | 59 | 6,200 | 97.7% | 1.1% | 0.2% | 1.0% |
| Sidmouth | 7,774 | 105 | 16 | 67 | 7,962 | 97.6% | 1.3% | 0.2% | 0.8% |
| South Molton | 6,539 | 53 | 11 | 47 | 6,650 | 98.3% | 0.8% | 0.2% | 0.7% |
| Tavistock | 13,389 | 93 | 12 | 50 | 13,544 | 98.9% | 0.7% | 0.1% | 0.4% |
| Teignmouth | 8,656 | 101 | 12 | 45 | 8,814 | 98.2% | 1.1% | 0.1% | 0.5% |
| Tiverton | 16,495 | 196 | 66 | 257 | 17,014 | 96.9% | 1.2% | 0.4% | 1.5% |
| Totnes | 10,168 | 187 | 19 | 50 | 10,424 | 97.5% | 1.8% | 0.2% | 0.5% |
| Plymouth | 108,465 | 2,180 | 857 | 3,056 | 114,558 | 94.7% | 1.9% | 0.7% | 2.7% |
| Torbay | 60,735 | 992 | 272 | 994 | 62,993 | 96.4% | 1.6% | 0.4% | 1.6% |
| One Devon | 510,703 | 8,486 | 2,382 | 8,601 | 530,172 | 96.3% | 1.6% | 0.4% | 1.6% |
| DCC Devon | 341,503 | 5,307 | 1,248 | 4,541 | 352,599 | 96.9% | 1.5% | 0.4% | 1.3% |
| South West | 2,316,582 | 54,060 | 16,893 | 61,346 | 2,448,881 | 94.6% | 2.2% | 0.7% | 2.5% |
| England | 20,920,337 | 1,016,271 | 323,408 | 1,176,067 | 23,436,083 | 89.3% | 4.3% | 1.4% | 5.0% |
Figure 4.2 c) English Language Households by Broad Categories by Devon Town
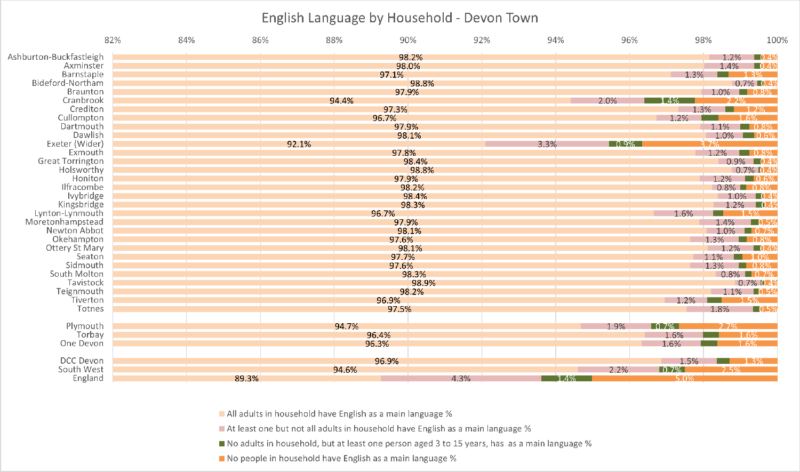
Only Exeter (Wider) and Cranbrook differ greatly from the DCC Devon figures.
Table 4.2 d) Multi Language Households by Broad Categories by Devon Town
| Devon Town | All household members have the same main language | One-person household | Any other combination of multiple main languages | Main language differs between generations, but not within partnerships | Main language differs within partnerships | Total HH | All household members have the same main language % | One-person household % | Any other combination of multiple main languages % | Main language differs between generations, but not within partnerships % | Main language differs within partnerships % |
|---|---|---|---|---|---|---|---|---|---|---|---|
| Ashburton-Buckfastleigh | 2,263 | 1,208 | 12 | 11 | 30 | 3,524 | 64.2% | 34.3% | 0.3% | 0.3% | 0.9% |
| Axminster | 5,022 | 2,070 | 27 | 20 | 68 | 7,207 | 69.7% | 28.7% | 0.4% | 0.3% | 0.9% |
| Barnstaple | 14,352 | 6,500 | 100 | 96 | 175 | 21,223 | 67.6% | 30.6% | 0.5% | 0.5% | 0.8% |
| Bideford-Northam | 11,878 | 5,839 | 30 | 35 | 96 | 17,878 | 66.4% | 32.7% | 0.2% | 0.2% | 0.5% |
| Braunton | 3,647 | 1,456 | 13 | 12 | 40 | 5,168 | 70.6% | 28.2% | 0.3% | 0.2% | 0.8% |
| Cranbrook | 2,274 | 541 | 21 | 33 | 52 | 2,921 | 77.9% | 18.5% | 0.7% | 1.1% | 1.8% |
| Crediton | 6,645 | 2,758 | 32 | 28 | 91 | 9,554 | 69.6% | 28.9% | 0.3% | 0.3% | 1.0% |
| Cullompton | 7,598 | 2,921 | 49 | 46 | 96 | 10,710 | 70.9% | 27.3% | 0.5% | 0.4% | 0.9% |
| Dartmouth | 3,267 | 1,632 | 11 | 13 | 43 | 4,966 | 65.8% | 32.9% | 0.2% | 0.3% | 0.9% |
| Dawlish | 4,995 | 2,625 | 26 | 28 | 52 | 7,726 | 64.7% | 34.0% | 0.3% | 0.4% | 0.7% |
| Exeter (Wider) | 39,947 | 19,593 | 1,035 | 641 | 1,190 | 62,406 | 64.0% | 31.4% | 1.7% | 1.0% | 1.9% |
| Exmouth | 14,587 | 6,929 | 92 | 63 | 184 | 21,855 | 66.7% | 31.7% | 0.4% | 0.3% | 0.8% |
| Great Torrington | 3,344 | 1,376 | 12 | 12 | 31 | 4,775 | 70.0% | 28.8% | 0.3% | 0.3% | 0.6% |
| Holsworthy | 5,407 | 2,012 | 16 | 6 | 33 | 7,474 | 72.3% | 26.9% | 0.2% | 0.1% | 0.4% |
| Honiton | 5,757 | 2,674 | 38 | 25 | 68 | 8,562 | 67.2% | 31.2% | 0.4% | 0.3% | 0.8% |
| Ilfracombe | 4,949 | 2,649 | 21 | 10 | 41 | 7,670 | 64.5% | 34.5% | 0.3% | 0.1% | 0.5% |
| Ivybridge | 11,504 | 4,088 | 53 | 28 | 111 | 15,784 | 72.9% | 25.9% | 0.3% | 0.2% | 0.7% |
| Kingsbridge | 5,457 | 2,587 | 30 | 19 | 66 | 8,159 | 66.9% | 31.7% | 0.4% | 0.2% | 0.8% |
| Lynton-Lynmouth | 470 | 264 | 2 | 1 | 13 | 750 | 62.7% | 35.2% | 0.3% | 0.1% | 1.7% |
| Moretonhampstead | 1,344 | 570 | 11 | 4 | 17 | 1,946 | 69.1% | 29.3% | 0.6% | 0.2% | 0.9% |
| Newton Abbot | 22,905 | 9,488 | 116 | 75 | 235 | 32,819 | 69.8% | 28.9% | 0.4% | 0.2% | 0.7% |
| Okehampton | 8,550 | 3,520 | 49 | 34 | 121 | 12,274 | 69.7% | 28.7% | 0.4% | 0.3% | 1.0% |
| Ottery St Mary | 4,808 | 1,740 | 31 | 15 | 57 | 6,651 | 72.3% | 26.2% | 0.5% | 0.2% | 0.9% |
| Seaton | 3,924 | 2,190 | 19 | 22 | 49 | 6,204 | 63.2% | 35.3% | 0.3% | 0.4% | 0.8% |
| Sidmouth | 5,147 | 2,686 | 36 | 17 | 78 | 7,964 | 64.6% | 33.7% | 0.5% | 0.2% | 1.0% |
| South Molton | 4,649 | 1,924 | 15 | 14 | 43 | 6,645 | 70.0% | 29.0% | 0.2% | 0.2% | 0.6% |
| Tavistock | 9,354 | 4,070 | 21 | 14 | 76 | 13,535 | 69.1% | 30.1% | 0.2% | 0.1% | 0.6% |
| Teignmouth | 5,627 | 3,072 | 31 | 11 | 73 | 8,814 | 63.8% | 34.9% | 0.4% | 0.1% | 0.8% |
| Tiverton | 11,810 | 4,928 | 79 | 62 | 129 | 17,008 | 69.4% | 29.0% | 0.5% | 0.4% | 0.8% |
| Totnes | 6,896 | 3,312 | 59 | 33 | 118 | 10,418 | 66.2% | 31.8% | 0.6% | 0.3% | 1.1% |
| Plymouth | 73,955 | 37,338 | 977 | 1,005 | 1,283 | 114,558 | 64.6% | 32.6% | 0.9% | 0.9% | 1.1% |
| Torbay | 39,764 | 21,883 | 352 | 355 | 640 | 62,994 | 63.1% | 34.7% | 0.6% | 0.6% | 1.0% |
| One Devon | 352,109 | 166,450 | 3,417 | 2,791 | 5,402 | 530,169 | 66.4% | 31.4% | 0.6% | 0.5% | 1.0% |
| Devon CC | 238,377 | 107,222 | 2,087 | 1,428 | 3,476 | 352,590 | 67.6% | 30.4% | 0.6% | 0.4% | 1.0% |
| South West | 1,631,077 | 741,323 | 22,727 | 19,939 | 33,815 | 2,448,881 | 66.6% | 30.3% | 0.9% | 0.8% | 1.4% |
| England | 14,932,521 | 7,052,229 | 457,145 | 471,863 | 522,328 | 23,436,086 | 63.7% | 30.1% | 2.0% | 2.0% | 2.2% |
Figure 4.2 d) Multi Language Households by Broad Categories by Devon Town
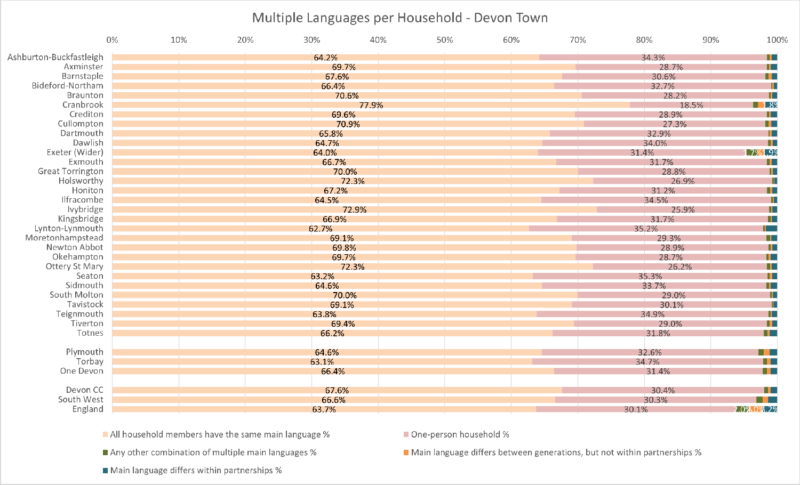
Most Devon Towns only differ from the DCC Figures by higher or lower percentages of One Person Households. Exeter (Wider) and Cranbrook do have numbers in the different main language options.
Table 4.2 e) Devon CC Area Total Table by main language (detailed) numbers and percentages
| Language | Devon | Percent |
|---|---|---|
| African language: Afrikaans | 64 | 0.0% |
| African language: Akan | 7 | 0.0% |
| African language: Amharic | 6 | 0.0% |
| African language: Any other African language | 42 | 0.0% |
| African language: Any other Nigerian language | 5 | 0.0% |
| African language: Any other West African language | 16 | 0.0% |
| African language: Igbo | 17 | 0.0% |
| African language: Krio | 1 | 0.0% |
| African language: Lingala | 3 | 0.0% |
| African language: Luganda | 1 | 0.0% |
| African language: Shona | 50 | 0.0% |
| African language: Somali | 2 | 0.0% |
| African language: Swahili or Kiswahili | 21 | 0.0% |
| African language: Tigrinya | 9 | 0.0% |
| African language: Yoruba | 8 | 0.0% |
| Arabic | 896 | 0.1% |
| Caribbean Creole: Any other Caribbean Creole | 1 | 0.0% |
| Caribbean Creole: English-based Caribbean Creole | 0 | 0.0% |
| East Asian language: All other Chinese | 1,175 | 0.1% |
| East Asian language: Any other East Asian language | 73 | 0.0% |
| East Asian language: Cantonese Chinese | 457 | 0.1% |
| East Asian language: Japanese | 168 | 0.0% |
| East Asian language: Korean | 117 | 0.0% |
| East Asian language: Malay | 65 | 0.0% |
| East Asian language: Mandarin Chinese | 217 | 0.0% |
| East Asian language: Tagalog or Filipino | 587 | 0.1% |
| East Asian language: Thai | 259 | 0.0% |
| East Asian language: Vietnamese | 82 | 0.0% |
| English | 770,106 | 94.9% |
| French | 718 | 0.1% |
| North or South American language | 0 | 0.0% |
| Oceanic or Australian language | 30 | 0.0% |
| Other European language (EU and non-EU): Bosnian, Croatian, Serbian, and Montenegrin | 49 | 0.0% |
| Other European language (EU): Any other European language (EU) | 55 | 0.0% |
| Other European language (EU): Bulgarian | 547 | 0.1% |
| Other European language (EU): Czech | 138 | 0.0% |
| Other European language (EU): Danish | 58 | 0.0% |
| Other European language (EU): Dutch | 239 | 0.0% |
| Other European language (EU): Estonian | 16 | 0.0% |
| Other European language (EU): Finnish | 33 | 0.0% |
| Other European language (EU): German | 539 | 0.1% |
| Other European language (EU): Greek | 334 | 0.0% |
| Other European language (EU): Hungarian | 505 | 0.1% |
| Other European language (EU): Italian | 639 | 0.1% |
| Other European language (EU): Latvian | 289 | 0.0% |
| Other European language (EU): Lithuanian | 654 | 0.1% |
| Other European language (EU): Maltese | 9 | 0.0% |
| Other European language (EU): Polish | 3,960 | 0.5% |
| Other European language (EU): Romanian | 2,161 | 0.3% |
| Other European language (EU): Slovak | 241 | 0.0% |
| Other European language (EU): Slovenian | 9 | 0.0% |
| Other European language (EU): Swedish | 96 | 0.0% |
| Other European language (non EU): Albanian | 52 | 0.0% |
| Other European language (non EU): Any other Eastern European language (non EU) | 3 | 0.0% |
| Other European language (non EU): Northern European language (non EU) | 64 | 0.0% |
| Other European language (non EU): Ukrainian | 34 | 0.0% |
| Other European language (non-national): Any Romani language | 2 | 0.0% |
| Other European language (non-national): Yiddish | 0 | 0.0% |
| Other language | 27 | 0.0% |
| Other UK language: Cornish | 12 | 0.0% |
| Other UK language: Gaelic (Irish) | 3 | 0.0% |
| Other UK language: Gaelic (Not otherwise specified) | 1 | 0.0% |
| Other UK language: Gaelic (Scottish) | 5 | 0.0% |
| Other UK language: Irish Traveller Cant | 0 | 0.0% |
| Other UK language: Manx Gaelic | 0 | 0.0% |
| Other UK language: Romany English | 3 | 0.0% |
| Other UK language: Scots | 3 | 0.0% |
| Other UK language: Ulster Scots | 0 | 0.0% |
| Portuguese | 683 | 0.1% |
| Russian | 408 | 0.1% |
| Sign language: Any other sign language | 10 | 0.0% |
| Sign language: Any sign communication system | 66 | 0.0% |
| Sign language: British Sign Language | 337 | 0.0% |
| South Asian language: Any other South Asian language | 35 | 0.0% |
| South Asian language: Bengali (with Sylheti and Chatgaya) | 360 | 0.0% |
| South Asian language: Gujarati | 41 | 0.0% |
| South Asian language: Hindi | 112 | 0.0% |
| South Asian language: Malayalam | 451 | 0.1% |
| South Asian language: Marathi | 21 | 0.0% |
| South Asian language: Nepalese | 178 | 0.0% |
| South Asian language: Pakistani Pahari (with Mirpuri and Potwari) | 0 | 0.0% |
| South Asian language: Panjabi | 69 | 0.0% |
| South Asian language: Sinhala | 32 | 0.0% |
| South Asian language: Tamil | 119 | 0.0% |
| South Asian language: Telugu | 57 | 0.0% |
| South Asian language: Urdu | 102 | 0.0% |
| Spanish | 1,188 | 0.1% |
| Turkish | 392 | 0.0% |
| Welsh or Cymraeg (in England only) | 85 | 0.0% |
| West or Central Asian language: Any other West or Central Asian language | 41 | 0.0% |
| West or Central Asian language: Hebrew | 13 | 0.0% |
| West or Central Asian language: Kurdish | 129 | 0.0% |
| West or Central Asian language: Pashto | 39 | 0.0% |
| West or Central Asian language: Persian or Farsi | 261 | 0.0% |
| Does not apply (under 3s) | 20,424 | 2.5% |
| Usual Residents | 811,636 | 100.0% |
95% of DCC Devon residents have English as their main language. Polish (3,960 people, 0.5%) and Romanian (2,161 0.3%) are the second and third main languages.
Spanish and All Other Chinese are the only other languages with more than 1,000 residents.
4.3 National Identity
(ONS table TS027)
Table 4.3 a) Broad national identity by district
| Area | British only identity | English only identity | English and British only identity | Other UK | Cornish | Irish | Northern Irish | Other Identity | Scottish | Welsh | Usual Residents |
|---|---|---|---|---|---|---|---|---|---|---|---|
| East Devon | 84,182 | 30,477 | 26,187 | 348 | 227 | 492 | 246 | 6,471 | 955 | 1,242 | 150,827 |
| Exeter | 69,773 | 18,895 | 21,832 | 499 | 256 | 733 | 247 | 16,187 | 798 | 1,489 | 130,709 |
| Mid Devon | 46,393 | 16,056 | 14,613 | 162 | 117 | 252 | 94 | 4,220 | 414 | 534 | 82,855 |
| North Devon | 55,627 | 20,293 | 16,946 | 167 | 105 | 271 | 116 | 3,839 | 550 | 696 | 98,610 |
| South Hams | 53,150 | 15,350 | 13,495 | 177 | 145 | 347 | 128 | 4,513 | 566 | 755 | 88,626 |
| Teignbridge | 76,991 | 26,752 | 23,214 | 266 | 223 | 397 | 182 | 5,022 | 739 | 1,015 | 134,801 |
| Torridge | 37,728 | 15,420 | 11,859 | 133 | 202 | 163 | 72 | 1,843 | 292 | 404 | 68,116 |
| West Devon | 32,612 | 11,468 | 9,386 | 130 | 241 | 207 | 102 | 2,233 | 341 | 375 | 57,095 |
| Plymouth | 151,509 | 43,806 | 45,648 | 599 | 926 | 755 | 517 | 16,961 | 1,950 | 2,023 | 264,694 |
| Torbay | 77,266 | 28,682 | 23,573 | 280 | 111 | 470 | 195 | 6,476 | 1,160 | 1,108 | 139,321 |
| One Devon | 685,231 | 227,199 | 206,753 | 2,761 | 2,553 | 4,087 | 1,899 | 67,765 | 7,765 | 9,641 | 1,215,654 |
| Devon CC | 456,456 | 154,711 | 137,532 | 1,882 | 1,516 | 2,862 | 1,187 | 44,328 | 4,655 | 6,510 | 811,639 |
| South West | 3,166,210 | 965,891 | 905,192 | 21,534 | 93,629 | 23,034 | 10,095 | 417,016 | 36,386 | 62,201 | 5,701,188 |
| England | 32,103,293 | 8,615,437 | 8,057,676 | 102,861 | 98,943 | 351,080 | 105,677 | 6,434,695 | 340,754 | 279,634 | 56,490,050 |
| Area | British only identity | English only identity | English and British only identity | Other UK | Cornish | Irish | Northern Irish | Other Identity | Scottish | Welsh |
|---|---|---|---|---|---|---|---|---|---|---|
| East Devon | 55.8% | 20.2% | 17.4% | 0.2% | 0.2% | 0.3% | 0.2% | 4.3% | 0.6% | 0.8% |
| Exeter | 53.4% | 14.5% | 16.7% | 0.4% | 0.2% | 0.6% | 0.2% | 12.4% | 0.6% | 1.1% |
| Mid Devon | 56.0% | 19.4% | 17.6% | 0.2% | 0.1% | 0.3% | 0.1% | 5.1% | 0.5% | 0.6% |
| North Devon | 56.4% | 20.6% | 17.2% | 0.2% | 0.1% | 0.3% | 0.1% | 3.9% | 0.6% | 0.7% |
| South Hams | 60.0% | 17.3% | 15.2% | 0.2% | 0.2% | 0.4% | 0.1% | 5.1% | 0.6% | 0.9% |
| Teignbridge | 57.1% | 19.8% | 17.2% | 0.2% | 0.2% | 0.3% | 0.1% | 3.7% | 0.5% | 0.8% |
| Torridge | 55.4% | 22.6% | 17.4% | 0.2% | 0.3% | 0.2% | 0.1% | 2.7% | 0.4% | 0.6% |
| West Devon | 57.1% | 20.1% | 16.4% | 0.2% | 0.4% | 0.4% | 0.2% | 3.9% | 0.6% | 0.7% |
| Plymouth | 57.2% | 16.5% | 17.2% | 0.2% | 0.3% | 0.3% | 0.2% | 6.4% | 0.7% | 0.8% |
| Torbay | 55.5% | 20.6% | 16.9% | 0.2% | 0.1% | 0.3% | 0.1% | 4.6% | 0.8% | 0.8% |
| One Devon | 56.4% | 18.7% | 17.0% | 0.2% | 0.2% | 0.3% | 0.2% | 5.6% | 0.6% | 0.8% |
| Devon CC | 56.2% | 19.1% | 16.9% | 0.2% | 0.2% | 0.4% | 0.1% | 5.5% | 0.6% | 0.8% |
| South West | 55.5% | 16.9% | 15.9% | 0.4% | 1.6% | 0.4% | 0.2% | 7.3% | 0.6% | 1.1% |
| England | 56.8% | 15.3% | 14.3% | 0.2% | 0.2% | 0.6% | 0.2% | 11.4% | 0.6% | 0.5% |
Figure 4.3 a) Broad national identity by district.

92% of people in DCC Devon recognise themselves as British and/or English – 5.5% have an Other Identity. This last figure increases to 12% in Exeter.
Table 4.3 b) Broad national identity by devon town
| Devon Town | British only identity | English only identity | English and British only identity | Other UK | Cornish | Irish | Northern Irish | Other Identity | Scottish | Welsh | Usual Residents |
|---|---|---|---|---|---|---|---|---|---|---|---|
| Ashburton-Buckfastleigh | 4,534 | 1,469 | 1,166 | 19 | 14 | 25 | 6 | 463 | 43 | 54 | 7,793 |
| Axminster | 8,954 | 3,512 | 2,782 | 30 | 10 | 42 | 15 | 685 | 87 | 121 | 16,238 |
| Barnstaple | 27,213 | 9,391 | 8,762 | 84 | 47 | 111 | 45 | 2,064 | 255 | 320 | 48,292 |
| Bideford-Northam | 21,936 | 8,473 | 6,811 | 66 | 63 | 106 | 42 | 1,085 | 174 | 260 | 39,016 |
| Braunton | 7,278 | 2,416 | 1,878 | 22 | 8 | 46 | 19 | 526 | 106 | 134 | 12,433 |
| Cranbrook | 4,576 | 986 | 1,643 | 14 | 23 | 10 | 11 | 486 | 28 | 41 | 7,818 |
| Crediton | 12,380 | 4,431 | 3,690 | 45 | 35 | 77 | 29 | 1,132 | 107 | 140 | 22,066 |
| Cullompton | 14,431 | 4,778 | 4,489 | 45 | 37 | 52 | 22 | 1,283 | 135 | 188 | 25,460 |
| Dartmouth | 6,067 | 2,042 | 1,572 | 14 | 11 | 45 | 23 | 624 | 88 | 96 | 10,582 |
| Dawlish | 8,994 | 3,783 | 2,906 | 41 | 21 | 68 | 34 | 540 | 82 | 167 | 16,636 |
| Exeter (Wider) | 83,648 | 23,177 | 25,692 | 557 | 303 | 794 | 295 | 17,128 | 917 | 1,644 | 154,155 |
| Exmouth | 27,771 | 9,651 | 8,332 | 136 | 68 | 174 | 99 | 2,087 | 416 | 446 | 49,180 |
| Great Torrington | 5,799 | 2,645 | 1,989 | 17 | 7 | 15 | 8 | 333 | 34 | 68 | 10,915 |
| Holsworthy | 9,622 | 4,078 | 2,955 | 47 | 128 | 43 | 10 | 408 | 85 | 81 | 17,457 |
| Honiton | 10,492 | 4,250 | 3,307 | 37 | 29 | 53 | 28 | 663 | 81 | 125 | 19,065 |
| Ilfracombe | 9,647 | 3,826 | 2,614 | 22 | 14 | 54 | 27 | 599 | 94 | 123 | 17,020 |
| Ivybridge | 22,515 | 6,503 | 5,747 | 76 | 80 | 131 | 48 | 1,290 | 239 | 320 | 36,949 |
| Kingsbridge | 10,622 | 3,216 | 2,981 | 18 | 17 | 57 | 22 | 683 | 100 | 133 | 17,849 |
| Lynton-Lynmouth | 835 | 365 | 293 | 3 | 3 | 7 | 2 | 90 | 5 | 6 | 1,609 |
| Moretonhampstead | 2,573 | 809 | 608 | 12 | 8 | 11 | 6 | 256 | 16 | 21 | 4,320 |
| Newton Abbot | 43,526 | 14,575 | 13,487 | 131 | 128 | 182 | 97 | 2,656 | 421 | 536 | 75,739 |
| Okehampton | 15,781 | 5,912 | 4,854 | 49 | 93 | 78 | 52 | 1,202 | 145 | 174 | 28,340 |
| Ottery St Mary | 9,019 | 2,975 | 2,726 | 34 | 38 | 69 | 18 | 593 | 91 | 135 | 15,698 |
| Seaton | 6,587 | 3,174 | 2,233 | 21 | 12 | 35 | 16 | 509 | 60 | 100 | 12,747 |
| Sidmouth | 8,839 | 3,616 | 2,899 | 48 | 27 | 61 | 35 | 865 | 122 | 167 | 16,679 |
| South Molton | 8,363 | 3,382 | 2,745 | 27 | 25 | 38 | 13 | 466 | 67 | 79 | 15,205 |
| Tavistock | 18,023 | 6,089 | 4,882 | 84 | 152 | 128 | 56 | 1,095 | 216 | 220 | 30,945 |
| Teignmouth | 10,532 | 3,888 | 3,223 | 36 | 34 | 83 | 27 | 715 | 113 | 166 | 18,817 |
| Tiverton | 21,947 | 7,702 | 7,060 | 78 | 49 | 126 | 52 | 1,884 | 181 | 238 | 39,317 |
| Totnes | 13,951 | 3,591 | 3,195 | 64 | 36 | 107 | 33 | 1,920 | 147 | 204 | 23,248 |
| Plymouth | 151,509 | 43,806 | 45,648 | 599 | 926 | 755 | 517 | 16,961 | 1,950 | 2,023 | 264,694 |
| Torbay | 77,266 | 28,682 | 23,573 | 280 | 111 | 470 | 195 | 6,476 | 1,160 | 1,108 | 139,321 |
| One Devon | 685,231 | 227,199 | 206,753 | 2,761 | 2,553 | 4,087 | 1,899 | 67,765 | 7,765 | 9,641 | 1,215,654 |
| Devon CC | 456,455 | 154,705 | 137,521 | 1,877 | 1,520 | 2,828 | 1,190 | 44,330 | 4,655 | 6,507 | 811,588 |
| South West | 3,166,210 | 965,891 | 905,192 | 21,534 | 93,629 | 23,034 | 10,095 | 417,016 | 36,386 | 62,201 | 5,701,188 |
| England | 32,103,293 | 8,615,437 | 8,057,676 | 102,861 | 98,943 | 351,080 | 105,677 | 6,434,695 | 340,754 | 279,634 | 56,490,050 |
| Devon Town | British only identity | English only identity | English and British only identity | Other UK | Cornish | Irish | Northern Irish | Other Identity | Scottish | Welsh |
|---|---|---|---|---|---|---|---|---|---|---|
| Ashburton-Buckfastleigh | 58.2% | 18.9% | 15.0% | 0.2% | 0.2% | 0.3% | 0.1% | 5.9% | 0.6% | 0.7% |
| Axminster | 55.1% | 21.6% | 17.1% | 0.2% | 0.1% | 0.3% | 0.1% | 4.2% | 0.5% | 0.7% |
| Barnstaple | 56.4% | 19.4% | 18.1% | 0.2% | 0.1% | 0.2% | 0.1% | 4.3% | 0.5% | 0.7% |
| Bideford-Northam | 56.2% | 21.7% | 17.5% | 0.2% | 0.2% | 0.3% | 0.1% | 2.8% | 0.4% | 0.7% |
| Braunton | 58.5% | 19.4% | 15.1% | 0.2% | 0.1% | 0.4% | 0.2% | 4.2% | 0.9% | 1.1% |
| Cranbrook | 58.5% | 12.6% | 21.0% | 0.2% | 0.3% | 0.1% | 0.1% | 6.2% | 0.4% | 0.5% |
| Crediton | 56.1% | 20.1% | 16.7% | 0.2% | 0.2% | 0.3% | 0.1% | 5.1% | 0.5% | 0.6% |
| Cullompton | 56.7% | 18.8% | 17.6% | 0.2% | 0.1% | 0.2% | 0.1% | 5.0% | 0.5% | 0.7% |
| Dartmouth | 57.3% | 19.3% | 14.9% | 0.1% | 0.1% | 0.4% | 0.2% | 5.9% | 0.8% | 0.9% |
| Dawlish | 54.1% | 22.7% | 17.5% | 0.2% | 0.1% | 0.4% | 0.2% | 3.2% | 0.5% | 1.0% |
| Exeter (Wider) | 54.3% | 15.0% | 16.7% | 0.4% | 0.2% | 0.5% | 0.2% | 11.1% | 0.6% | 1.1% |
| Exmouth | 56.5% | 19.6% | 16.9% | 0.3% | 0.1% | 0.4% | 0.2% | 4.2% | 0.8% | 0.9% |
| Great Torrington | 53.1% | 24.2% | 18.2% | 0.2% | 0.1% | 0.1% | 0.1% | 3.1% | 0.3% | 0.6% |
| Holsworthy | 55.1% | 23.4% | 16.9% | 0.3% | 0.7% | 0.2% | 0.1% | 2.3% | 0.5% | 0.5% |
| Honiton | 55.0% | 22.3% | 17.3% | 0.2% | 0.2% | 0.3% | 0.1% | 3.5% | 0.4% | 0.7% |
| Ilfracombe | 56.7% | 22.5% | 15.4% | 0.1% | 0.1% | 0.3% | 0.2% | 3.5% | 0.6% | 0.7% |
| Ivybridge | 60.9% | 17.6% | 15.6% | 0.2% | 0.2% | 0.4% | 0.1% | 3.5% | 0.6% | 0.9% |
| Kingsbridge | 59.5% | 18.0% | 16.7% | 0.1% | 0.1% | 0.3% | 0.1% | 3.8% | 0.6% | 0.7% |
| Lynton-Lynmouth | 51.9% | 22.7% | 18.2% | 0.2% | 0.2% | 0.4% | 0.1% | 5.6% | 0.3% | 0.4% |
| Moretonhampstead | 59.6% | 18.7% | 14.1% | 0.3% | 0.2% | 0.3% | 0.1% | 5.9% | 0.4% | 0.5% |
| Newton Abbot | 57.5% | 19.2% | 17.8% | 0.2% | 0.2% | 0.2% | 0.1% | 3.5% | 0.6% | 0.7% |
| Okehampton | 55.7% | 20.9% | 17.1% | 0.2% | 0.3% | 0.3% | 0.2% | 4.2% | 0.5% | 0.6% |
| Ottery St Mary | 57.5% | 19.0% | 17.4% | 0.2% | 0.2% | 0.4% | 0.1% | 3.8% | 0.6% | 0.9% |
| Seaton | 51.7% | 24.9% | 17.5% | 0.2% | 0.1% | 0.3% | 0.1% | 4.0% | 0.5% | 0.8% |
| Sidmouth | 53.0% | 21.7% | 17.4% | 0.3% | 0.2% | 0.4% | 0.2% | 5.2% | 0.7% | 1.0% |
| South Molton | 55.0% | 22.2% | 18.1% | 0.2% | 0.2% | 0.2% | 0.1% | 3.1% | 0.4% | 0.5% |
| Tavistock | 58.2% | 19.7% | 15.8% | 0.3% | 0.5% | 0.4% | 0.2% | 3.5% | 0.7% | 0.7% |
| Teignmouth | 56.0% | 20.7% | 17.1% | 0.2% | 0.2% | 0.4% | 0.1% | 3.8% | 0.6% | 0.9% |
| Tiverton | 55.8% | 19.6% | 18.0% | 0.2% | 0.1% | 0.3% | 0.1% | 4.8% | 0.5% | 0.6% |
| Totnes | 60.0% | 15.4% | 13.7% | 0.3% | 0.2% | 0.5% | 0.1% | 8.3% | 0.6% | 0.9% |
| Plymouth | 57.2% | 16.5% | 17.2% | 0.2% | 0.3% | 0.3% | 0.2% | 6.4% | 0.7% | 0.8% |
| Torbay | 55.5% | 20.6% | 16.9% | 0.2% | 0.1% | 0.3% | 0.1% | 4.6% | 0.8% | 0.8% |
| One Devon | 56.4% | 18.7% | 17.0% | 0.2% | 0.2% | 0.3% | 0.2% | 5.6% | 0.6% | 0.8% |
| Devon CC | 56.2% | 19.1% | 16.9% | 0.2% | 0.2% | 0.3% | 0.1% | 5.5% | 0.6% | 0.8% |
| South West | 55.5% | 16.9% | 15.9% | 0.4% | 1.6% | 0.4% | 0.2% | 7.3% | 0.6% | 1.1% |
| England | 56.8% | 15.3% | 14.3% | 0.2% | 0.2% | 0.6% | 0.2% | 11.4% | 0.6% | 0.5% |
Figure 4.3 b) Broad national identity by devon town

Exeter (Wider) has a slightly different profile than the other Devon Towns (which only differ from DCC Devon Figures by different English/British splits).
Table 4.3 c) Detailed national identity by Devon CC Area
| British only identity | English and British only identity | English only identity | Any other combination of only UK identities | Cornish and British only identity | Cornish only identity | Irish and at least one UK identity | Irish only identity | Northern Irish and British only identity | Northern Irish only identity | Other identity and at least one UK identity | Other identity only | Scottish and British only identity | Scottish only identity | Welsh and British only identity | Welsh only identity | Usual Residents | |
|---|---|---|---|---|---|---|---|---|---|---|---|---|---|---|---|---|---|
| Devon CC area | 456,456 | 137,532 | 154,711 | 1,882 | 226 | 1,290 | 777 | 2,085 | 408 | 779 | 11,214 | 33,114 | 1,475 | 3,180 | 1,901 | 4,609 | 811,639 |
| Percent | 56.2% | 16.9% | 19.1% | 0.2% | 0.0% | 0.2% | 0.1% | 0.3% | 0.1% | 0.1% | 1.4% | 4.1% | 0.2% | 0.4% | 0.2% | 0.6% |
4.4 Religion
(ONS Table TS030)
Table 4.4 a) Religion by district
| Areas | Buddhist | Christian | Hindu | Jewish | Muslim | No religion | Not answered | Other religion | Sikh | Usual Residents |
|---|---|---|---|---|---|---|---|---|---|---|
| East Devon | 499 | 75,621 | 163 | 154 | 515 | 63,176 | 9,857 | 810 | 33 | 150,828 |
| Exeter | 715 | 52,221 | 698 | 201 | 2,815 | 63,385 | 9,627 | 868 | 179 | 130,709 |
| Mid Devon | 258 | 39,197 | 110 | 63 | 137 | 37,304 | 5,249 | 506 | 29 | 82,853 |
| North Devon | 326 | 46,030 | 175 | 90 | 431 | 44,490 | 6,450 | 568 | 51 | 98,611 |
| South Hams | 540 | 42,008 | 92 | 126 | 295 | 39,029 | 5,774 | 740 | 22 | 88,626 |
| Teignbridge | 541 | 63,599 | 109 | 117 | 390 | 60,421 | 8,629 | 955 | 42 | 134,803 |
| Torridge | 212 | 33,184 | 34 | 45 | 108 | 29,542 | 4,539 | 432 | 19 | 68,115 |
| West Devon | 209 | 28,713 | 32 | 63 | 142 | 23,754 | 3,717 | 457 | 9 | 57,096 |
| Plymouth | 1,018 | 112,526 | 814 | 207 | 3,474 | 129,338 | 15,695 | 1,527 | 96 | 264,695 |
| Torbay | 553 | 67,634 | 223 | 141 | 788 | 60,178 | 8,771 | 976 | 60 | 139,324 |
| One Devon | 4,871 | 560,733 | 2,450 | 1,207 | 9,095 | 550,617 | 78,308 | 7,839 | 540 | 1,215,660 |
| DCC Devon | 3,300 | 380,573 | 1,413 | 859 | 4,833 | 361,101 | 53,842 | 5,336 | 384 | 811,641 |
| South West | 24,579 | 2,635,872 | 27,746 | 7,387 | 80,152 | 2,513,369 | 367,732 | 36,884 | 7,465 | 5,701,186 |
| England | 262,433 | 26,167,899 | 1,020,536 | 269,283 | 3,801,186 | 20,715,664 | 3,400,546 | 332,410 | 520,090 | 56,490,047 |
| Areas | Buddhist | Christian | Hindu | Jewish | Muslim | No religion | Not answered | Other religion | Sikh |
|---|---|---|---|---|---|---|---|---|---|
| East Devon | 0.33 | 50.14 | 0.11 | 0.10 | 0.34 | 41.89 | 6.54 | 0.54 | 0.02 |
| Exeter | 0.55 | 39.95 | 0.53 | 0.15 | 2.15 | 48.49 | 7.37 | 0.66 | 0.14 |
| Mid Devon | 0.31 | 47.31 | 0.13 | 0.08 | 0.17 | 45.02 | 6.34 | 0.61 | 0.04 |
| North Devon | 0.33 | 46.68 | 0.18 | 0.09 | 0.44 | 45.12 | 6.54 | 0.58 | 0.05 |
| South Hams | 0.61 | 47.40 | 0.10 | 0.14 | 0.33 | 44.04 | 6.52 | 0.83 | 0.02 |
| Teignbridge | 0.40 | 47.18 | 0.08 | 0.09 | 0.29 | 44.82 | 6.40 | 0.71 | 0.03 |
| Torridge | 0.31 | 48.72 | 0.05 | 0.07 | 0.16 | 43.37 | 6.66 | 0.63 | 0.03 |
| West Devon | 0.37 | 50.29 | 0.06 | 0.11 | 0.25 | 41.60 | 6.51 | 0.80 | 0.02 |
| Plymouth | 0.38 | 42.51 | 0.31 | 0.08 | 1.31 | 48.86 | 5.93 | 0.58 | 0.04 |
| Torbay | 0.40 | 48.54 | 0.16 | 0.10 | 0.57 | 43.19 | 6.30 | 0.70 | 0.04 |
| One Devon | 0.40 | 46.13 | 0.20 | 0.10 | 0.75 | 45.29 | 6.44 | 0.64 | 0.04 |
| DCC Devon | 0.41 | 46.89 | 0.17 | 0.11 | 0.60 | 44.49 | 6.63 | 0.66 | 0.05 |
| South West | 0.43 | 46.23 | 0.49 | 0.13 | 1.41 | 44.09 | 6.45 | 0.65 | 0.13 |
| England | 0.46 | 46.32 | 1.81 | 0.48 | 6.73 | 36.67 | 6.02 | 0.59 | 0.92 |
Figure 4.4 a) Religion by district

47% of people in DCC Devon identify as Christian, 44% have no religion and 7% didn’t answer the question. Exeter has 2% Muslim.
Table 4.4 b) Religion by devon town
| Devon Town | Buddhist | Christian | Hindu | Jewish | Muslim | No religion | Not answered | Other religion | Sikh | Usual Residents |
|---|---|---|---|---|---|---|---|---|---|---|
| Ashburton-Buckfastleigh | 68 | 3,353 | 1 | 5 | 14 | 3,669 | 554 | 127 | 1 | 7,792 |
| Axminster | 66 | 8,206 | 16 | 7 | 39 | 6,669 | 1,135 | 98 | 5 | 16,241 |
| Barnstaple | 158 | 21,616 | 104 | 35 | 316 | 22,741 | 3,019 | 271 | 36 | 48,296 |
| Bideford-Northam | 131 | 18,198 | 22 | 26 | 63 | 17,736 | 2,585 | 254 | 9 | 39,024 |
| Braunton | 73 | 5,907 | 38 | 14 | 29 | 5,430 | 861 | 59 | 10 | 12,421 |
| Cranbrook | 17 | 2,806 | 4 | 6 | 37 | 4,451 | 467 | 28 | 0 | 7,816 |
| Crediton | 85 | 10,531 | 40 | 18 | 37 | 9,779 | 1,413 | 162 | 3 | 22,068 |
| Cullompton | 61 | 11,944 | 27 | 22 | 45 | 11,619 | 1,623 | 118 | 14 | 25,473 |
| Dartmouth | 52 | 5,367 | 12 | 21 | 96 | 4,296 | 661 | 65 | 4 | 10,574 |
| Dawlish | 71 | 8,024 | 15 | 7 | 42 | 7,203 | 1,140 | 136 | 2 | 16,640 |
| Exeter (Wider) | 784 | 63,622 | 741 | 219 | 2,882 | 73,743 | 10,954 | 989 | 195 | 154,129 |
| Exmouth | 134 | 24,615 | 75 | 61 | 131 | 20,664 | 3,211 | 283 | 5 | 49,179 |
| Great Torrington | 32 | 5,489 | 4 | 7 | 14 | 4,531 | 767 | 71 | 2 | 10,917 |
| Holsworthy | 43 | 9,144 | 7 | 9 | 35 | 6,950 | 1,160 | 101 | 6 | 17,455 |
| Honiton | 117 | 9,579 | 10 | 21 | 93 | 7,856 | 1,264 | 119 | 3 | 19,062 |
| Ilfracombe | 41 | 7,705 | 13 | 20 | 36 | 7,856 | 1,253 | 104 | 0 | 17,028 |
| Ivybridge | 122 | 18,299 | 26 | 35 | 87 | 15,992 | 2,196 | 188 | 9 | 36,954 |
| Kingsbridge | 56 | 9,014 | 10 | 27 | 46 | 7,397 | 1,196 | 97 | 6 | 17,849 |
| Lynton-Lynmouth | 7 | 834 | 0 | 0 | 7 | 653 | 97 | 12 | 0 | 1,610 |
| Moretonhampstead | 34 | 2,027 | 0 | 3 | 9 | 1,918 | 286 | 45 | 2 | 4,324 |
| Newton Abbot | 241 | 35,297 | 66 | 72 | 239 | 34,609 | 4,721 | 466 | 22 | 75,733 |
| Okehampton | 103 | 13,944 | 11 | 18 | 75 | 12,116 | 1,847 | 221 | 0 | 28,335 |
| Ottery St Mary | 31 | 7,907 | 9 | 8 | 47 | 6,678 | 943 | 68 | 7 | 15,698 |
| Seaton | 37 | 7,047 | 7 | 15 | 36 | 4,558 | 987 | 68 | 3 | 12,758 |
| Sidmouth | 65 | 8,976 | 21 | 30 | 84 | 6,319 | 1,101 | 80 | 4 | 16,680 |
| South Molton | 41 | 7,713 | 14 | 15 | 35 | 6,348 | 955 | 88 | 3 | 15,212 |
| Tavistock | 116 | 15,942 | 22 | 48 | 68 | 12,491 | 2,004 | 252 | 9 | 30,952 |
| Teignmouth | 88 | 9,197 | 11 | 13 | 55 | 8,084 | 1,236 | 114 | 4 | 18,802 |
| Tiverton | 121 | 18,941 | 43 | 29 | 62 | 17,393 | 2,466 | 258 | 14 | 39,327 |
| Totnes | 311 | 9,329 | 40 | 43 | 66 | 11,338 | 1,729 | 393 | 3 | 23,252 |
| Plymouth | 1,018 | 112,526 | 814 | 207 | 3,474 | 129,338 | 15,695 | 1,527 | 96 | 264,695 |
| Torbay | 553 | 67,634 | 223 | 141 | 788 | 60,178 | 8,771 | 976 | 60 | 139,324 |
| One Devon | 4,871 | 560,733 | 2,450 | 1,207 | 9,095 | 550,617 | 78,308 | 7,839 | 540 | 1,215,660 |
| Devon CC | 3,306 | 380,573 | 1,409 | 854 | 4,825 | 361,087 | 53,831 | 5,335 | 381 | 811,601 |
| South West | 24,579 | 2,635,872 | 27,746 | 7,387 | 80,152 | 2,513,369 | 367,732 | 36,884 | 7,465 | 5,701,186 |
| England | 262,433 | 26,167,899 | 1,020,536 | 269,283 | 3,801,186 | 20,715,664 | 3,400,546 | 332,410 | 520,090 | 56,490,047 |
| Buddhist | Christian | Hindu | Jewish | Muslim | No religion | Not answered | Other religion | Sikh | |
|---|---|---|---|---|---|---|---|---|---|
| Ashburton-Buckfastleigh | 0.9% | 43.0% | 0.0% | 0.1% | 0.2% | 47.1% | 7.1% | 1.6% | 0.0% |
| Axminster | 0.4% | 50.5% | 0.1% | 0.0% | 0.2% | 41.1% | 7.0% | 0.6% | 0.0% |
| Barnstaple | 0.3% | 44.8% | 0.2% | 0.1% | 0.7% | 47.1% | 6.3% | 0.6% | 0.1% |
| Bideford-Northam | 0.3% | 46.6% | 0.1% | 0.1% | 0.2% | 45.4% | 6.6% | 0.7% | 0.0% |
| Braunton | 0.6% | 47.6% | 0.3% | 0.1% | 0.2% | 43.7% | 6.9% | 0.5% | 0.1% |
| Cranbrook | 0.2% | 35.9% | 0.1% | 0.1% | 0.5% | 56.9% | 6.0% | 0.4% | 0.0% |
| Crediton | 0.4% | 47.7% | 0.2% | 0.1% | 0.2% | 44.3% | 6.4% | 0.7% | 0.0% |
| Cullompton | 0.2% | 46.9% | 0.1% | 0.1% | 0.2% | 45.6% | 6.4% | 0.5% | 0.1% |
| Dartmouth | 0.5% | 50.8% | 0.1% | 0.2% | 0.9% | 40.6% | 6.3% | 0.6% | 0.0% |
| Dawlish | 0.4% | 48.2% | 0.1% | 0.0% | 0.3% | 43.3% | 6.9% | 0.8% | 0.0% |
| Exeter (Wider) | 0.5% | 41.3% | 0.5% | 0.1% | 1.9% | 47.8% | 7.1% | 0.6% | 0.1% |
| Exmouth | 0.3% | 50.1% | 0.2% | 0.1% | 0.3% | 42.0% | 6.5% | 0.6% | 0.0% |
| Great Torrington | 0.3% | 50.3% | 0.0% | 0.1% | 0.1% | 41.5% | 7.0% | 0.7% | 0.0% |
| Holsworthy | 0.2% | 52.4% | 0.0% | 0.1% | 0.2% | 39.8% | 6.6% | 0.6% | 0.0% |
| Honiton | 0.6% | 50.3% | 0.1% | 0.1% | 0.5% | 41.2% | 6.6% | 0.6% | 0.0% |
| Ilfracombe | 0.2% | 45.2% | 0.1% | 0.1% | 0.2% | 46.1% | 7.4% | 0.6% | 0.0% |
| Ivybridge | 0.3% | 49.5% | 0.1% | 0.1% | 0.2% | 43.3% | 5.9% | 0.5% | 0.0% |
| Kingsbridge | 0.3% | 50.5% | 0.1% | 0.2% | 0.3% | 41.4% | 6.7% | 0.5% | 0.0% |
| Lynton-Lynmouth | 0.4% | 51.8% | 0.0% | 0.0% | 0.4% | 40.6% | 6.0% | 0.7% | 0.0% |
| Moretonhampstead | 0.8% | 46.9% | 0.0% | 0.1% | 0.2% | 44.4% | 6.6% | 1.0% | 0.0% |
| Newton Abbot | 0.3% | 46.6% | 0.1% | 0.1% | 0.3% | 45.7% | 6.2% | 0.6% | 0.0% |
| Okehampton | 0.4% | 49.2% | 0.0% | 0.1% | 0.3% | 42.8% | 6.5% | 0.8% | 0.0% |
| Ottery St Mary | 0.2% | 50.4% | 0.1% | 0.1% | 0.3% | 42.5% | 6.0% | 0.4% | 0.0% |
| Seaton | 0.3% | 55.2% | 0.1% | 0.1% | 0.3% | 35.7% | 7.7% | 0.5% | 0.0% |
| Sidmouth | 0.4% | 53.8% | 0.1% | 0.2% | 0.5% | 37.9% | 6.6% | 0.5% | 0.0% |
| South Molton | 0.3% | 50.7% | 0.1% | 0.1% | 0.2% | 41.7% | 6.3% | 0.6% | 0.0% |
| Tavistock | 0.4% | 51.5% | 0.1% | 0.2% | 0.2% | 40.4% | 6.5% | 0.8% | 0.0% |
| Teignmouth | 0.5% | 48.9% | 0.1% | 0.1% | 0.3% | 43.0% | 6.6% | 0.6% | 0.0% |
| Tiverton | 0.3% | 48.2% | 0.1% | 0.1% | 0.2% | 44.2% | 6.3% | 0.7% | 0.0% |
| Totnes | 1.3% | 40.1% | 0.2% | 0.2% | 0.3% | 48.8% | 7.4% | 1.7% | 0.0% |
| Plymouth | 0.4% | 42.5% | 0.3% | 0.1% | 1.3% | 48.9% | 5.9% | 0.6% | 0.0% |
| Torbay | 0.4% | 48.5% | 0.2% | 0.1% | 0.6% | 43.2% | 6.3% | 0.7% | 0.0% |
| One Devon | 0.4% | 46.1% | 0.2% | 0.1% | 0.7% | 45.3% | 6.4% | 0.6% | 0.0% |
| Devon CC | 0.4% | 46.9% | 0.2% | 0.1% | 0.6% | 44.5% | 6.6% | 0.7% | 0.0% |
| South West | 0.4% | 46.2% | 0.5% | 0.1% | 1.4% | 44.1% | 6.5% | 0.6% | 0.1% |
| England | 0.5% | 46.3% | 1.8% | 0.5% | 6.7% | 36.7% | 6.0% | 0.6% | 0.9% |
Figure 4.4 b) Religion by devon town
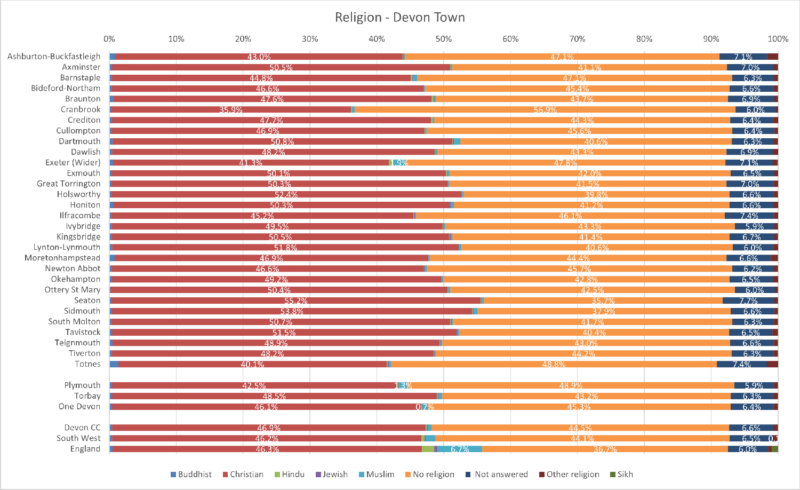
Cranbrook has a low percentage of Christians (36%) and a high percentage of no religion (57%).
4.5 Sexual Orientation
(ONS table TS079)
Table 4.5 a) Sexual Orientation by district
| District | Asexual | Bisexual | Gay or Lesbian | Pansexual | Queer | All other sexual orientations | Straight or Heterosexual | Not answered | Usual Residents 16+ |
|---|---|---|---|---|---|---|---|---|---|
| East Devon | 67 | 1,143 | 1,456 | 184 | 23 | 8 | 115,356 | 9,152 | 127,389 |
| Exeter | 161 | 3,062 | 2,154 | 408 | 76 | 35 | 95,950 | 9,486 | 111,332 |
| Mid Devon | 43 | 720 | 768 | 121 | 10 | 12 | 61,506 | 5,025 | 68,205 |
| North Devon | 53 | 807 | 913 | 125 | 15 | 11 | 74,190 | 6,079 | 82,193 |
| South Hams | 34 | 770 | 858 | 150 | 28 | 19 | 67,712 | 5,397 | 74,968 |
| Teignbridge | 68 | 1,182 | 1,412 | 178 | 17 | 11 | 102,424 | 8,167 | 113,459 |
| Torridge | 35 | 516 | 723 | 67 | 4 | 2 | 51,744 | 4,466 | 57,557 |
| West Devon | 22 | 470 | 536 | 82 | 14 | 10 | 43,550 | 3,675 | 48,359 |
| Plymouth | 244 | 4,509 | 4,297 | 578 | 66 | 36 | 194,465 | 14,429 | 218,624 |
| Torbay | 57 | 1,344 | 2,035 | 208 | 20 | 13 | 104,729 | 8,626 | 117,032 |
| One Devon | 784 | 14,523 | 15,152 | 2,101 | 273 | 157 | 911,626 | 74,502 | 1,019,118 |
| DCC Devon | 483 | 8,670 | 8,820 | 1,315 | 187 | 108 | 612,432 | 51,447 | 683,462 |
| South West | 3,339 | 67,894 | 67,500 | 10,348 | 1,439 | 865 | 4,238,858 | 345,597 | 4,735,840 |
| England | 26,614 | 591,690 | 709,706 | 107,854 | 13,927 | 9,963 | 41,114,479 | 3,432,729 | 46,006,962 |
| District | Asexual | Bisexual | Gay or Lesbian | Pansexual | Queer | All other sexual orientations | Straight or Heterosexual | Not answered |
|---|---|---|---|---|---|---|---|---|
| East Devon | 0.1% | 0.9% | 1.1% | 0.1% | 0.0% | 0.0% | 90.6% | 7.2% |
| Exeter | 0.1% | 2.8% | 1.9% | 0.4% | 0.1% | 0.0% | 86.2% | 8.5% |
| Mid Devon | 0.1% | 1.1% | 1.1% | 0.2% | 0.0% | 0.0% | 90.2% | 7.4% |
| North Devon | 0.1% | 1.0% | 1.1% | 0.2% | 0.0% | 0.0% | 90.3% | 7.4% |
| South Hams | 0.0% | 1.0% | 1.1% | 0.2% | 0.0% | 0.0% | 90.3% | 7.2% |
| Teignbridge | 0.1% | 1.0% | 1.2% | 0.2% | 0.0% | 0.0% | 90.3% | 7.2% |
| Torridge | 0.1% | 0.9% | 1.3% | 0.1% | 0.0% | 0.0% | 89.9% | 7.8% |
| West Devon | 0.0% | 1.0% | 1.1% | 0.2% | 0.0% | 0.0% | 90.1% | 7.6% |
| Plymouth | 0.1% | 2.1% | 2.0% | 0.3% | 0.0% | 0.0% | 88.9% | 6.6% |
| Torbay | 0.0% | 1.1% | 1.7% | 0.2% | 0.0% | 0.0% | 89.5% | 7.4% |
| One Devon | 0.1% | 1.4% | 1.5% | 0.2% | 0.0% | 0.0% | 89.5% | 7.3% |
| DCC Devon | 0.1% | 1.3% | 1.3% | 0.2% | 0.0% | 0.0% | 89.6% | 7.5% |
| South West | 0.1% | 1.4% | 1.4% | 0.2% | 0.0% | 0.0% | 89.5% | 7.3% |
| England | 0.1% | 1.3% | 1.5% | 0.2% | 0.0% | 0.0% | 89.4% | 7.5% |
Figure 4.5 a) Sexual Orientation by district

There is some doubt about how accurately this was answered as it was the first Census to ask the question – 90% of DCC Devon identified as straight/heterosexual and a further 7.5% didn’t answer. Although the percentages are small: 483 people were Asexual, 8,670 Bisexual, 8,820 Gay/Lesbian, 1,315 Pansexual, 108 All Other Orientations and 187 Queer.
4.6 Gender Identity
(ONS Table TS070)
Table 4.6 a) Gender Identity by district
| Area | Gender identity the same as sex registered at birth | Gender identity different from sex registered at birth but no specific identity given | Non-binary | Trans man | Trans woman | All other gender identities | Not answered | Usual Residents 16+ |
|---|---|---|---|---|---|---|---|---|
| East Devon | 120,074 | 113 | 63 | 55 | 57 | 22 | 7,005 | 127,389 |
| Exeter | 103,398 | 189 | 159 | 98 | 119 | 84 | 7,284 | 111,331 |
| Mid Devon | 64,216 | 116 | 20 | 36 | 46 | 22 | 3,748 | 68,204 |
| North Devon | 77,351 | 98 | 35 | 55 | 63 | 23 | 4,568 | 82,193 |
| South Hams | 71,042 | 67 | 39 | 42 | 59 | 25 | 3,694 | 74,968 |
| Teignbridge | 106,969 | 103 | 52 | 63 | 73 | 47 | 6,154 | 113,461 |
| Torridge | 53,969 | 54 | 26 | 33 | 40 | 26 | 3,412 | 57,560 |
| West Devon | 45,568 | 34 | 18 | 26 | 19 | 13 | 2,684 | 48,362 |
| Torbay | 109,984 | 151 | 60 | 102 | 94 | 42 | 6,599 | 117,032 |
| Plymouth | 205,959 | 405 | 238 | 266 | 204 | 108 | 11,444 | 218,624 |
| One Devon | 958,530 | 1,330 | 710 | 776 | 774 | 412 | 56,592 | 1,019,124 |
| DCC Devon | 642,587 | 774 | 412 | 408 | 476 | 262 | 38,549 | 683,468 |
| South West | 4,451,316 | 6,865 | 3,499 | 3,700 | 3,752 | 2,112 | 264,593 | 4,735,837 |
| England | 43,002,331 | 113,760 | 28,713 | 46,511 | 45,683 | 17,177 | 2,752,781 | 46,006,956 |
| Area | Gender identity the same as sex registered at birth | Gender identity different from sex registered at birth but no specific identity given | Non-binary | Trans man | Trans woman | All other gender identities | Not answered |
|---|---|---|---|---|---|---|---|
| East Devon | 94.3% | 0.1% | 0.0% | 0.0% | 0.0% | 0.0% | 5.5% |
| Exeter | 92.9% | 0.2% | 0.1% | 0.1% | 0.1% | 0.1% | 6.5% |
| Mid Devon | 94.2% | 0.2% | 0.0% | 0.1% | 0.1% | 0.0% | 5.5% |
| North Devon | 94.1% | 0.1% | 0.0% | 0.1% | 0.1% | 0.0% | 5.6% |
| South Hams | 94.8% | 0.1% | 0.1% | 0.1% | 0.1% | 0.0% | 4.9% |
| Teignbridge | 94.3% | 0.1% | 0.0% | 0.1% | 0.1% | 0.0% | 5.4% |
| Torridge | 93.8% | 0.1% | 0.0% | 0.1% | 0.1% | 0.0% | 5.9% |
| West Devon | 94.2% | 0.1% | 0.0% | 0.1% | 0.0% | 0.0% | 5.5% |
| Torbay | 94.0% | 0.1% | 0.1% | 0.1% | 0.1% | 0.0% | 5.6% |
| Plymouth | 94.2% | 0.2% | 0.1% | 0.1% | 0.1% | 0.0% | 5.2% |
| One Devon | 94.1% | 0.1% | 0.1% | 0.1% | 0.1% | 0.0% | 5.6% |
| DCC Devon | 94.0% | 0.1% | 0.1% | 0.1% | 0.1% | 0.0% | 5.6% |
| South West | 94.0% | 0.1% | 0.1% | 0.1% | 0.1% | 0.0% | 5.6% |
| England | 93.5% | 0.2% | 0.1% | 0.1% | 0.1% | 0.0% | 6.0% |
Figure 4.6 a) Gender Identity by district
There is some doubt about how accurately this was answered as it was the first Census to ask the question – in DCC Devon – 94% same as sex registered at birth, 5.6% didn’t answer the question. Small percentages but there are 774 with an unknown sex change, 482 Non-binary, 408 Trans Man, 476 Trans woman and 262 all other gender identities.