5 Housing
5.1 Accommodation Type
(ONS Table TS044)
Table 5.1 a) Accommodation Type by district
| Area | Detached | Semi-detached | Terraced | In a purpose-built block of flats or tenement | Part of a converted or shared house, including bedsits | Part of another converted building, for example, former school, church or warehouse | In a commercial building, for example, in an office building, hotel or over a shop | A caravan or other mobile or temporary structure | Total Households |
| East Devon | 25,712 | 18,114 | 12,997 | 6,069 | 2,207 | 559 | 708 | 420 | 66,786 |
| Exeter | 7,943 | 14,140 | 16,458 | 10,306 | 2,374 | 555 | 440 | 335 | 52,551 |
| Mid Devon | 13,703 | 10,433 | 7,870 | 2,321 | 512 | 297 | 254 | 243 | 35,633 |
| North Devon | 17,051 | 10,177 | 9,471 | 3,617 | 1,422 | 505 | 540 | 414 | 43,197 |
| South Hams | 15,663 | 11,029 | 8,215 | 2,414 | 828 | 520 | 370 | 296 | 39,335 |
| Teignbridge | 22,214 | 15,003 | 13,183 | 4,916 | 2,089 | 769 | 572 | 1,091 | 59,837 |
| Torridge | 13,191 | 6,974 | 7,037 | 1,816 | 590 | 332 | 294 | 221 | 30,455 |
| West Devon | 10,702 | 6,570 | 4,948 | 1,552 | 422 | 261 | 206 | 156 | 24,817 |
| Plymouth | 13,017 | 34,537 | 37,592 | 18,588 | 8,629 | 1,092 | 773 | 330 | 114,558 |
| Torbay | 14,125 | 15,617 | 14,226 | 10,818 | 5,877 | 1,098 | 1,004 | 230 | 62,995 |
| One Devon | 153,321 | 142,594 | 131,997 | 62,417 | 24,950 | 5,988 | 5,161 | 3,736 | 530,164 |
| Devon CC | 126,179 | 92,440 | 80,179 | 33,011 | 10,444 | 3,798 | 3,384 | 3,176 | 352,611 |
| South West | 734,775 | 694,153 | 546,603 | 314,386 | 93,304 | 25,536 | 21,495 | 18,628 | 2,448,880 |
| England | 5,368,859 | 7,378,304 | 5,381,432 | 3,999,768 | 821,153 | 188,705 | 197,967 | 99,895 | 23,436,083 |
| Area | Detached | Semi-detached | Terraced | In a purpose-built block of flats or tenement | Part of a converted or shared house, including bedsits | Part of another converted building, for example, former school, church or warehouse | In a commercial building, for example, in an office building, hotel or over a shop | A caravan or other mobile or temporary structure |
| East Devon | 38.5% | 27.1% | 19.5% | 9.1% | 3.3% | 0.8% | 1.1% | 0.6% |
| Exeter | 15.1% | 26.9% | 31.3% | 19.6% | 4.5% | 1.1% | 0.8% | 0.6% |
| Mid Devon | 38.5% | 29.3% | 22.1% | 6.5% | 1.4% | 0.8% | 0.7% | 0.7% |
| North Devon | 39.5% | 23.6% | 21.9% | 8.4% | 3.3% | 1.2% | 1.3% | 1.0% |
| South Hams | 39.8% | 28.0% | 20.9% | 6.1% | 2.1% | 1.3% | 0.9% | 0.8% |
| Teignbridge | 37.1% | 25.1% | 22.0% | 8.2% | 3.5% | 1.3% | 1.0% | 1.8% |
| Torridge | 43.3% | 22.9% | 23.1% | 6.0% | 1.9% | 1.1% | 1.0% | 0.7% |
| West Devon | 43.1% | 26.5% | 19.9% | 6.3% | 1.7% | 1.1% | 0.8% | 0.6% |
| Plymouth | 11.4% | 30.1% | 32.8% | 16.2% | 7.5% | 1.0% | 0.7% | 0.3% |
| Torbay | 22.4% | 24.8% | 22.6% | 17.2% | 9.3% | 1.7% | 1.6% | 0.4% |
| One Devon | 28.9% | 26.9% | 24.9% | 11.8% | 4.7% | 1.1% | 1.0% | 0.7% |
| Devon CC | 35.8% | 26.2% | 22.7% | 9.4% | 3.0% | 1.1% | 1.0% | 0.9% |
| South West | 30.0% | 28.3% | 22.3% | 12.8% | 3.8% | 1.0% | 0.9% | 0.8% |
| England | 22.9% | 31.5% | 23.0% | 17.1% | 3.5% | 0.8% | 0.8% | 0.4% |
Figure 5.1 a) Accommodation Type by district

There are big differences within districts as the type of housing available – Plymouth, Torbay and Exeter less detached and more terraced and purpose-built flats. Plymouth & Torbay have more converted houses (including bedsits). In the DCC Devon area there are over 3,000 living in a caravan or other mobile or temporary structure.
Table 5.1 b) Accommodation Type by devon town
| Devon Town | Detached | Semi-detached | Terraced | In a purpose-built block of flats or tenement | Part of a converted or shared house, including bedsits | Part of another converted building, for example, former school, church or warehouse | In a commercial building, for example, in an office building, hotel or over a shop | A caravan or other mobile or temporary structure | Total Households |
| Ashburton-Buckfastleigh | 1,008 | 881 | 1,122 | 210 | 128 | 60 | 46 | 69 | 3,524 |
| Axminster | 3,425 | 1,895 | 1,222 | 422 | 104 | 53 | 53 | 34 | 7,208 |
| Barnstaple | 7,996 | 5,150 | 5,025 | 2,022 | 565 | 150 | 181 | 122 | 21,211 |
| Bideford-Northam | 6,673 | 3,779 | 4,998 | 1,488 | 460 | 236 | 171 | 72 | 17,877 |
| Braunton | 2,390 | 1,384 | 881 | 247 | 82 | 34 | 55 | 92 | 5,165 |
| Cranbrook | 883 | 984 | 854 | 169 | 15 | 7 | 7 | 3 | 2,922 |
| Crediton | 4,093 | 2,733 | 1,797 | 576 | 116 | 108 | 77 | 49 | 9,549 |
| Cullompton | 4,265 | 3,192 | 2,343 | 602 | 114 | 57 | 56 | 68 | 10,697 |
| Dartmouth | 1,842 | 1,201 | 993 | 469 | 239 | 88 | 77 | 60 | 4,969 |
| Dawlish | 2,505 | 1,839 | 1,654 | 1,084 | 382 | 78 | 86 | 97 | 7,725 |
| Exeter (Wider) | 12,367 | 16,668 | 18,251 | 10,685 | 2,511 | 720 | 487 | 746 | 62,435 |
| Exmouth | 6,606 | 5,892 | 4,647 | 2,830 | 1,361 | 227 | 247 | 48 | 21,858 |
| Great Torrington | 2,030 | 1,301 | 1,114 | 176 | 58 | 28 | 59 | 15 | 4,781 |
| Holsworthy | 4,332 | 1,795 | 894 | 152 | 83 | 72 | 59 | 91 | 7,478 |
| Honiton | 3,472 | 2,587 | 1,626 | 543 | 91 | 54 | 85 | 106 | 8,564 |
| Ilfracombe | 2,399 | 1,318 | 1,817 | 1,021 | 652 | 224 | 178 | 57 | 7,666 |
| Ivybridge | 6,863 | 4,647 | 3,293 | 514 | 153 | 113 | 94 | 112 | 15,789 |
| Kingsbridge | 3,306 | 2,078 | 1,625 | 701 | 185 | 135 | 87 | 44 | 8,161 |
| Lynton-Lynmouth | 258 | 155 | 178 | 58 | 23 | 37 | 41 | 3 | 753 |
| Moretonhampstead | 934 | 512 | 394 | 36 | 34 | 13 | 13 | 7 | 1,943 |
| Newton Abbot | 12,200 | 9,024 | 7,511 | 2,164 | 781 | 286 | 257 | 590 | 32,813 |
| Okehampton | 5,459 | 3,267 | 2,364 | 645 | 187 | 112 | 102 | 127 | 12,263 |
| Ottery St Mary | 3,144 | 2,003 | 1,096 | 193 | 73 | 29 | 51 | 59 | 6,648 |
| Seaton | 2,508 | 1,532 | 991 | 755 | 215 | 72 | 113 | 10 | 6,196 |
| Sidmouth | 3,192 | 1,727 | 1,595 | 930 | 289 | 78 | 137 | 14 | 7,962 |
| South Molton | 3,063 | 1,670 | 1,346 | 235 | 86 | 50 | 80 | 124 | 6,654 |
| Tavistock | 5,768 | 3,579 | 2,695 | 932 | 238 | 153 | 106 | 69 | 13,540 |
| Teignmouth | 3,256 | 1,586 | 1,627 | 1,276 | 685 | 191 | 144 | 56 | 8,821 |
| Tiverton | 6,285 | 4,966 | 3,922 | 1,149 | 286 | 133 | 122 | 144 | 17,007 |
| Totnes | 3,655 | 3,097 | 2,308 | 737 | 246 | 188 | 116 | 81 | 10,428 |
| Plymouth | 13,017 | 34,537 | 37,592 | 18,588 | 8,629 | 1,092 | 773 | 330 | 114,558 |
| Torbay | 14,125 | 15,617 | 14,226 | 10,818 | 5,877 | 1,098 | 1,004 | 230 | 62,995 |
| One Devon | 153,321 | 142,594 | 131,997 | 62,417 | 24,950 | 5,988 | 5,161 | 3,736 | 530,164 |
| Devon CC | 126,177 | 92,442 | 80,183 | 33,021 | 10,442 | 3,786 | 3,387 | 3,169 | 352,607 |
| South West | 734,775 | 694,153 | 546,603 | 314,386 | 93,304 | 25,536 | 21,495 | 18,628 | 2,448,880 |
| England | 5,368,859 | 7,378,304 | 5,381,432 | 3,999,768 | 821,153 | 188,705 | 197,967 | 99,895 | 23,436,083 |
| Devon Town | Detached | Semi-detached | Terraced | In a purpose-built block of flats or tenement | Part of a converted or shared house, including bedsits | Part of another converted building, for example, former school, church or warehouse | In a commercial building, for example, in an office building, hotel or over a shop | A caravan or other mobile or temporary structure |
| Ashburton-Buckfastleigh | 28.6% | 25.0% | 31.8% | 6.0% | 3.6% | 1.7% | 1.3% | 2.0% |
| Axminster | 47.5% | 26.3% | 17.0% | 5.9% | 1.4% | 0.7% | 0.7% | 0.5% |
| Barnstaple | 37.7% | 24.3% | 23.7% | 9.5% | 2.7% | 0.7% | 0.9% | 0.6% |
| Bideford-Northam | 37.3% | 21.1% | 28.0% | 8.3% | 2.6% | 1.3% | 1.0% | 0.4% |
| Braunton | 46.3% | 26.8% | 17.1% | 4.8% | 1.6% | 0.7% | 1.1% | 1.8% |
| Cranbrook | 30.2% | 33.7% | 29.2% | 5.8% | 0.5% | 0.2% | 0.2% | 0.1% |
| Crediton | 42.9% | 28.6% | 18.8% | 6.0% | 1.2% | 1.1% | 0.8% | 0.5% |
| Cullompton | 39.9% | 29.8% | 21.9% | 5.6% | 1.1% | 0.5% | 0.5% | 0.6% |
| Dartmouth | 37.1% | 24.2% | 20.0% | 9.4% | 4.8% | 1.8% | 1.5% | 1.2% |
| Dawlish | 32.4% | 23.8% | 21.4% | 14.0% | 4.9% | 1.0% | 1.1% | 1.3% |
| Exeter (Wider) | 19.8% | 26.7% | 29.2% | 17.1% | 4.0% | 1.2% | 0.8% | 1.2% |
| Exmouth | 30.2% | 27.0% | 21.3% | 12.9% | 6.2% | 1.0% | 1.1% | 0.2% |
| Great Torrington | 42.5% | 27.2% | 23.3% | 3.7% | 1.2% | 0.6% | 1.2% | 0.3% |
| Holsworthy | 57.9% | 24.0% | 12.0% | 2.0% | 1.1% | 1.0% | 0.8% | 1.2% |
| Honiton | 40.5% | 30.2% | 19.0% | 6.3% | 1.1% | 0.6% | 1.0% | 1.2% |
| Ilfracombe | 31.3% | 17.2% | 23.7% | 13.3% | 8.5% | 2.9% | 2.3% | 0.7% |
| Ivybridge | 43.5% | 29.4% | 20.9% | 3.3% | 1.0% | 0.7% | 0.6% | 0.7% |
| Kingsbridge | 40.5% | 25.5% | 19.9% | 8.6% | 2.3% | 1.7% | 1.1% | 0.5% |
| Lynton-Lynmouth | 34.3% | 20.6% | 23.6% | 7.7% | 3.1% | 4.9% | 5.4% | 0.4% |
| Moretonhampstead | 48.1% | 26.4% | 20.3% | 1.9% | 1.7% | 0.7% | 0.7% | 0.4% |
| Newton Abbot | 37.2% | 27.5% | 22.9% | 6.6% | 2.4% | 0.9% | 0.8% | 1.8% |
| Okehampton | 44.5% | 26.6% | 19.3% | 5.3% | 1.5% | 0.9% | 0.8% | 1.0% |
| Ottery St Mary | 47.3% | 30.1% | 16.5% | 2.9% | 1.1% | 0.4% | 0.8% | 0.9% |
| Seaton | 40.5% | 24.7% | 16.0% | 12.2% | 3.5% | 1.2% | 1.8% | 0.2% |
| Sidmouth | 40.1% | 21.7% | 20.0% | 11.7% | 3.6% | 1.0% | 1.7% | 0.2% |
| South Molton | 46.0% | 25.1% | 20.2% | 3.5% | 1.3% | 0.8% | 1.2% | 1.9% |
| Tavistock | 42.6% | 26.4% | 19.9% | 6.9% | 1.8% | 1.1% | 0.8% | 0.5% |
| Teignmouth | 36.9% | 18.0% | 18.4% | 14.5% | 7.8% | 2.2% | 1.6% | 0.6% |
| Tiverton | 37.0% | 29.2% | 23.1% | 6.8% | 1.7% | 0.8% | 0.7% | 0.8% |
| Totnes | 35.0% | 29.7% | 22.1% | 7.1% | 2.4% | 1.8% | 1.1% | 0.8% |
| Plymouth | 11.4% | 30.1% | 32.8% | 16.2% | 7.5% | 1.0% | 0.7% | 0.3% |
| Torbay | 22.4% | 24.8% | 22.6% | 17.2% | 9.3% | 1.7% | 1.6% | 0.4% |
| One Devon | 28.9% | 26.9% | 24.9% | 11.8% | 4.7% | 1.1% | 1.0% | 0.7% |
| Devon CC | 35.8% | 26.2% | 22.7% | 9.4% | 3.0% | 1.1% | 1.0% | 0.9% |
| South West | 30.0% | 28.3% | 22.3% | 12.8% | 3.8% | 1.0% | 0.9% | 0.8% |
| England | 22.9% | 31.5% | 23.0% | 17.1% | 3.5% | 0.8% | 0.8% | 0.4% |
Figure 5.1 b) Accommodation Type by devon town
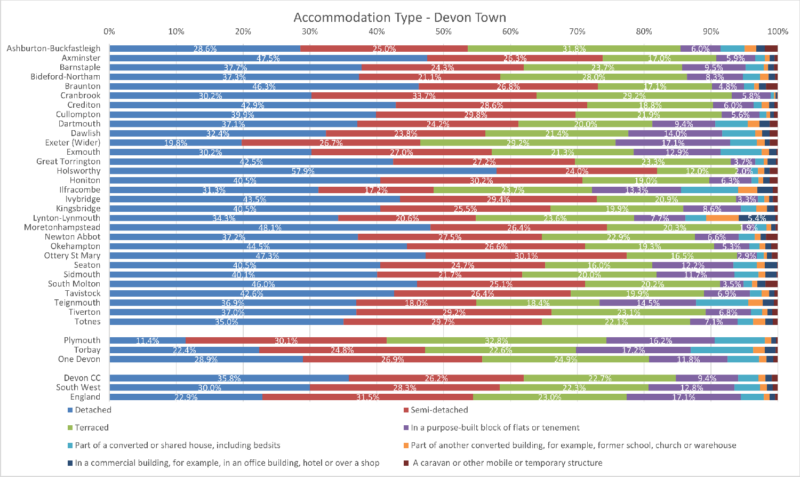
Holsworthy has 58% of its accommodation being detached (at least 10% more than everyone else). Purpose built flats are popular in the Plymouth, Torbay and Exeter (Wider) but also Teignmouth, Dawlish and Ivybridge. 5.4% of Lynton & Lynmouth are in a commercial building. 746 households in Exeter (Wider) and 590 in Newton Abbot live in a caravan or other mobile or temporary structure.
Map 5.1 c) A caravan or other mobile structure by Output Area

People living in caravans or other mobile or temporary structures seem to spread over the county in mainly rural areas.
5.2 Tenure
(ONS Table TS054)
Table 5.2 a) Tenure by district
| Area | Owned: Owns outright | Owned: Owns with a mortgage or loan | Shared ownership: Shared ownership | Private rented: Private landlord or letting agency | Private rented: Other private rented | Social rented: Other social rented | Social rented: Rents from council or Local Authority | Lives rent free | Total Households |
| East Devon | 31,228 | 16,967 | 947 | 8,960 | 1,737 | 2,868 | 4,030 | 51 | 66,788 |
| Exeter | 16,369 | 13,703 | 583 | 12,024 | 1,083 | 4,087 | 4,640 | 65 | 52,554 |
| Mid Devon | 14,110 | 9,988 | 365 | 5,704 | 908 | 1,674 | 2,830 | 52 | 35,631 |
| North Devon | 18,055 | 11,025 | 477 | 7,364 | 1,449 | 3,701 | 1,110 | 17 | 43,198 |
| South Hams | 17,708 | 10,008 | 628 | 5,258 | 1,068 | 3,925 | 728 | 14 | 39,337 |
| Teignbridge | 25,889 | 16,770 | 775 | 9,357 | 1,326 | 4,370 | 1,324 | 26 | 59,837 |
| Torridge | 13,870 | 7,316 | 265 | 5,157 | 995 | 2,380 | 467 | 8 | 30,458 |
| West Devon | 11,569 | 6,043 | 176 | 3,830 | 696 | 2,000 | 495 | 9 | 24,818 |
| Plymouth | 33,783 | 32,255 | 1,349 | 22,754 | 3,167 | 13,725 | 7,386 | 138 | 114,557 |
| Torbay | 24,663 | 15,699 | 622 | 15,195 | 1,572 | 4,664 | 561 | 16 | 62,992 |
| One Devon | 207,244 | 139,774 | 6,187 | 95,603 | 14,001 | 43,394 | 23,571 | 396 | 530,170 |
| Devon CC | 148,798 | 91,820 | 4,216 | 57,654 | 9,262 | 25,005 | 15,624 | 242 | 352,621 |
| South West | 922,164 | 691,050 | 26,458 | 417,677 | 64,467 | 201,043 | 123,885 | 2,135 | 2,448,879 |
| England | 7,624,692 | 6,744,372 | 235,952 | 4,273,688 | 521,200 | 2,060,511 | 1,945,151 | 30,516 | 23,436,082 |
| Area | Owned: Owns outright | Owned: Owns with a mortgage or loan | Shared ownership: Shared ownership | Private rented: Private landlord or letting agency | Private rented: Other private rented | Social rented: Other social rented | Social rented: Rents from council or Local Authority | Lives rent free |
| East Devon | 46.8% | 25.4% | 1.4% | 13.4% | 2.6% | 4.3% | 6.0% | 0.1% |
| Exeter | 31.1% | 26.1% | 1.1% | 22.9% | 2.1% | 7.8% | 8.8% | 0.1% |
| Mid Devon | 39.6% | 28.0% | 1.0% | 16.0% | 2.5% | 4.7% | 7.9% | 0.1% |
| North Devon | 41.8% | 25.5% | 1.1% | 17.0% | 3.4% | 8.6% | 2.6% | 0.0% |
| South Hams | 45.0% | 25.4% | 1.6% | 13.4% | 2.7% | 10.0% | 1.9% | 0.0% |
| Teignbridge | 43.3% | 28.0% | 1.3% | 15.6% | 2.2% | 7.3% | 2.2% | 0.0% |
| Torridge | 45.5% | 24.0% | 0.9% | 16.9% | 3.3% | 7.8% | 1.5% | 0.0% |
| West Devon | 46.6% | 24.3% | 0.7% | 15.4% | 2.8% | 8.1% | 2.0% | 0.0% |
| Plymouth | 29.5% | 28.2% | 1.2% | 19.9% | 2.8% | 12.0% | 6.4% | 0.1% |
| Torbay | 39.2% | 24.9% | 1.0% | 24.1% | 2.5% | 7.4% | 0.9% | 0.0% |
| One Devon | 39.1% | 26.4% | 1.2% | 18.0% | 2.6% | 8.2% | 4.4% | 0.1% |
| Devon CC | 42.2% | 26.0% | 1.2% | 16.4% | 2.6% | 7.1% | 4.4% | 0.1% |
| South West | 37.7% | 28.2% | 1.1% | 17.1% | 2.6% | 8.2% | 5.1% | 0.1% |
| England | 32.5% | 28.8% | 1.0% | 18.2% | 2.2% | 8.8% | 8.3% | 0.1% |
Figure 5.2 a) Tenure by district

In the Devon CC Area 42% own their home (10% higher than the England figure), with a further 26% with a mortgage. 19% Private rent their accommodation. 7% Socially Rent and 4% rent from the local authority (about half the England figure). Exeter’s profile is different and is quite similar to England. Torbay has very few local authority houses.
Table 5.2 b) Tenure by devon town
| Devon Town | Owned: Owns outright | Owned: Owns with a mortgage or loan | Shared ownership: Shared ownership | Private rented: Private landlord or letting agency | Private rented: Other private rented | Social rented: Other social rented | Social rented: Rents from council or Local Authority | Lives rent free | Total Households |
| Ashburton-Buckfastleigh | 1,407 | 812 | 35 | 663 | 110 | 347 | 143 | 6 | 3,523 |
| Axminster | 3,549 | 1,651 | 96 | 901 | 192 | 327 | 488 | 2 | 7,206 |
| Barnstaple | 8,333 | 5,734 | 309 | 3,438 | 509 | 2,200 | 695 | 6 | 21,224 |
| Bideford-Northam | 7,674 | 4,400 | 203 | 3,189 | 543 | 1,550 | 330 | 4 | 17,893 |
| Braunton | 2,309 | 1,407 | 56 | 694 | 298 | 316 | 91 | 2 | 5,173 |
| Cranbrook | 444 | 1,369 | 263 | 312 | 73 | 371 | 85 | 0 | 2,917 |
| Crediton | 4,077 | 2,670 | 79 | 1,449 | 251 | 374 | 647 | 9 | 9,556 |
| Cullompton | 4,027 | 3,368 | 145 | 1,552 | 282 | 609 | 705 | 16 | 10,704 |
| Dartmouth | 2,441 | 943 | 55 | 629 | 177 | 589 | 133 | 1 | 4,968 |
| Dawlish | 3,468 | 1,776 | 134 | 1,360 | 165 | 647 | 171 | 1 | 7,722 |
| Exeter (Wider) | 20,431 | 16,923 | 758 | 13,286 | 1,327 | 4,713 | 4,918 | 73 | 62,429 |
| Exmouth | 10,103 | 5,388 | 161 | 3,335 | 603 | 772 | 1,481 | 20 | 21,863 |
| Great Torrington | 2,235 | 1,191 | 22 | 765 | 157 | 339 | 62 | 1 | 4,772 |
| Holsworthy | 3,819 | 1,653 | 43 | 1,148 | 282 | 459 | 77 | 1 | 7,482 |
| Honiton | 4,020 | 2,090 | 53 | 1,288 | 224 | 282 | 605 | 3 | 8,565 |
| Ilfracombe | 3,198 | 1,772 | 27 | 1,751 | 286 | 481 | 150 | 3 | 7,668 |
| Ivybridge | 6,703 | 5,034 | 273 | 2,022 | 361 | 1,183 | 204 | 4 | 15,784 |
| Kingsbridge | 3,854 | 1,763 | 100 | 1,086 | 254 | 877 | 215 | 5 | 8,154 |
| Lynton-Lynmouth | 358 | 156 | 3 | 142 | 33 | 48 | 9 | 1 | 750 |
| Moretonhampstead | 955 | 460 | 14 | 276 | 69 | 128 | 41 | 0 | 1,943 |
| Newton Abbot | 13,585 | 10,133 | 449 | 4,764 | 678 | 2,453 | 724 | 14 | 32,800 |
| Okehampton | 5,523 | 2,919 | 89 | 2,172 | 394 | 985 | 199 | 2 | 12,283 |
| Ottery St Mary | 3,096 | 1,985 | 128 | 749 | 150 | 247 | 293 | 4 | 6,652 |
| Seaton | 3,393 | 1,114 | 41 | 923 | 165 | 213 | 361 | 4 | 6,214 |
| Sidmouth | 4,583 | 1,422 | 89 | 872 | 177 | 292 | 522 | 12 | 7,969 |
| South Molton | 2,999 | 1,523 | 76 | 1,105 | 253 | 560 | 125 | 4 | 6,645 |
| Tavistock | 6,537 | 3,340 | 88 | 1,842 | 338 | 1,081 | 309 | 9 | 13,544 |
| Teignmouth | 4,136 | 2,141 | 75 | 1,570 | 194 | 536 | 165 | 3 | 8,820 |
| Tiverton | 6,823 | 4,420 | 150 | 2,854 | 455 | 769 | 1,526 | 27 | 17,024 |
| Totnes | 4,707 | 2,263 | 203 | 1,517 | 287 | 1,274 | 177 | 4 | 10,432 |
| Plymouth | 33,783 | 32,255 | 1,349 | 22,754 | 3,167 | 13,725 | 7,386 | 138 | 114,557 |
| Torbay | 24,663 | 15,699 | 622 | 15,195 | 1,572 | 4,664 | 561 | 16 | 62,992 |
| One Devon | 207,244 | 139,774 | 6,187 | 95,603 | 14,001 | 43,394 | 23,571 | 396 | 530,170 |
| Devon CC | 36,274 | 18,208 | 850 | 11,432 | 2,019 | 4,972 | 3,478 | 67 | 77,300 |
| South West | 922,164 | 691,050 | 26,458 | 417,677 | 64,467 | 201,043 | 123,885 | 2,135 | 2,448,879 |
| England | 7,624,692 | 6,744,372 | 235,952 | 4,273,688 | 521,200 | 2,060,511 | 1,945,151 | 30,516 | 23,436,082 |
| Devon Town | Owned: Owns outright | Owned: Owns with a mortgage or loan | Shared ownership: Shared ownership | Private rented: Other private rented | Private rented: Private landlord or letting agency | Social rented: Other social rented | Social rented: Rents from council or Local Authority | Lives rent free | ||||||
| Ashburton-Buckfastleigh | 39.9% | 23.0% | 1.0% | 18.8% | 3.1% | 9.8% | 4.1% | 0.2% | ||||||
| Axminster | 49.3% | 22.9% | 1.3% | 12.5% | 2.7% | 4.5% | 6.8% | 0.0% | ||||||
| Barnstaple | 39.3% | 27.0% | 1.5% | 16.2% | 2.4% | 10.4% | 3.3% | 0.0% | ||||||
| Bideford-Northam | 42.9% | 24.6% | 1.1% | 17.8% | 3.0% | 8.7% | 1.8% | 0.0% | ||||||
| Braunton | 44.6% | 27.2% | 1.1% | 13.4% | 5.8% | 6.1% | 1.8% | 0.0% | ||||||
| Cranbrook | 15.2% | 46.9% | 9.0% | 10.7% | 2.5% | 12.7% | 2.9% | 0.0% | ||||||
| Crediton | 42.7% | 27.9% | 0.8% | 15.2% | 2.6% | 3.9% | 6.8% | 0.1% | ||||||
| Cullompton | 37.6% | 31.5% | 1.4% | 14.5% | 2.6% | 5.7% | 6.6% | 0.1% | ||||||
| Dartmouth | 49.1% | 19.0% | 1.1% | 12.7% | 3.6% | 11.9% | 2.7% | 0.0% | ||||||
| Dawlish | 44.9% | 23.0% | 1.7% | 17.6% | 2.1% | 8.4% | 2.2% | 0.0% | ||||||
| Exeter (Wider) | 32.7% | 27.1% | 1.2% | 21.3% | 2.1% | 7.5% | 7.9% | 0.1% | ||||||
| Exmouth | 46.2% | 24.6% | 0.7% | 15.3% | 2.8% | 3.5% | 6.8% | 0.1% | ||||||
| Great Torrington | 46.8% | 25.0% | 0.5% | 16.0% | 3.3% | 7.1% | 1.3% | 0.0% | ||||||
| Holsworthy | 51.0% | 22.1% | 0.6% | 15.3% | 3.8% | 6.1% | 1.0% | 0.0% | ||||||
| Honiton | 46.9% | 24.4% | 0.6% | 15.0% | 2.6% | 3.3% | 7.1% | 0.0% | ||||||
| Ilfracombe | 41.7% | 23.1% | 0.4% | 22.8% | 3.7% | 6.3% | 2.0% | 0.0% | ||||||
| Ivybridge | 42.5% | 31.9% | 1.7% | 12.8% | 2.3% | 7.5% | 1.3% | 0.0% | ||||||
| Kingsbridge | 47.3% | 21.6% | 1.2% | 13.3% | 3.1% | 10.8% | 2.6% | 0.1% | ||||||
| Lynton-Lynmouth | 47.7% | 20.8% | 0.4% | 18.9% | 4.4% | 6.4% | 1.2% | 0.1% | ||||||
| Moretonhampstead | 49.2% | 23.7% | 0.7% | 14.2% | 3.6% | 6.6% | 2.1% | 0.0% | ||||||
| Newton Abbot | 41.4% | 30.9% | 1.4% | 14.5% | 2.1% | 7.5% | 2.2% | 0.0% | ||||||
| Okehampton | 45.0% | 23.8% | 0.7% | 17.7% | 3.2% | 8.0% | 1.6% | 0.0% | ||||||
| Ottery St Mary | 46.5% | 29.8% | 1.9% | 11.3% | 2.3% | 3.7% | 4.4% | 0.1% | ||||||
| Seaton | 54.6% | 17.9% | 0.7% | 14.9% | 2.7% | 3.4% | 5.8% | 0.1% | ||||||
| Sidmouth | 57.5% | 17.8% | 1.1% | 10.9% | 2.2% | 3.7% | 6.6% | 0.2% | ||||||
| South Molton | 45.1% | 22.9% | 1.1% | 16.6% | 3.8% | 8.4% | 1.9% | 0.1% | ||||||
| Tavistock | 48.3% | 24.7% | 0.6% | 13.6% | 2.5% | 8.0% | 2.3% | 0.1% | ||||||
| Teignmouth | 46.9% | 24.3% | 0.9% | 17.8% | 2.2% | 6.1% | 1.9% | 0.0% | ||||||
| Tiverton | 40.1% | 26.0% | 0.9% | 16.8% | 2.7% | 4.5% | 9.0% | 0.2% | ||||||
| Totnes | 45.1% | 21.7% | 1.9% | 14.5% | 2.8% | 12.2% | 1.7% | 0.0% | ||||||
| Plymouth | 29.5% | 28.2% | 1.2% | 19.9% | 2.8% | 12.0% | 6.4% | 0.1% | ||||||
| Torbay | 39.2% | 24.9% | 1.0% | 24.1% | 2.5% | 7.4% | 0.9% | 0.0% | ||||||
| One Devon | 39.1% | 26.4% | 1.2% | 18.0% | 2.6% | 8.2% | 4.4% | 0.1% | ||||||
| DCC Devon | 46.9% | 23.6% | 1.1% | 14.8% | 2.6% | 6.4% | 4.5% | 0.1% | ||||||
| South West | 37.7% | 28.2% | 1.1% | 17.1% | 2.6% | 8.2% | 5.1% | 0.1% | ||||||
| England | 32.5% | 28.8% | 1.0% | 18.2% | 2.2% | 8.8% | 8.3% | 0.1% | ||||||
Figure 5.2 b) Tenure by devon town
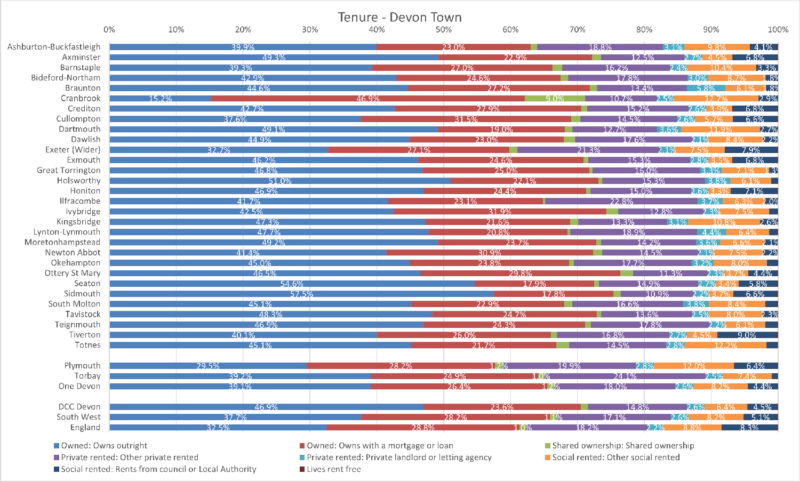
Cranbrook differs with lowest Owns Outright and the Highest mortgage and shared ownership figures. Holsworthy, Seaton & Sidmouth have more than 50% Owning Outright. The largest council homes areas Tiverton 9%, Exeter (Wider) 8% and Axminster 7%.
Map 5.2 c) Percentage of Social Housing by Output Area
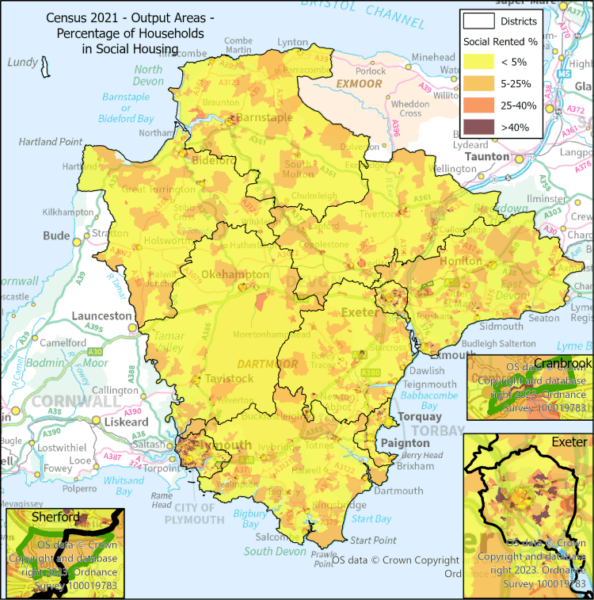
Exeter, Plymouth & Torbay have the largest numbers of Social Rented homes. Most larger towns have areas of Social Rented – Newton Abbot, Barnstaple, Sidmouth, Tavistock and Dartmouth.
Map 5.2 d) Percentage of Privately Rented Housing by Output Area

Exeter, Plymouth & Torbay have the largest numbers of Privately Rented homes. South Molton and North Molton are local hotspots.
5.3 Second Addresses
(ONS Table TS056)
Table 5.3 a) Second Addresses by district
| Area | No second address | Second address is in the UK | Second address is outside the UK | Usual Residents | No second address % | Second address is in the UK % | Second address is outside the UK % |
| East Devon | 144,536 | 5,097 | 1,195 | 150,828 | 95.8% | 3.4% | 0.8% |
| Exeter | 109,891 | 17,642 | 3,174 | 130,707 | 84.1% | 13.5% | 2.4% |
| Mid Devon | 79,639 | 2,672 | 541 | 82,852 | 96.1% | 3.2% | 0.7% |
| North Devon | 94,737 | 3,101 | 773 | 98,611 | 96.1% | 3.1% | 0.8% |
| South Hams | 83,911 | 3,564 | 1,152 | 88,627 | 94.7% | 4.0% | 1.3% |
| Teignbridge | 129,544 | 4,393 | 866 | 134,803 | 96.1% | 3.3% | 0.6% |
| Torridge | 65,535 | 2,137 | 442 | 68,114 | 96.2% | 3.1% | 0.6% |
| West Devon | 54,541 | 2,007 | 548 | 57,096 | 95.5% | 3.5% | 1.0% |
| Plymouth | 245,146 | 17,426 | 2,123 | 264,695 | 92.6% | 6.6% | 0.8% |
| Torbay | 134,225 | 3,971 | 1,128 | 139,324 | 96.3% | 2.9% | 0.8% |
| One Devon | 1,141,705 | 62,010 | 11,942 | 1,215,657 | 93.9% | 5.1% | 1.0% |
| DCC Devon | 762,334 | 40,613 | 8,691 | 811,638 | 93.9% | 5.0% | 1.1% |
| South West | 5,363,097 | 279,231 | 58,858 | 5,701,186 | 94.1% | 4.9% | 1.0% |
| England | 53,463,369 | 2,311,039 | 715,638 | 56,490,046 | 94.6% | 4.1% | 1.3% |
Figure 5.3 a) Second Addresses by district

Exeter has the most Second Addresses in the UK and Outside the UK in Devon.
Table 5.3 b) Second Addresses by devon town
| Devon Town | No second address | Second address is in the UK | Second address is outside the UK | Usual Residents | No second address % | Second address is in the UK % | Second address is outside the UK % |
| Ashburton-Buckfastleigh | 7,479 | 262 | 52 | 7,793 | 96.0% | 3.4% | 0.7% |
| Axminster | 15,558 | 550 | 135 | 16,243 | 95.8% | 3.4% | 0.8% |
| Barnstaple | 46,579 | 1,429 | 305 | 48,313 | 96.4% | 3.0% | 0.6% |
| Bideford-Northam | 37,380 | 1,368 | 267 | 39,015 | 95.8% | 3.5% | 0.7% |
| Braunton | 11,770 | 518 | 137 | 12,425 | 94.7% | 4.2% | 1.1% |
| Cranbrook | 7,465 | 321 | 28 | 7,814 | 95.5% | 4.1% | 0.4% |
| Crediton | 21,204 | 714 | 151 | 22,069 | 96.1% | 3.2% | 0.7% |
| Cullompton | 24,542 | 762 | 162 | 25,466 | 96.4% | 3.0% | 0.6% |
| Dartmouth | 9,888 | 484 | 203 | 10,575 | 93.5% | 4.6% | 1.9% |
| Dawlish | 16,003 | 537 | 97 | 16,637 | 96.2% | 3.2% | 0.6% |
| Exeter (Wider) | 132,446 | 18,362 | 3,350 | 154,158 | 85.9% | 11.9% | 2.2% |
| Exmouth | 46,883 | 1,849 | 445 | 49,177 | 95.3% | 3.8% | 0.9% |
| Great Torrington | 10,555 | 296 | 66 | 10,917 | 96.7% | 2.7% | 0.6% |
| Holsworthy | 16,873 | 463 | 116 | 17,452 | 96.7% | 2.7% | 0.7% |
| Honiton | 18,350 | 574 | 144 | 19,068 | 96.2% | 3.0% | 0.8% |
| Ilfracombe | 16,353 | 540 | 141 | 17,034 | 96.0% | 3.2% | 0.8% |
| Ivybridge | 35,077 | 1,484 | 383 | 36,944 | 94.9% | 4.0% | 1.0% |
| Kingsbridge | 16,885 | 712 | 253 | 17,850 | 94.6% | 4.0% | 1.4% |
| Lynton-Lynmouth | 1,544 | 47 | 17 | 1,608 | 96.0% | 2.9% | 1.1% |
| Moretonhampstead | 4,090 | 187 | 52 | 4,329 | 94.5% | 4.3% | 1.2% |
| Newton Abbot | 72,835 | 2,465 | 443 | 75,743 | 96.2% | 3.3% | 0.6% |
| Okehampton | 27,198 | 887 | 247 | 28,332 | 96.0% | 3.1% | 0.9% |
| Ottery St Mary | 15,088 | 494 | 117 | 15,699 | 96.1% | 3.1% | 0.7% |
| Seaton | 12,287 | 369 | 102 | 12,758 | 96.3% | 2.9% | 0.8% |
| Sidmouth | 16,050 | 503 | 124 | 16,677 | 96.2% | 3.0% | 0.7% |
| South Molton | 14,643 | 429 | 138 | 15,210 | 96.3% | 2.8% | 0.9% |
| Tavistock | 29,460 | 1,184 | 312 | 30,956 | 95.2% | 3.8% | 1.0% |
| Teignmouth | 18,028 | 635 | 143 | 18,806 | 95.9% | 3.4% | 0.8% |
| Tiverton | 37,752 | 1,308 | 251 | 39,311 | 96.0% | 3.3% | 0.6% |
| Totnes | 22,059 | 883 | 309 | 23,251 | 94.9% | 3.8% | 1.3% |
| Plymouth | 245,146 | 17,426 | 2,123 | 264,695 | 92.6% | 6.6% | 0.8% |
| Torbay | 134,225 | 3,971 | 1,128 | 139,324 | 96.3% | 2.9% | 0.8% |
| One Devon | 1,141,705 | 62,010 | 11,942 | 1,215,657 | 93.9% | 5.1% | 1.0% |
| Devon CC | 762,324 | 40,616 | 8,690 | 811,630 | 93.9% | 5.0% | 1.1% |
| South West | 5,363,097 | 279,231 | 58,858 | 5,701,186 | 94.1% | 4.9% | 1.0% |
| England | 53,463,369 | 2,311,039 | 715,638 | 56,490,046 | 94.6% | 4.1% | 1.3% |
Figure 5.3 b) Second Addresses by devon town

After Exeter (Wider), Dartmouth has 4.5% second address in the UK and 2% Outside the UK. Plymouth has 6.6% second homes in the UK.
5.4 Occupancy Rating
(ONS Table TS053)
Table 5.4 a) Occupancy Rating by district
| Area | Occupancy rating of rooms: +2 or more | Occupancy rating of rooms: +1 | Occupancy rating of rooms: 0 | Occupancy rating of rooms: -1 | Occupancy rating of rooms: -2 or less | Total Households | Occupancy rating of rooms: +2 or more % | Occupancy rating of rooms: +1 % | Occupancy rating of rooms: 0 % | Occupancy rating of rooms: -1 % | Occupancy rating of rooms: -2 or less % |
| East Devon | 35,534 | 19,017 | 10,408 | 1,614 | 218 | 66,791 | 53.2% | 28.5% | 15.6% | 2.4% | 0.3% |
| Exeter | 22,851 | 13,872 | 12,713 | 2,854 | 265 | 52,555 | 43.5% | 26.4% | 24.2% | 5.4% | 0.5% |
| Mid Devon | 18,657 | 9,496 | 6,298 | 1,058 | 124 | 35,633 | 52.4% | 26.6% | 17.7% | 3.0% | 0.3% |
| North Devon | 22,112 | 11,996 | 7,733 | 1,201 | 152 | 43,194 | 51.2% | 27.8% | 17.9% | 2.8% | 0.4% |
| South Hams | 21,604 | 10,457 | 6,248 | 919 | 107 | 39,335 | 54.9% | 26.6% | 15.9% | 2.3% | 0.3% |
| Teignbridge | 30,328 | 17,161 | 10,512 | 1,652 | 185 | 59,838 | 50.7% | 28.7% | 17.6% | 2.8% | 0.3% |
| Torridge | 16,473 | 8,650 | 4,564 | 688 | 82 | 30,457 | 54.1% | 28.4% | 15.0% | 2.3% | 0.3% |
| West Devon | 14,150 | 6,207 | 3,762 | 613 | 86 | 24,818 | 57.0% | 25.0% | 15.2% | 2.5% | 0.3% |
| Plymouth | 48,724 | 31,892 | 28,154 | 5,194 | 594 | 114,558 | 42.5% | 27.8% | 24.6% | 4.5% | 0.5% |
| Torbay | 26,812 | 19,082 | 13,778 | 2,991 | 331 | 62,994 | 42.6% | 30.3% | 21.9% | 4.7% | 0.5% |
| One Devon | 257,245 | 147,830 | 104,170 | 18,784 | 2,144 | 530,173 | 48.5% | 27.9% | 19.6% | 3.5% | 0.4% |
| Devon CC | 181,709 | 96,856 | 62,238 | 10,599 | 1,219 | 352,621 | 51.5% | 27.5% | 17.7% | 3.0% | 0.3% |
| South West | 1,211,666 | 649,395 | 481,334 | 94,339 | 12,147 | 2,448,881 | 49.5% | 26.5% | 19.7% | 3.9% | 0.5% |
| England | 10,602,583 | 6,273,147 | 5,050,108 | 1,246,173 | 264,073 | 23,436,084 | 45.2% | 26.8% | 21.5% | 5.3% | 1.1% |
Figure 5.4 a) Occupancy Rating by district

Ideally a home should have a Room Occupancy of 0 – Minus 1% or 2% are overcrowded, Positive 1% or 2% have spare capacity. Less than 1% in -2 category. Exeter has 5.4% in the -1 overcrowded category. In the two categories with spare capacity most Devon districts have around 80% of households – Exeter being the exception with 70%. Plymouth, Exeter and Torbay have more than 20% in the 0 category.
Table 5.4 b) Occupancy Rating by devon town
| Area | Occupancy rating of rooms: +2 or more | Occupancy rating of rooms: +1 | Occupancy rating of rooms: 0 | Occupancy rating of rooms: -1 | Occupancy rating of rooms: -2 or less | Total Households | Occupancy rating of rooms: +2 or more % | Occupancy rating of rooms: +1 % | Occupancy rating of rooms: 0 % | Occupancy rating of rooms: -1 % | Occupancy rating of rooms: -2 or less % |
| Ashburton-Buckfastleigh | 1,600 | 1,096 | 707 | 108 | 12 | 3,523 | 45.4% | 31.1% | 20.1% | 3.1% | 0.3% |
| Axminster | 4,055 | 1,930 | 1,044 | 165 | 14 | 7,208 | 56.3% | 26.8% | 14.5% | 2.3% | 0.2% |
| Barnstaple | 10,393 | 6,027 | 4,085 | 634 | 82 | 21,221 | 49.0% | 28.4% | 19.2% | 3.0% | 0.4% |
| Bideford-Northam | 9,179 | 5,323 | 2,922 | 409 | 46 | 17,879 | 51.3% | 29.8% | 16.3% | 2.3% | 0.3% |
| Braunton | 2,724 | 1,511 | 821 | 108 | 9 | 5,173 | 52.7% | 29.2% | 15.9% | 2.1% | 0.2% |
| Cranbrook | 1,198 | 1,000 | 619 | 87 | 13 | 2,917 | 41.1% | 34.3% | 21.2% | 3.0% | 0.4% |
| Crediton | 5,274 | 2,385 | 1,599 | 262 | 30 | 9,550 | 55.2% | 25.0% | 16.7% | 2.7% | 0.3% |
| Cullompton | 5,512 | 2,903 | 1,955 | 298 | 41 | 10,709 | 51.5% | 27.1% | 18.3% | 2.8% | 0.4% |
| Dartmouth | 2,772 | 1,324 | 743 | 122 | 9 | 4,970 | 55.8% | 26.6% | 14.9% | 2.5% | 0.2% |
| Dawlish | 3,508 | 2,303 | 1,604 | 268 | 35 | 7,718 | 45.5% | 29.8% | 20.8% | 3.5% | 0.5% |
| Exeter (Wider) | 28,483 | 16,427 | 14,161 | 3,061 | 309 | 62,441 | 45.6% | 26.3% | 22.7% | 4.9% | 0.5% |
| Exmouth | 11,156 | 6,317 | 3,744 | 572 | 73 | 21,862 | 51.0% | 28.9% | 17.1% | 2.6% | 0.3% |
| Great Torrington | 2,668 | 1,377 | 622 | 98 | 10 | 4,775 | 55.9% | 28.8% | 13.0% | 2.1% | 0.2% |
| Holsworthy | 4,522 | 1,816 | 946 | 168 | 26 | 7,478 | 60.5% | 24.3% | 12.7% | 2.2% | 0.3% |
| Honiton | 4,412 | 2,588 | 1,331 | 202 | 27 | 8,560 | 51.5% | 30.2% | 15.5% | 2.4% | 0.3% |
| Ilfracombe | 3,813 | 1,984 | 1,565 | 267 | 39 | 7,668 | 49.7% | 25.9% | 20.4% | 3.5% | 0.5% |
| Ivybridge | 9,048 | 4,148 | 2,246 | 304 | 42 | 15,788 | 57.3% | 26.3% | 14.2% | 1.9% | 0.3% |
| Kingsbridge | 4,391 | 2,139 | 1,414 | 190 | 24 | 8,158 | 53.8% | 26.2% | 17.3% | 2.3% | 0.3% |
| Lynton-Lynmouth | 437 | 195 | 109 | 11 | 0 | 752 | 58.1% | 25.9% | 14.5% | 1.5% | 0.0% |
| Moretonhampstead | 1,212 | 473 | 215 | 40 | 3 | 1,943 | 62.4% | 24.3% | 11.1% | 2.1% | 0.2% |
| Newton Abbot | 16,781 | 9,450 | 5,644 | 847 | 97 | 32,819 | 51.1% | 28.8% | 17.2% | 2.6% | 0.3% |
| Okehampton | 6,846 | 3,195 | 1,894 | 296 | 38 | 12,269 | 55.8% | 26.0% | 15.4% | 2.4% | 0.3% |
| Ottery St Mary | 3,923 | 1,732 | 828 | 152 | 14 | 6,649 | 59.0% | 26.0% | 12.5% | 2.3% | 0.2% |
| Seaton | 3,272 | 1,782 | 992 | 144 | 12 | 6,202 | 52.8% | 28.7% | 16.0% | 2.3% | 0.2% |
| Sidmouth | 4,351 | 2,378 | 1,049 | 165 | 21 | 7,964 | 54.6% | 29.9% | 13.2% | 2.1% | 0.3% |
| South Molton | 3,671 | 1,861 | 957 | 139 | 19 | 6,647 | 55.2% | 28.0% | 14.4% | 2.1% | 0.3% |
| Tavistock | 7,875 | 3,293 | 1,991 | 328 | 50 | 13,537 | 58.2% | 24.3% | 14.7% | 2.4% | 0.4% |
| Teignmouth | 4,383 | 2,450 | 1,658 | 302 | 30 | 8,823 | 49.7% | 27.8% | 18.8% | 3.4% | 0.3% |
| Tiverton | 8,869 | 4,603 | 2,936 | 545 | 57 | 17,010 | 52.1% | 27.1% | 17.3% | 3.2% | 0.3% |
| Totnes | 5,399 | 2,840 | 1,848 | 308 | 30 | 10,425 | 51.8% | 27.2% | 17.7% | 3.0% | 0.3% |
| Plymouth | 48,724 | 31,892 | 28,154 | 5,194 | 594 | 114,558 | 42.5% | 27.8% | 24.6% | 4.5% | 0.5% |
| Torbay | 26,812 | 19,082 | 13,778 | 2,991 | 331 | 62,994 | 42.6% | 30.3% | 21.9% | 4.7% | 0.5% |
| One Devon | 257,245 | 147,830 | 104,170 | 18,784 | 2,144 | 530,173 | 48.5% | 27.9% | 19.6% | 3.5% | 0.4% |
| Devon CC | 41,743 | 20,939 | 12,259 | 2,083 | 233 | 77,257 | 54.0% | 27.1% | 15.9% | 2.7% | 0.3% |
| South West | 1,211,666 | 649,395 | 481,334 | 94,339 | 12,147 | 2,448,881 | 49.5% | 26.5% | 19.7% | 3.9% | 0.5% |
| England | 10,602,583 | 6,273,147 | 5,050,108 | 1,246,173 | 264,073 | 23,436,084 | 45.2% | 26.8% | 21.5% | 5.3% | 1.1% |
Figure 5.4 b) Occupancy Rating by devon town

In the -1 overcrowded category Exeter (Wider) (4.9%), Ilfracombe (3.5%), Dawlish (3.5%) and Teignmouth (3.4%) are all above the Devon CC figure of 2.7%
Map 5.4 c) Occupancy Rating of -1 or -2 by Output Area
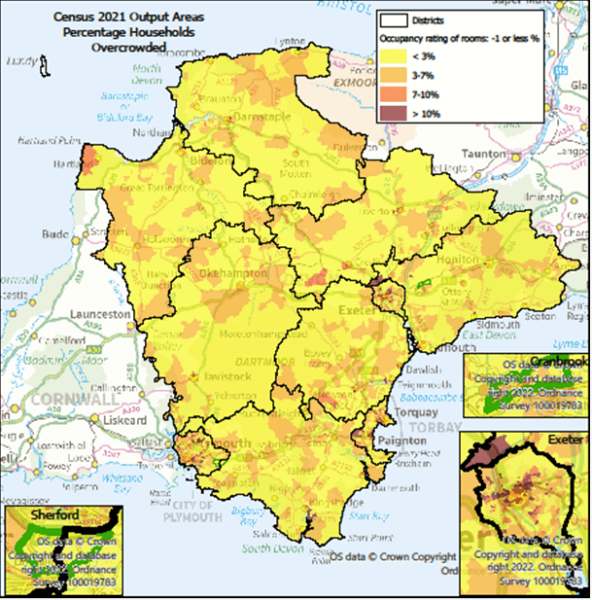
Exeter, Plymouth and Paignton seem to have the greatest areas of overcrowding.
5.5 Central Heating
(ONS Table TS046)
Table 5.5 a) Central Heating by district
| Area | Mains gas only | Electric only | Oil only | Other central heating only | Renewable energy only | Solid fuel only | Tank or bottled gas only | Two or more types of central heating (including renewable energy) | Two or more types of central heating (not including renewable energy) | Wood only | District or communal heat networks only | No central heating | Total Households |
| East Devon | 41,536 | 6,439 | 5,787 | 237 | 713 | 198 | 1,251 | 711 | 6,283 | 320 | 2,207 | 1,105 | 66,787 |
| Exeter | 40,161 | 6,029 | 135 | 306 | 171 | 10 | 203 | 312 | 3,468 | 22 | 579 | 1,157 | 52,553 |
| Mid Devon | 18,534 | 3,415 | 5,665 | 152 | 485 | 157 | 1,141 | 486 | 4,286 | 363 | 31 | 917 | 35,632 |
| North Devon | 26,309 | 3,949 | 4,356 | 198 | 597 | 98 | 865 | 592 | 4,770 | 341 | 75 | 1,047 | 43,197 |
| South Hams | 20,753 | 4,435 | 5,301 | 119 | 703 | 93 | 1,219 | 766 | 4,626 | 295 | 76 | 949 | 39,335 |
| Teignbridge | 40,230 | 5,485 | 3,801 | 214 | 426 | 86 | 1,450 | 574 | 5,882 | 338 | 73 | 1,279 | 59,838 |
| Torridge | 13,734 | 3,400 | 5,986 | 116 | 525 | 152 | 1,094 | 421 | 3,661 | 352 | 91 | 925 | 30,457 |
| West Devon | 11,923 | 2,143 | 4,647 | 88 | 365 | 100 | 863 | 351 | 3,337 | 305 | 27 | 669 | 24,818 |
| Plymouth | 92,634 | 8,511 | 108 | 808 | 100 | 46 | 501 | 647 | 8,596 | 35 | 426 | 2,146 | 114,558 |
| Torbay | 47,951 | 7,518 | 138 | 395 | 87 | 20 | 269 | 272 | 4,592 | 36 | 296 | 1,420 | 62,994 |
| One Devon | 353,765 | 51,324 | 35,924 | 2,633 | 4,172 | 960 | 8,856 | 5,132 | 49,501 | 2,407 | 3,881 | 11,614 | 530,169 |
| DCC Devon | 213,180 | 35,295 | 35,678 | 1,430 | 3,985 | 894 | 8,086 | 4,213 | 36,313 | 2,336 | 3,159 | 8,048 | 352,617 |
| South West | 1,638,032 | 253,309 | 173,493 | 12,668 | 18,646 | 5,408 | 39,912 | 20,509 | 224,308 | 7,898 | 12,142 | 42,552 | 2,448,877 |
| England | 17,334,040 | 2,041,989 | 760,470 | 217,543 | 92,396 | 41,967 | 232,512 | 126,690 | 1,989,259 | 31,032 | 216,543 | 351,632 | 23,436,073 |
| Area | Mains gas only | Electric only | Oil only | Other central heating only | Renewable energy only | Solid fuel only | Tank or bottled gas only | Two or more types of central heating (including renewable energy) | Two or more types of central heating (not including renewable energy) | Wood only | District or communal heat networks only | No central heating |
| East Devon | 62.2% | 9.6% | 8.7% | 0.4% | 1.1% | 0.3% | 1.9% | 1.1% | 9.4% | 0.5% | 3.3% | 1.7% |
| Exeter | 76.4% | 11.5% | 0.3% | 0.6% | 0.3% | 0.0% | 0.4% | 0.6% | 6.6% | 0.0% | 1.1% | 2.2% |
| Mid Devon | 52.0% | 9.6% | 15.9% | 0.4% | 1.4% | 0.4% | 3.2% | 1.4% | 12.0% | 1.0% | 0.1% | 2.6% |
| North Devon | 60.9% | 9.1% | 10.1% | 0.5% | 1.4% | 0.2% | 2.0% | 1.4% | 11.0% | 0.8% | 0.2% | 2.4% |
| South Hams | 52.8% | 11.3% | 13.5% | 0.3% | 1.8% | 0.2% | 3.1% | 1.9% | 11.8% | 0.7% | 0.2% | 2.4% |
| Teignbridge | 67.2% | 9.2% | 6.4% | 0.4% | 0.7% | 0.1% | 2.4% | 1.0% | 9.8% | 0.6% | 0.1% | 2.1% |
| Torridge | 45.1% | 11.2% | 19.7% | 0.4% | 1.7% | 0.5% | 3.6% | 1.4% | 12.0% | 1.2% | 0.3% | 3.0% |
| West Devon | 48.0% | 8.6% | 18.7% | 0.4% | 1.5% | 0.4% | 3.5% | 1.4% | 13.4% | 1.2% | 0.1% | 2.7% |
| Plymouth | 80.9% | 7.4% | 0.1% | 0.7% | 0.1% | 0.0% | 0.4% | 0.6% | 7.5% | 0.0% | 0.4% | 1.9% |
| Torbay | 76.1% | 11.9% | 0.2% | 0.6% | 0.1% | 0.0% | 0.4% | 0.4% | 7.3% | 0.1% | 0.5% | 2.3% |
| One Devon | 66.7% | 9.7% | 6.8% | 0.5% | 0.8% | 0.2% | 1.7% | 1.0% | 9.3% | 0.5% | 0.7% | 2.2% |
| DCC Devon | 60.5% | 10.0% | 10.1% | 0.4% | 1.1% | 0.3% | 2.3% | 1.2% | 10.3% | 0.7% | 0.9% | 2.3% |
| South West | 66.9% | 10.3% | 7.1% | 0.5% | 0.8% | 0.2% | 1.6% | 0.8% | 9.2% | 0.3% | 0.5% | 1.7% |
| England | 74.0% | 8.7% | 3.2% | 0.9% | 0.4% | 0.2% | 1.0% | 0.5% | 8.5% | 0.1% | 0.9% | 1.5% |
Figure 5.5 a) Central Heating by district

3% of homes in Torridge and 2.7% in West Devon have no central heating. Most central heating is gas with 10% electricity and another 10% Oil – though the latter is higher in the more rural districts. A further 10% have two types of central heating.
Table 5.5 b) Central Heating by devon town
| Area | Mains gas only | Electric only | Oil only | Other central heating only | Renewable energy only | Solid fuel only | Tank or bottled gas only | Two or more types of central heating (including renewable energy) | Two or more types of central heating (not including renewable energy) | Wood only | District or communal heat networks only | No central heating | Total Households |
| Ashburton-Buckfastleigh | 2,395 | 303 | 148 | 20 | 23 | 5 | 80 | 35 | 411 | 23 | 2 | 79 | 3,524 |
| Axminster | 3,368 | 616 | 1,521 | 31 | 127 | 46 | 192 | 133 | 927 | 72 | 17 | 157 | 7,207 |
| Barnstaple | 14,786 | 1,667 | 1,274 | 97 | 214 | 32 | 258 | 269 | 2,071 | 104 | 58 | 384 | 21,214 |
| Bideford-Northam | 11,151 | 1,908 | 1,641 | 58 | 170 | 52 | 315 | 191 | 1,786 | 113 | 52 | 441 | 17,878 |
| Braunton | 3,399 | 377 | 407 | 16 | 102 | 7 | 143 | 72 | 533 | 28 | 6 | 84 | 5,174 |
| Cranbrook | 392 | 493 | 193 | 40 | 92 | 7 | 73 | 31 | 155 | 9 | 1,411 | 26 | 2,922 |
| Crediton | 3,906 | 1,071 | 2,014 | 35 | 150 | 66 | 393 | 167 | 1,278 | 144 | 9 | 314 | 9,547 |
| Cullompton | 5,813 | 981 | 1,621 | 51 | 203 | 28 | 332 | 155 | 1,207 | 92 | 5 | 213 | 10,701 |
| Dartmouth | 1,991 | 729 | 947 | 12 | 134 | 16 | 227 | 80 | 608 | 36 | 28 | 156 | 4,964 |
| Dawlish | 5,385 | 1,010 | 178 | 28 | 39 | 4 | 166 | 50 | 624 | 19 | 8 | 214 | 7,725 |
| Exeter (Wider) | 44,804 | 6,898 | 1,611 | 343 | 326 | 43 | 742 | 431 | 4,609 | 106 | 1,142 | 1,339 | 62,394 |
| Exmouth | 16,748 | 1,842 | 524 | 70 | 81 | 26 | 162 | 174 | 1,786 | 38 | 84 | 321 | 21,856 |
| Great Torrington | 2,322 | 327 | 926 | 24 | 68 | 27 | 134 | 62 | 614 | 79 | 28 | 174 | 4,785 |
| Holsworthy | 455 | 1,118 | 3,226 | 27 | 260 | 70 | 487 | 167 | 1,211 | 141 | 10 | 304 | 7,476 |
| Honiton | 4,452 | 1,223 | 1,175 | 21 | 145 | 42 | 202 | 105 | 914 | 90 | 32 | 165 | 8,566 |
| Ilfracombe | 5,220 | 810 | 387 | 43 | 64 | 9 | 83 | 69 | 729 | 30 | 6 | 220 | 7,670 |
| Ivybridge | 9,803 | 1,178 | 1,617 | 48 | 157 | 37 | 494 | 236 | 1,791 | 95 | 19 | 322 | 15,797 |
| Kingsbridge | 3,005 | 1,397 | 1,717 | 30 | 256 | 20 | 235 | 191 | 1,007 | 56 | 18 | 225 | 8,157 |
| Lynton-Lynmouth | 82 | 182 | 280 | 3 | 15 | 3 | 19 | 11 | 100 | 10 | 0 | 45 | 750 |
| Moretonhampstead | 611 | 150 | 505 | 8 | 50 | 7 | 86 | 49 | 360 | 41 | 2 | 75 | 1,944 |
| Newton Abbot | 23,047 | 2,446 | 1,914 | 123 | 199 | 60 | 679 | 312 | 3,174 | 177 | 52 | 623 | 32,806 |
| Okehampton | 4,446 | 1,283 | 3,017 | 57 | 246 | 61 | 603 | 201 | 1,750 | 187 | 19 | 408 | 12,278 |
| Ottery St Mary | 3,642 | 567 | 1,009 | 20 | 96 | 39 | 303 | 84 | 700 | 42 | 17 | 123 | 6,642 |
| Seaton | 4,391 | 671 | 251 | 23 | 33 | 4 | 48 | 65 | 545 | 20 | 38 | 112 | 6,201 |
| Sidmouth | 6,138 | 595 | 255 | 18 | 45 | 5 | 69 | 57 | 623 | 16 | 49 | 95 | 7,965 |
| South Molton | 2,454 | 683 | 1,469 | 34 | 171 | 30 | 258 | 133 | 1,038 | 132 | 6 | 245 | 6,653 |
| Tavistock | 7,580 | 949 | 1,976 | 42 | 161 | 46 | 437 | 159 | 1,754 | 141 | 12 | 287 | 13,544 |
| Teignmouth | 6,514 | 1,082 | 157 | 22 | 36 | 4 | 55 | 64 | 701 | 16 | 5 | 174 | 8,830 |
| Tiverton | 8,920 | 1,592 | 2,694 | 79 | 178 | 79 | 543 | 203 | 2,098 | 166 | 15 | 449 | 17,016 |
| Totnes | 5,950 | 1,138 | 1,018 | 37 | 159 | 17 | 268 | 256 | 1,226 | 113 | 10 | 245 | 10,437 |
| Plymouth | 92,634 | 8,511 | 108 | 808 | 100 | 46 | 501 | 647 | 8,596 | 35 | 426 | 2,146 | 114,558 |
| Torbay | 47,951 | 7,518 | 138 | 395 | 87 | 20 | 269 | 272 | 4,592 | 36 | 296 | 1,420 | 62,994 |
| One Devon | 353,765 | 51,324 | 35,924 | 2,633 | 4,172 | 960 | 8,856 | 5,132 | 49,501 | 2,407 | 3,881 | 11,614 | 530,169 |
| DCC Devon | 7,277 | 8,829 | 275 | 879 | 224 | 1,981 | 1,021 | 8,685 | 646 | 152 | 1,730 | 77,288 | 352,617 |
| South West | 1,638,032 | 253,309 | 173,493 | 12,668 | 18,646 | 5,408 | 39,912 | 20,509 | 224,308 | 7,898 | 12,142 | 42,552 | 2,448,877 |
| England | 17,334,040 | 2,041,989 | 760,470 | 217,543 | 92,396 | 41,967 | 232,512 | 126,690 | 1,989,259 | 31,032 | 216,543 | 351,632 | 23,436,073 |
| Area | Mains gas only | Electric only | Oil only | Other central heating only | Renewable energy only | Solid fuel only | Tank or bottled gas only | Two or more types of central heating (including renewable energy) | Two or more types of central heating (not including renewable energy) | Wood only | District or communal heat networks only | No central heating |
| Ashburton-Buckfastleigh | 68.0% | 8.6% | 4.2% | 0.6% | 0.7% | 0.1% | 2.3% | 1.0% | 11.7% | 0.7% | 0.1% | 2.2% |
| Axminster | 46.7% | 8.5% | 21.1% | 0.4% | 1.8% | 0.6% | 2.7% | 1.8% | 12.9% | 1.0% | 0.2% | 2.2% |
| Barnstaple | 69.7% | 7.9% | 6.0% | 0.5% | 1.0% | 0.2% | 1.2% | 1.3% | 9.8% | 0.5% | 0.3% | 1.8% |
| Bideford-Northam | 62.4% | 10.7% | 9.2% | 0.3% | 1.0% | 0.3% | 1.8% | 1.1% | 10.0% | 0.6% | 0.3% | 2.5% |
| Braunton | 65.7% | 7.3% | 7.9% | 0.3% | 2.0% | 0.1% | 2.8% | 1.4% | 10.3% | 0.5% | 0.1% | 1.6% |
| Cranbrook | 13.4% | 16.9% | 6.6% | 1.4% | 3.1% | 0.2% | 2.5% | 1.1% | 5.3% | 0.3% | 48.3% | 0.9% |
| Crediton | 40.9% | 11.2% | 21.1% | 0.4% | 1.6% | 0.7% | 4.1% | 1.7% | 13.4% | 1.5% | 0.1% | 3.3% |
| Cullompton | 54.3% | 9.2% | 15.1% | 0.5% | 1.9% | 0.3% | 3.1% | 1.4% | 11.3% | 0.9% | 0.0% | 2.0% |
| Dartmouth | 40.1% | 14.7% | 19.1% | 0.2% | 2.7% | 0.3% | 4.6% | 1.6% | 12.2% | 0.7% | 0.6% | 3.1% |
| Dawlish | 69.7% | 13.1% | 2.3% | 0.4% | 0.5% | 0.1% | 2.1% | 0.6% | 8.1% | 0.2% | 0.1% | 2.8% |
| Exeter (Wider) | 71.8% | 11.1% | 2.6% | 0.5% | 0.5% | 0.1% | 1.2% | 0.7% | 7.4% | 0.2% | 1.8% | 2.1% |
| Exmouth | 76.6% | 8.4% | 2.4% | 0.3% | 0.4% | 0.1% | 0.7% | 0.8% | 8.2% | 0.2% | 0.4% | 1.5% |
| Great Torrington | 48.5% | 6.8% | 19.4% | 0.5% | 1.4% | 0.6% | 2.8% | 1.3% | 12.8% | 1.7% | 0.6% | 3.6% |
| Holsworthy | 6.1% | 15.0% | 43.2% | 0.4% | 3.5% | 0.9% | 6.5% | 2.2% | 16.2% | 1.9% | 0.1% | 4.1% |
| Honiton | 52.0% | 14.3% | 13.7% | 0.2% | 1.7% | 0.5% | 2.4% | 1.2% | 10.7% | 1.1% | 0.4% | 1.9% |
| Ilfracombe | 68.1% | 10.6% | 5.0% | 0.6% | 0.8% | 0.1% | 1.1% | 0.9% | 9.5% | 0.4% | 0.1% | 2.9% |
| Ivybridge | 62.1% | 7.5% | 10.2% | 0.3% | 1.0% | 0.2% | 3.1% | 1.5% | 11.3% | 0.6% | 0.1% | 2.0% |
| Kingsbridge | 36.8% | 17.1% | 21.0% | 0.4% | 3.1% | 0.2% | 2.9% | 2.3% | 12.3% | 0.7% | 0.2% | 2.8% |
| Lynton-Lynmouth | 10.9% | 24.3% | 37.3% | 0.4% | 2.0% | 0.4% | 2.5% | 1.5% | 13.3% | 1.3% | 0.0% | 6.0% |
| Moretonhampstead | 31.4% | 7.7% | 26.0% | 0.4% | 2.6% | 0.4% | 4.4% | 2.5% | 18.5% | 2.1% | 0.1% | 3.9% |
| Newton Abbot | 70.3% | 7.5% | 5.8% | 0.4% | 0.6% | 0.2% | 2.1% | 1.0% | 9.7% | 0.5% | 0.2% | 1.9% |
| Okehampton | 36.2% | 10.4% | 24.6% | 0.5% | 2.0% | 0.5% | 4.9% | 1.6% | 14.3% | 1.5% | 0.2% | 3.3% |
| Ottery St Mary | 54.8% | 8.5% | 15.2% | 0.3% | 1.4% | 0.6% | 4.6% | 1.3% | 10.5% | 0.6% | 0.3% | 1.9% |
| Seaton | 70.8% | 10.8% | 4.0% | 0.4% | 0.5% | 0.1% | 0.8% | 1.0% | 8.8% | 0.3% | 0.6% | 1.8% |
| Sidmouth | 77.1% | 7.5% | 3.2% | 0.2% | 0.6% | 0.1% | 0.9% | 0.7% | 7.8% | 0.2% | 0.6% | 1.2% |
| South Molton | 36.9% | 10.3% | 22.1% | 0.5% | 2.6% | 0.5% | 3.9% | 2.0% | 15.6% | 2.0% | 0.1% | 3.7% |
| Tavistock | 56.0% | 7.0% | 14.6% | 0.3% | 1.2% | 0.3% | 3.2% | 1.2% | 13.0% | 1.0% | 0.1% | 2.1% |
| Teignmouth | 73.8% | 12.3% | 1.8% | 0.2% | 0.4% | 0.0% | 0.6% | 0.7% | 7.9% | 0.2% | 0.1% | 2.0% |
| Tiverton | 52.4% | 9.4% | 15.8% | 0.5% | 1.0% | 0.5% | 3.2% | 1.2% | 12.3% | 1.0% | 0.1% | 2.6% |
| Totnes | 57.0% | 10.9% | 9.8% | 0.4% | 1.5% | 0.2% | 2.6% | 2.5% | 11.7% | 1.1% | 0.1% | 2.3% |
| Plymouth | 80.9% | 7.4% | 0.1% | 0.7% | 0.1% | 0.0% | 0.4% | 0.6% | 7.5% | 0.0% | 0.4% | 1.9% |
| Torbay | 76.1% | 11.9% | 0.2% | 0.6% | 0.1% | 0.0% | 0.4% | 0.4% | 7.3% | 0.1% | 0.5% | 2.3% |
| One Devon | 66.7% | 9.7% | 6.8% | 0.5% | 0.8% | 0.2% | 1.7% | 1.0% | 9.3% | 0.5% | 0.7% | 2.2% |
| DCC Devon | 60.5% | 10.0% | 10.1% | 0.4% | 1.1% | 0.3% | 2.3% | 1.2% | 10.3% | 0.7% | 0.9% | 2.3% |
| South West | 66.9% | 10.3% | 7.1% | 0.5% | 0.8% | 0.2% | 1.6% | 0.8% | 9.2% | 0.3% | 0.5% | 1.7% |
| England | 74.0% | 8.7% | 3.2% | 0.9% | 0.4% | 0.2% | 1.0% | 0.5% | 8.5% | 0.1% | 0.9% | 1.5% |
Figure 5.5 b) Central Heating by devon town

48% of Cranbrook has District or Communal heat networks (Exeter (wider) has over 1,000 households as well). 43% Of Holsworthy use Oil Only and several rural areas have more than 20%. Households with two types of Central Heating average 10% in DCC Devon but Moretonhampstead has 18.5% and Holsworthy and South Molton 16%.
Map 5.5 c) No Central Heating by Output Area

Households with no central heating appear to be in rural areas mainly in Torridge and North Devon districts.
5.6 Number or Cars or Vans
(ONS Table TS045)
Table 5.6 a) Car/Van access by district
| Area | No cars or vans in household | 1 car or van in household | 2 cars or vans in household | 3 or more cars or vans in household | Total Households | No cars or vans in household% | 1 car or van in household % | 2 cars or vans in household % | 3 or more cars or vans in household % |
| East Devon | 9,065 | 28,160 | 21,248 | 8,315 | 66,788 | 13.6% | 42.2% | 31.8% | 12.4% |
| Exeter | 13,346 | 23,839 | 11,833 | 3,536 | 52,554 | 25.4% | 45.4% | 22.5% | 6.7% |
| Mid Devon | 4,653 | 14,074 | 11,583 | 5,323 | 35,633 | 13.1% | 39.5% | 32.5% | 14.9% |
| North Devon | 7,331 | 17,936 | 12,743 | 5,187 | 43,197 | 17.0% | 41.5% | 29.5% | 12.0% |
| South Hams | 4,607 | 15,753 | 13,311 | 5,664 | 39,335 | 11.7% | 40.0% | 33.8% | 14.4% |
| Teignbridge | 8,626 | 24,603 | 18,787 | 7,822 | 59,838 | 14.4% | 41.1% | 31.4% | 13.1% |
| Torridge | 4,182 | 12,784 | 9,311 | 4,179 | 30,456 | 13.7% | 42.0% | 30.6% | 13.7% |
| West Devon | 3,007 | 10,047 | 8,118 | 3,646 | 24,818 | 12.1% | 40.5% | 32.7% | 14.7% |
| Plymouth | 28,534 | 49,883 | 28,065 | 8,076 | 114,558 | 24.9% | 43.5% | 24.5% | 7.0% |
| Torbay | 14,635 | 27,302 | 15,426 | 5,629 | 62,992 | 23.2% | 43.3% | 24.5% | 8.9% |
| One Devon | 97,986 | 224,381 | 150,425 | 57,377 | 530,169 | 18.5% | 42.3% | 28.4% | 10.8% |
| Devon CC | 54,817 | 147,196 | 106,934 | 43,672 | 352,619 | 15.5% | 41.7% | 30.3% | 12.4% |
| South West | 410,920 | 1,022,391 | 732,438 | 283,132 | 2,448,881 | 16.8% | 41.7% | 29.9% | 11.6% |
| England | 5,516,098 | 9,674,645 | 6,106,970 | 2,138,372 | 23,436,085 | 23.5% | 41.3% | 26.1% | 9.1% |
Figure 5.6 a) Car/Van access by district

No access to cars/vans averages 19% in the One Devon area – Exeter, Plymouth & Torbay are much higher presumably as there are other alternatives forms of transport.
Table 5.6 b) Car/Van access by devon town
| Area | No cars or vans in household | 1 car or van in household | 2 cars or vans in household | 3 or more cars or vans in household | Total Households | No cars or vans in household % | 1 car or van in household % | 2 cars or vans in household % | 3 or more cars or vans in household % |
| Ashburton-Buckfastleigh | 482 | 1,565 | 1,055 | 415 | 3,517 | 13.7% | 44.5% | 30.0% | 11.8% |
| Axminster | 817 | 2,888 | 2,430 | 1,069 | 7,204 | 11.3% | 40.1% | 33.7% | 14.8% |
| Barnstaple | 4,027 | 8,955 | 6,008 | 2,233 | 21,223 | 19.0% | 42.2% | 28.3% | 10.5% |
| Bideford-Northam | 2,951 | 7,791 | 5,180 | 1,963 | 17,885 | 16.5% | 43.6% | 29.0% | 11.0% |
| Braunton | 675 | 2,066 | 1,730 | 698 | 5,169 | 13.1% | 40.0% | 33.5% | 13.5% |
| Cranbrook | 188 | 1,227 | 1,209 | 295 | 2,919 | 6.4% | 42.0% | 41.4% | 10.1% |
| Crediton | 1,153 | 3,680 | 3,186 | 1,528 | 9,547 | 12.1% | 38.5% | 33.4% | 16.0% |
| Cullompton | 1,133 | 4,063 | 3,765 | 1,740 | 10,701 | 10.6% | 38.0% | 35.2% | 16.3% |
| Dartmouth | 756 | 2,087 | 1,526 | 597 | 4,966 | 15.2% | 42.0% | 30.7% | 12.0% |
| Dawlish | 1,524 | 3,450 | 2,017 | 729 | 7,720 | 19.7% | 44.7% | 26.1% | 9.4% |
| Exeter (Wider) | 14,173 | 27,700 | 15,472 | 5,078 | 62,423 | 22.7% | 44.4% | 24.8% | 8.1% |
| Exmouth | 3,637 | 9,509 | 6,362 | 2,354 | 21,862 | 16.6% | 43.5% | 29.1% | 10.8% |
| Great Torrington | 581 | 1,970 | 1,517 | 707 | 4,775 | 12.2% | 41.3% | 31.8% | 14.8% |
| Holsworthy | 617 | 2,884 | 2,534 | 1,442 | 7,477 | 8.3% | 38.6% | 33.9% | 19.3% |
| Honiton | 1,156 | 3,654 | 2,549 | 1,202 | 8,561 | 13.5% | 42.7% | 29.8% | 14.0% |
| Ilfracombe | 1,601 | 3,238 | 1,983 | 846 | 7,668 | 20.9% | 42.2% | 25.9% | 11.0% |
| Ivybridge | 1,352 | 5,968 | 5,937 | 2,531 | 15,788 | 8.6% | 37.8% | 37.6% | 16.0% |
| Kingsbridge | 988 | 3,253 | 2,716 | 1,206 | 8,163 | 12.1% | 39.9% | 33.3% | 14.8% |
| Lynton-Lynmouth | 109 | 341 | 215 | 86 | 751 | 14.5% | 45.4% | 28.6% | 11.5% |
| Moretonhampstead | 175 | 716 | 707 | 349 | 1,947 | 9.0% | 36.8% | 36.3% | 17.9% |
| Newton Abbot | 4,277 | 13,125 | 10,768 | 4,652 | 32,822 | 13.0% | 40.0% | 32.8% | 14.2% |
| Okehampton | 1,397 | 4,946 | 3,985 | 1,946 | 12,274 | 11.4% | 40.3% | 32.5% | 15.9% |
| Ottery St Mary | 597 | 2,388 | 2,604 | 1,061 | 6,650 | 9.0% | 35.9% | 39.2% | 16.0% |
| Seaton | 969 | 2,884 | 1,731 | 616 | 6,200 | 15.6% | 46.5% | 27.9% | 9.9% |
| Sidmouth | 1,317 | 3,615 | 2,241 | 790 | 7,963 | 16.5% | 45.4% | 28.1% | 9.9% |
| South Molton | 800 | 2,656 | 2,185 | 1,013 | 6,654 | 12.0% | 39.9% | 32.8% | 15.2% |
| Tavistock | 1,687 | 5,512 | 4,465 | 1,870 | 13,534 | 12.5% | 40.7% | 33.0% | 13.8% |
| Teignmouth | 1,709 | 3,721 | 2,482 | 911 | 8,823 | 19.4% | 42.2% | 28.1% | 10.3% |
| Tiverton | 2,465 | 6,873 | 5,260 | 2,417 | 17,015 | 14.5% | 40.4% | 30.9% | 14.2% |
| Totnes | 1,512 | 4,446 | 3,137 | 1,329 | 10,424 | 14.5% | 42.7% | 30.1% | 12.7% |
| Plymouth | 28,534 | 49,883 | 28,065 | 8,076 | 114,558 | 24.9% | 43.5% | 24.5% | 7.0% |
| Torbay | 14,635 | 27,302 | 15,426 | 5,629 | 62,992 | 23.2% | 43.3% | 24.5% | 8.9% |
| One Devon | 97,986 | 224,381 | 150,425 | 57,377 | 530,169 | 18.5% | 42.3% | 28.4% | 10.8% |
| Devon CC Area | 54,825 | 147,171 | 106,956 | 43,673 | 352,625 | 15.5% | 41.7% | 30.3% | 12.4% |
| South West | 410,920 | 1,022,391 | 732,438 | 283,132 | 2,448,881 | 16.8% | 41.7% | 29.9% | 11.6% |
| England | 5,516,098 | 9,674,645 | 6,106,970 | 2,138,372 | 23,436,085 | 23.5% | 41.3% | 26.1% | 9.1% |
Figure 5.6 b) Car/Van access by devon town
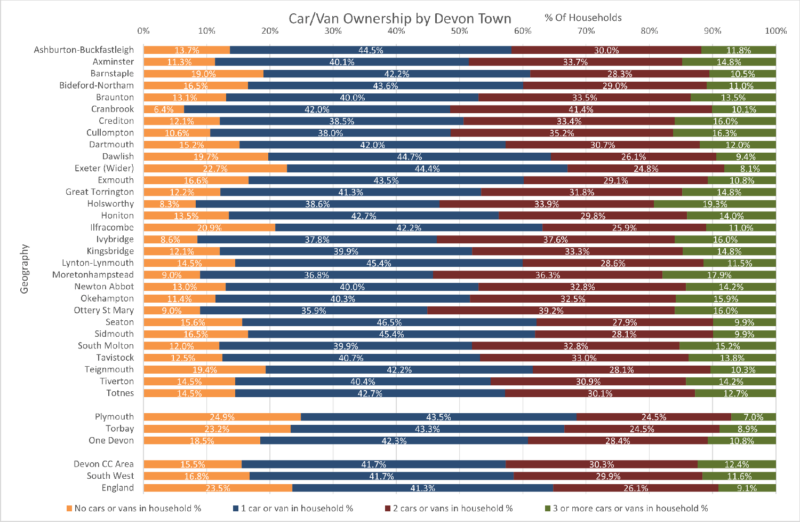
Apart from the larger urban areas the largest percentages with no access to cars/vans are Ilfracombe (21%), Dawlish (20%), Teignmouth (19%) and Barnstaple (19%). Devon CC Area has 12.4% households in the 3+ category – Holsworthy has 19% and Moretonhampstead 18%.
Map 5.6 c) No Car/Van access by output area
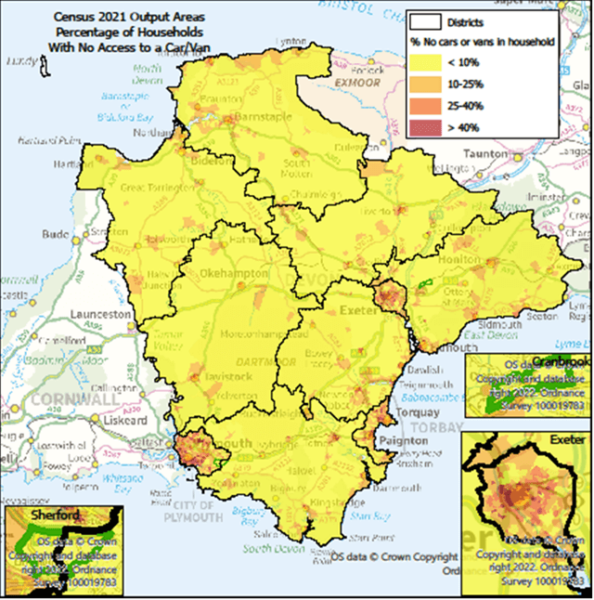
Most of the areas with no access to cars/vans are in Exeter, Plymouth & Torbay.
6 Health
6.1 Disability
(ONS Tables TS038 & TS038ASP)
Table 6.1 a) Disability by district
| Area | Disabled under the Equality Act: Day-to-day activities limited a lot | Disabled under the Equality Act: Day-to-day activities limited a little | Not disabled under the Equality Act: Has long term physical or mental health condition but day-to-day activities are not limited | Not disabled under the Equality Act: No long term physical or mental health conditions | Total Usual Residents | Disabled under the Equality Act: Day-to-day activities limited a lot % | Disabled under the Equality Act: Day-to-day activities limited a little % | Not disabled under the Equality Act: Has long term physical or mental health condition but day-to-day activities are not limited % | Not disabled under the Equality Act: No long term physical or mental health conditions % |
| East Devon | 11,278 | 18,128 | 12,524 | 108,879 | 150,809 | 7.5% | 12.0% | 8.3% | 72.2% |
| Exeter | 8,873 | 14,910 | 10,242 | 96,680 | 130,705 | 6.8% | 11.4% | 7.8% | 74.0% |
| Mid Devon | 5,932 | 9,388 | 6,490 | 61,045 | 82,855 | 7.2% | 11.3% | 7.8% | 73.7% |
| North Devon | 7,870 | 11,433 | 7,664 | 71,649 | 98,616 | 8.0% | 11.6% | 7.8% | 72.7% |
| South Hams | 6,713 | 10,039 | 7,343 | 64,533 | 88,628 | 7.6% | 11.3% | 8.3% | 72.8% |
| Teignbridge | 10,945 | 16,487 | 10,884 | 96,503 | 134,819 | 8.1% | 12.2% | 8.1% | 71.6% |
| Torridge | 5,984 | 8,460 | 5,185 | 48,483 | 68,112 | 8.8% | 12.4% | 7.6% | 71.2% |
| West Devon | 4,708 | 7,190 | 4,799 | 40,402 | 57,099 | 8.2% | 12.6% | 8.4% | 70.8% |
| Plymouth | 25,015 | 32,391 | 19,780 | 187,510 | 264,696 | 9.5% | 12.2% | 7.5% | 70.8% |
| Torbay | 15,255 | 17,973 | 9,978 | 96,116 | 139,322 | 10.9% | 12.9% | 7.2% | 69.0% |
| One Devon | 102,573 | 146,399 | 94,889 | 871,800 | 1,215,661 | 8.4% | 12.0% | 7.8% | 71.7% |
| DCC Devon | 62,303 | 96,035 | 65,131 | 588,174 | 811,643 | 7.7% | 11.8% | 8.0% | 72.5% |
| South West | 421,925 | 636,167 | 441,674 | 4,201,420 | 5,701,186 | 7.4% | 11.2% | 7.7% | 73.7% |
| England | 4,140,357 | 5,634,152 | 3,856,029 | 42,859,508 | 56,490,046 | 7.3% | 10.0% | 6.8% | 75.9% |
Figure 6.1 a) Disability by district

Torridge has 9% Disabled with activities limited a lot compared to DCC Devon’s 7.7% – though Plymouth (9.5%) and Torbay (11%) are higher. DCC Devon has more disabled in all the categories compared to both the SW and England.
| Devon Town | Disabled under the Equality Act: Day-to-day activities limited a lot % | Disabled under the Equality Act: Day-to-day activities limited a little % | Not disabled under the Equality Act: Has long term physical or mental health condition but day-to-day activities are not limited % | Not disabled under the Equality Act: No long term physical or mental health conditions % | Disabled under the Equality Act: Day-to-day activities limited a lot | Disabled under the Equality Act: Day-to-day activities limited a little | Not disabled under the Equality Act: Has long term physical or mental health condition but day-to-day activities are not limited | Not disabled under the Equality Act: No long term physical or mental health conditions | Usual Residents |
| Ashburton-Buckfastleigh | 8.6% | 12.9% | 7.9% | 70.6% | 670 | 1,007 | 614 | 5,501 | 7,792 |
| Axminster | 7.3% | 12.2% | 8.4% | 72.0% | 1,187 | 1,988 | 1,371 | 11,693 | 16,239 |
| Barnstaple | 8.1% | 11.6% | 7.8% | 72.5% | 3,891 | 5,612 | 3,780 | 35,027 | 48,310 |
| Bideford-Northam | 9.1% | 12.4% | 7.7% | 70.8% | 3,562 | 4,842 | 3,002 | 27,617 | 39,023 |
| Braunton | 6.7% | 10.1% | 7.3% | 75.9% | 835 | 1,253 | 907 | 9,434 | 12,429 |
| Cranbrook | 5.0% | 9.3% | 7.1% | 78.6% | 392 | 727 | 554 | 6,145 | 7,818 |
| Crediton | 7.0% | 12.2% | 8.1% | 72.7% | 1,535 | 2,693 | 1,797 | 16,044 | 22,069 |
| Cullompton | 6.9% | 10.5% | 7.8% | 74.8% | 1,764 | 2,668 | 1,988 | 19,052 | 25,472 |
| Dartmouth | 8.1% | 12.1% | 8.3% | 71.6% | 853 | 1,279 | 873 | 7,570 | 10,575 |
| Dawlish | 10.1% | 13.2% | 8.4% | 68.3% | 1,676 | 2,198 | 1,399 | 11,362 | 16,635 |
| Exeter (Wider) | 6.7% | 11.2% | 7.8% | 74.2% | 10,292 | 17,317 | 12,090 | 114,443 | 154,142 |
| Exmouth | 8.2% | 12.6% | 8.3% | 70.9% | 4,050 | 6,193 | 4,072 | 34,854 | 49,169 |
| Great Torrington | 8.0% | 12.6% | 7.7% | 71.7% | 875 | 1,378 | 839 | 7,825 | 10,917 |
| Holsworthy | 8.5% | 12.2% | 7.4% | 71.9% | 1,477 | 2,133 | 1,288 | 12,552 | 17,450 |
| Honiton | 7.4% | 12.5% | 8.1% | 71.9% | 1,415 | 2,390 | 1,543 | 13,711 | 19,059 |
| Ilfracombe | 8.8% | 12.4% | 7.4% | 71.4% | 1,501 | 2,115 | 1,253 | 12,160 | 17,029 |
| Ivybridge | 6.8% | 10.5% | 8.6% | 74.1% | 2,523 | 3,877 | 3,167 | 27,384 | 36,951 |
| Kingsbridge | 7.3% | 11.7% | 7.7% | 73.3% | 1,305 | 2,084 | 1,383 | 13,081 | 17,853 |
| Lynton-Lynmouth | 7.0% | 13.1% | 9.1% | 70.8% | 113 | 211 | 146 | 1,138 | 1,608 |
| Moretonhampstead | 6.1% | 11.3% | 8.9% | 73.8% | 263 | 488 | 385 | 3,194 | 4,330 |
| Newton Abbot | 7.8% | 12.0% | 7.9% | 72.4% | 5,877 | 9,068 | 5,974 | 54,837 | 75,756 |
| Okehampton | 7.9% | 12.2% | 8.1% | 71.9% | 2,240 | 3,443 | 2,281 | 20,365 | 28,329 |
| Ottery St Mary | 6.1% | 10.7% | 8.9% | 74.3% | 959 | 1,686 | 1,390 | 11,662 | 15,697 |
| Plympton | 7.6% | 10.9% | 7.9% | 73.6% | 2,237 | 3,225 | 2,348 | 21,755 | 29,565 |
| Seaton | 9.7% | 13.4% | 8.5% | 68.4% | 1,238 | 1,706 | 1,088 | 8,726 | 12,758 |
| Sidmouth | 7.8% | 13.3% | 9.0% | 69.9% | 1,295 | 2,224 | 1,494 | 11,663 | 16,676 |
| South Molton | 7.9% | 11.6% | 8.2% | 72.3% | 1,203 | 1,766 | 1,242 | 11,000 | 15,211 |
| Tavistock | 8.6% | 13.0% | 8.8% | 69.7% | 2,650 | 4,022 | 2,709 | 21,579 | 30,960 |
| Teignmouth | 9.1% | 12.8% | 8.4% | 69.7% | 1,714 | 2,400 | 1,578 | 13,118 | 18,810 |
| Tiverton | 7.4% | 11.4% | 7.6% | 73.6% | 2,916 | 4,468 | 3,004 | 28,939 | 39,327 |
| Totnes | 8.7% | 12.0% | 8.3% | 71.0% | 2,032 | 2,799 | 1,920 | 16,498 | 23,249 |
| Plymouth | 9.5% | 12.2% | 7.5% | 70.8% | 25,015 | 32,391 | 19,780 | 187,510 | 264,696 |
| Torbay | 10.9% | 12.9% | 7.2% | 69.0% | 15,255 | 17,973 | 9,978 | 96,116 | 139,322 |
| One Devon | 8.4% | 12.0% | 7.8% | 71.7% | 102,573 | 146,399 | 94,889 | 871,800 | 1,215,661 |
| DCC Devon | 7.7% | 11.8% | 8.0% | 72.5% | 64,540 | 99,260 | 67,479 | 609,929 | 841,208 |
| South West | 7.4% | 11.2% | 7.7% | 73.7% | 421,925 | 636,167 | 441,674 | 4,201,420 | 5,701,186 |
| England | 7.3% | 10.0% | 6.8% | 75.9% | 4,140,357 | 5,634,152 | 3,856,029 | 42,859,508 | 56,490,046 |
Table 6.1 b) Disability by devon town
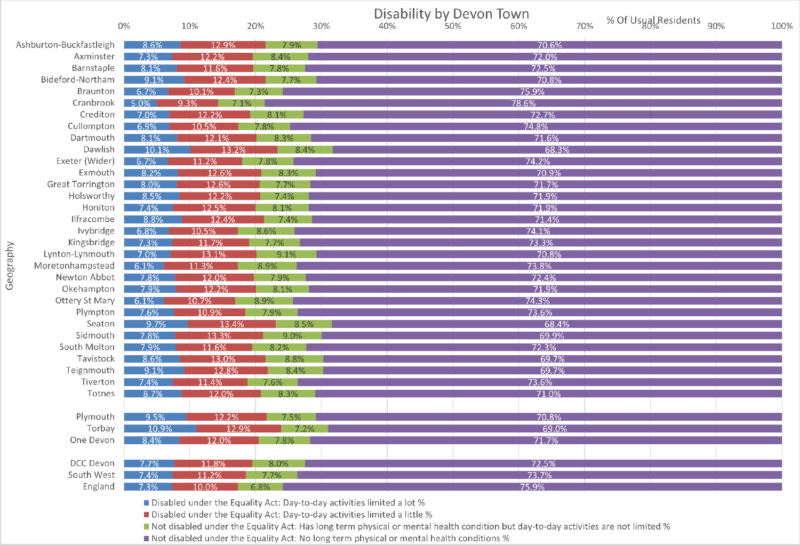
In the two Disabled Under the Equality Act categories DCC Devon has 7.7% and 11.8% – Dawlish (10% & 13%), Seaton (10% & 13%) and Bideford/Northam (9% & 12%). Cranbrook has notably small numbers (5% & 9%).
Table 6.1 c) Disability by district (Age Standardised Proportions)
| Area | Not disabled under the Equality Act | Disabled under the Equality Act: Day-to-day activities limited a little | Disabled under the Equality Act: Day-to-day activities limited a lot | Usual Residents |
| East Devon | 82.9 | 10.8 | 6.3 | 100 |
| Exeter | 81.1 | 11.6 | 7.3 | 100 |
| Mid Devon | 82.4 | 10.9 | 6.6 | 99.9 |
| North Devon | 81.9 | 10.9 | 7.2 | 100 |
| South Hams | 82.9 | 10.4 | 6.7 | 100 |
| Teignbridge | 81.4 | 11.4 | 7.2 | 100 |
| Torridge | 80.7 | 11.4 | 7.8 | 99.9 |
| West Devon | 81.1 | 11.6 | 7.3 | 100 |
| Torbay | 77.9 | 12.2 | 9.9 | 100 |
| Plymouth | 78.0 | 12.3 | 9.7 | 100.0 |
| One Devon | 81.0 | 11.4 | 7.6 | 100.0 |
| DCC Devon | 81.8 | 11.1 | 7.1 | 100.0 |
| South West | 82.2 | 10.8 | 7 | 100 |
| England | 81.9 | 10.3 | 7.7 | 100.0 |
Figure 6.1 c) Disability by district (Age Standardised Proportions)

Age Standardised Proportions version of the disability make the two districts with the oldest populations appear better than DCC Devon (11.1 & 7.1) – South Hams (10.4 & 6.7) and East Devon (10.8 & 6.3).
Map 6.1 d) Disability by output area – with activities limited a lot

There seems to be a couple of Output Areas in each district that has a high percentage of the most disabled group.
6.2 General Health
(ONS Tables TS037 & TS037ASP)
Table 6.2 a) General Health by district
| Areas | Very good health | Good health | Fair health | Bad health | Very bad health | Usual Residents |
| East Devon | 69,973 | 52,881 | 20,650 | 5,798 | 1,525 | 150,827 |
| Exeter | 66,498 | 43,054 | 15,152 | 4,665 | 1,340 | 130,709 |
| Mid Devon | 39,073 | 28,866 | 10,954 | 3,085 | 874 | 82,852 |
| North Devon | 46,135 | 33,154 | 13,705 | 4,352 | 1,265 | 98,611 |
| South Hams | 43,499 | 29,405 | 11,292 | 3,413 | 1,018 | 88,627 |
| Teignbridge | 61,426 | 47,053 | 19,026 | 5,739 | 1,559 | 134,803 |
| Torridge | 29,852 | 23,713 | 10,453 | 3,216 | 880 | 68,114 |
| West Devon | 26,007 | 19,802 | 8,236 | 2,380 | 671 | 57,096 |
| Plymouth | 121,117 | 89,371 | 37,196 | 13,109 | 3,902 | 264,695 |
| Torbay | 58,842 | 47,697 | 22,578 | 7,894 | 2,313 | 139,324 |
| One Devon | 562,422 | 414,996 | 169,242 | 53,651 | 15,347 | 1,215,658 |
| DCC Devon | 382,463 | 277,928 | 109,468 | 32,648 | 9,132 | 811,639 |
| South West | 2,713,601 | 1,950,303 | 748,197 | 224,985 | 64,101 | 5,701,187 |
| England | 27,390,829 | 19,040,736 | 7,147,346 | 2,248,255 | 662,881 | 56,490,047 |
| Areas | Very good health | Good health | Fair health | Bad health | Very bad health |
| East Devon | 46.4% | 35.1% | 13.7% | 3.8% | 1.0% |
| Exeter | 50.9% | 32.9% | 11.6% | 3.6% | 1.0% |
| Mid Devon | 47.2% | 34.8% | 13.2% | 3.7% | 1.1% |
| North Devon | 46.8% | 33.6% | 13.9% | 4.4% | 1.3% |
| South Hams | 49.1% | 33.2% | 12.7% | 3.9% | 1.1% |
| Teignbridge | 45.6% | 34.9% | 14.1% | 4.3% | 1.2% |
| Torridge | 43.8% | 34.8% | 15.3% | 4.7% | 1.3% |
| West Devon | 45.5% | 34.7% | 14.4% | 4.2% | 1.2% |
| Plymouth | 45.8% | 33.8% | 14.1% | 5.0% | 1.5% |
| Torbay | 42.2% | 34.2% | 16.2% | 5.7% | 1.7% |
| One Devon | 46.3% | 34.1% | 13.9% | 4.4% | 1.3% |
| DCC Devon | 47.1% | 34.2% | 13.5% | 4.0% | 1.1% |
| South West | 47.6% | 34.2% | 13.1% | 3.9% | 1.1% |
| England | 48.5% | 33.7% | 12.7% | 4.0% | 1.2% |
Figure 6.2 a) General Health by district

Just over 5% of the people of DCC Devon regard themselves as being in Bad Health or Very Bad Health (comparable to the England figure). Torridge (6.0%) and North Devon (5.7%) compare badly while Exeter (4.6) fare the best. Torbay (7.4%) and Plymouth (6.5%) are the two worst areas in the One Devon area.
Table 6.2 b) General Health by devon town
| Area | Very good health | Good health | Fair health | Bad health | Very bad health | Usual Residents |
| Ashburton-Buckfastleigh | 3,598 | 2,601 | 1,133 | 377 | 88 | 7,797 |
| Axminster | 7,290 | 5,896 | 2,269 | 628 | 159 | 16,242 |
| Barnstaple | 22,491 | 16,333 | 6,656 | 2,230 | 606 | 48,316 |
| Bideford-Northam | 17,031 | 13,554 | 6,001 | 1,905 | 529 | 39,020 |
| Braunton | 6,587 | 3,802 | 1,480 | 417 | 137 | 12,423 |
| Cranbrook | 4,559 | 2,416 | 587 | 195 | 57 | 7,814 |
| Crediton | 10,390 | 7,743 | 2,953 | 771 | 212 | 22,069 |
| Cullompton | 12,402 | 8,733 | 3,164 | 900 | 276 | 25,475 |
| Dartmouth | 4,874 | 3,623 | 1,479 | 465 | 137 | 10,578 |
| Dawlish | 6,888 | 6,055 | 2,600 | 850 | 244 | 16,637 |
| Exeter (Wider) | 78,807 | 50,618 | 17,763 | 5,408 | 1,550 | 154,146 |
| Exmouth | 22,357 | 17,256 | 6,948 | 2,070 | 541 | 49,172 |
| Great Torrington | 4,853 | 3,838 | 1,630 | 484 | 111 | 10,916 |
| Holsworthy | 7,730 | 6,011 | 2,700 | 787 | 223 | 17,451 |
| Honiton | 8,445 | 6,887 | 2,798 | 746 | 188 | 19,064 |
| Ilfracombe | 7,670 | 5,718 | 2,563 | 846 | 237 | 17,034 |
| Ivybridge | 18,840 | 12,273 | 4,189 | 1,284 | 354 | 36,940 |
| Kingsbridge | 8,509 | 6,000 | 2,449 | 692 | 200 | 17,850 |
| Lynton-Lynmouth | 698 | 596 | 244 | 56 | 14 | 1,608 |
| Moretonhampstead | 2,102 | 1,487 | 548 | 154 | 39 | 4,330 |
| Newton Abbot | 35,121 | 26,273 | 10,454 | 3,041 | 854 | 75,743 |
| Okehampton | 12,903 | 9,958 | 3,980 | 1,166 | 318 | 28,325 |
| Ottery St Mary | 8,045 | 5,213 | 1,812 | 484 | 144 | 15,698 |
| Seaton | 4,894 | 4,792 | 2,292 | 617 | 166 | 12,761 |
| Sidmouth | 7,113 | 6,147 | 2,575 | 665 | 174 | 16,674 |
| South Molton | 6,960 | 5,241 | 2,148 | 626 | 232 | 15,207 |
| Tavistock | 13,994 | 10,674 | 4,594 | 1,312 | 387 | 30,961 |
| Teignmouth | 7,882 | 6,869 | 2,917 | 923 | 212 | 18,803 |
| Tiverton | 18,154 | 13,805 | 5,359 | 1,576 | 423 | 39,317 |
| Totnes | 11,276 | 7,506 | 3,177 | 974 | 318 | 23,251 |
| Plymouth | 121,117 | 89,371 | 37,196 | 13,109 | 3,902 | 264,695 |
| Torbay | 58,842 | 47,697 | 22,578 | 7,894 | 2,313 | 139,324 |
| One Devon | 562,422 | 414,996 | 169,242 | 53,651 | 15,347 | 1,215,658 |
| DCC Devon | 382,463 | 277,918 | 109,462 | 32,649 | 9,130 | 811,622 |
| South West | 2,713,601 | 1,950,303 | 748,197 | 224,985 | 64,101 | 5,701,187 |
| England | 27,390,829 | 19,040,736 | 7,147,346 | 2,248,255 | 662,881 | 56,490,047 |
| Area | Very good health % | Good health % | Fair health % | Bad health % | Very bad health % |
| Ashburton-Buckfastleigh | 46.1% | 33.4% | 14.5% | 4.8% | 1.1% |
| Axminster | 44.9% | 36.3% | 14.0% | 3.9% | 1.0% |
| Barnstaple | 46.5% | 33.8% | 13.8% | 4.6% | 1.3% |
| Bideford-Northam | 43.6% | 34.7% | 15.4% | 4.9% | 1.4% |
| Braunton | 53.0% | 30.6% | 11.9% | 3.4% | 1.1% |
| Cranbrook | 58.3% | 30.9% | 7.5% | 2.5% | 0.7% |
| Crediton | 47.1% | 35.1% | 13.4% | 3.5% | 1.0% |
| Cullompton | 48.7% | 34.3% | 12.4% | 3.5% | 1.1% |
| Dartmouth | 46.1% | 34.3% | 14.0% | 4.4% | 1.3% |
| Dawlish | 41.4% | 36.4% | 15.6% | 5.1% | 1.5% |
| Exeter (Wider) | 51.1% | 32.8% | 11.5% | 3.5% | 1.0% |
| Exmouth | 45.5% | 35.1% | 14.1% | 4.2% | 1.1% |
| Great Torrington | 44.5% | 35.2% | 14.9% | 4.4% | 1.0% |
| Holsworthy | 44.3% | 34.4% | 15.5% | 4.5% | 1.3% |
| Honiton | 44.3% | 36.1% | 14.7% | 3.9% | 1.0% |
| Ilfracombe | 45.0% | 33.6% | 15.0% | 5.0% | 1.4% |
| Ivybridge | 51.0% | 33.2% | 11.3% | 3.5% | 1.0% |
| Kingsbridge | 47.7% | 33.6% | 13.7% | 3.9% | 1.1% |
| Lynton-Lynmouth | 43.4% | 37.1% | 15.2% | 3.5% | 0.9% |
| Moretonhampstead | 48.5% | 34.3% | 12.7% | 3.6% | 0.9% |
| Newton Abbot | 46.4% | 34.7% | 13.8% | 4.0% | 1.1% |
| Okehampton | 45.6% | 35.2% | 14.1% | 4.1% | 1.1% |
| Ottery St Mary | 51.2% | 33.2% | 11.5% | 3.1% | 0.9% |
| Seaton | 38.4% | 37.6% | 18.0% | 4.8% | 1.3% |
| Sidmouth | 42.7% | 36.9% | 15.4% | 4.0% | 1.0% |
| South Molton | 45.8% | 34.5% | 14.1% | 4.1% | 1.5% |
| Tavistock | 45.2% | 34.5% | 14.8% | 4.2% | 1.2% |
| Teignmouth | 41.9% | 36.5% | 15.5% | 4.9% | 1.1% |
| Tiverton | 46.2% | 35.1% | 13.6% | 4.0% | 1.1% |
| Totnes | 48.5% | 32.3% | 13.7% | 4.2% | 1.4% |
| Plymouth | 45.8% | 33.8% | 14.1% | 5.0% | 1.5% |
| Torbay | 42.2% | 34.2% | 16.2% | 5.7% | 1.7% |
| One Devon | 46.3% | 34.1% | 13.9% | 4.4% | 1.3% |
| DCC Devon | 47.1% | 34.2% | 13.5% | 4.0% | 1.1% |
| South West | 47.6% | 34.2% | 13.1% | 3.9% | 1.1% |
| England | 48.5% | 33.7% | 12.7% | 4.0% | 1.2% |
Figure 6.2 b) General Health by devon town
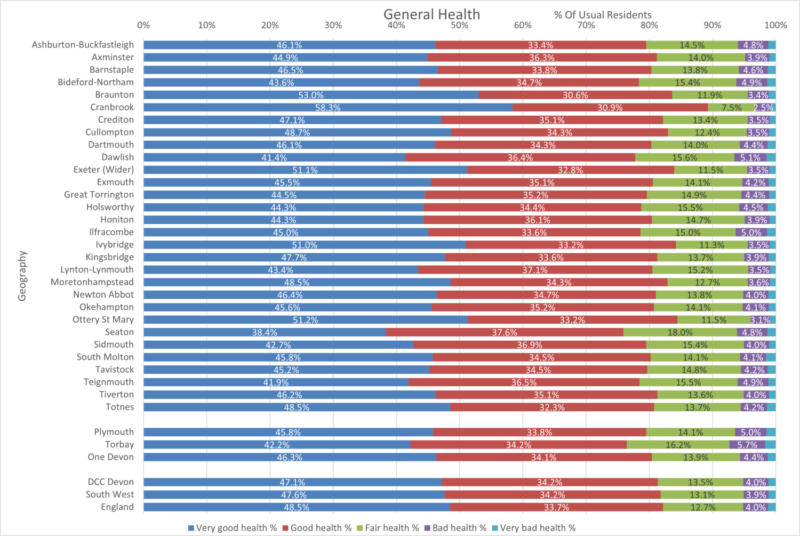
DCC Devon’s has 5.1% of its people who regard themselves as having either Bad Health or Very Bad Health – Dawlish (6.6%), Ilfracombe (6.4%) and Bideford/Northam (6.3%) are notably worse – Cranbrook (3.2%), Ottery St Mary (4.0%), Ivybridge (4.4%) and Lynton & Lynmouth (4.4%) are better than average.
Table 6.2 c) General Health by district (age standardised proportions)
| Area | Very good health | Good health | Fair health | Bad health | Very bad health | Usual Residents |
| East Devon | 50.9 | 33.8 | 11.3 | 3.2 | 0.8 | 100 |
| Exeter | 48.8 | 33.5 | 12.6 | 4 | 1.2 | 100.1 |
| Mid Devon | 48.9 | 34.5 | 12.2 | 3.4 | 1 | 100 |
| North Devon | 49.7 | 33 | 12.4 | 3.9 | 1.1 | 100.1 |
| South Hams | 53.4 | 31.5 | 10.8 | 3.3 | 1 | 100 |
| Teignbridge | 49.1 | 33.9 | 12.3 | 3.7 | 1 | 100 |
| Torridge | 48 | 33.7 | 13.2 | 4.1 | 1.1 | 100.1 |
| West Devon | 49.6 | 33.4 | 12.4 | 3.6 | 1 | 100 |
| Plymouth | 44.8 | 34.1 | 14.4 | 5.1 | 1.5 | 99.9 |
| Torbay | 45.4 | 33.7 | 14.4 | 5 | 1.4 | 99.9 |
| One Devon | 48.9 | 33.5 | 12.6 | 3.9 | 1.1 | 100.0 |
| DCC Devon | 49.8 | 33.4 | 12.2 | 3.7 | 1.0 | 100.0 |
| South West | 48.7 | 34.1 | 12.5 | 3.7 | 1.1 | 100.1 |
| England | 47.0 | 34.2 | 13.3 | 4.2 | 1.3 | 100.0 |
Figure 6.2 c) General Health by district (age standardised proportions)

DCC Devon scored 4.7 for Bad & Very Bad Health this compares with South Hams (4.3) and East Devon (4.0) – Exeter and Torridge both scored 5.2. Comparators : One Devon 5.0, SW 4.8 and England 5.5
Map 6.2 d) General Health Very Bad by output area

Exeter, Plymouth & Torbay have isolated areas with health regarded as Very Poor. There are also some patches in East Devon towards Axminster and also South Molton in North Devon.
6.3 Provision of unpaid care
(ONS Tables TS039 & TS039ASP)
Table 6.3 a) Unpaid Care by district
| LSOA | Provides no unpaid care | Provides 9 hours or less unpaid care a week | Provides 10 to 19 hours unpaid care a week | Provides 20 to 34 hours unpaid care a week | Provides 35 to 49 hours unpaid care a week | Provides 50 or more hours unpaid care a week | No code required | Usual Residents | Provides no unpaid care % | Provides 9 hours or less unpaid care a week % | Provides 10 to 19 hours unpaid care a week % | Provides 20 to 34 hours unpaid care a week % | Provides 35 to 49 hours unpaid care a week % | Provides 50 or more hours unpaid care a week % | No code required % (Under 5s) |
| East Devon | 130,143 | 5,588 | 1,904 | 1,214 | 1,251 | 4,239 | 6,491 | 150,830 | 86.3% | 3.7% | 1.3% | 0.8% | 0.8% | 2.8% | 4.3% |
| Exeter | 114,846 | 4,068 | 1,300 | 905 | 975 | 2,718 | 5,883 | 130,695 | 87.9% | 3.1% | 1.0% | 0.7% | 0.7% | 2.1% | 4.5% |
| Mid Devon | 71,327 | 2,990 | 994 | 671 | 704 | 2,133 | 4,025 | 82,844 | 86.1% | 3.6% | 1.2% | 0.8% | 0.8% | 2.6% | 4.9% |
| North Devon | 85,129 | 3,247 | 1,208 | 788 | 876 | 2,850 | 4,510 | 98,608 | 86.3% | 3.3% | 1.2% | 0.8% | 0.9% | 2.9% | 4.6% |
| South Hams | 76,522 | 3,628 | 1,169 | 755 | 731 | 2,297 | 3,532 | 88,634 | 86.3% | 4.1% | 1.3% | 0.9% | 0.8% | 2.6% | 4.0% |
| Teignbridge | 115,679 | 5,155 | 1,749 | 1,166 | 1,214 | 3,946 | 5,899 | 134,808 | 85.8% | 3.8% | 1.3% | 0.9% | 0.9% | 2.9% | 4.4% |
| Torridge | 58,684 | 2,384 | 844 | 604 | 642 | 2,160 | 2,796 | 68,114 | 86.2% | 3.5% | 1.2% | 0.9% | 0.9% | 3.2% | 4.1% |
| West Devon | 49,222 | 2,267 | 775 | 493 | 462 | 1,678 | 2,196 | 57,093 | 86.2% | 4.0% | 1.4% | 0.9% | 0.8% | 2.9% | 3.8% |
| Plymouth | 227,532 | 7,640 | 3,001 | 2,402 | 2,859 | 8,039 | 13,208 | 264,681 | 86.0% | 2.9% | 1.1% | 0.9% | 1.1% | 3.0% | 5.0% |
| Torbay | 118,365 | 4,497 | 2,014 | 1,549 | 1,652 | 5,186 | 6,053 | 139,316 | 85.0% | 3.2% | 1.4% | 1.1% | 1.2% | 3.7% | 4.3% |
| One Devon | 1,047,449 | 41,464 | 14,958 | 10,547 | 11,366 | 35,246 | 54,593 | 1,215,623 | 86.2% | 3.4% | 1.2% | 0.9% | 0.9% | 2.9% | 4.5% |
| DCC Devon | 701,552 | 29,327 | 9,943 | 6,596 | 6,855 | 22,021 | 35,332 | 811,626 | 86.4% | 3.6% | 1.2% | 0.8% | 0.8% | 2.7% | 4.4% |
| South West | 4,935,783 | 189,849 | 65,565 | 44,399 | 47,185 | 143,960 | 274,446 | 5,701,187 | 86.6% | 3.3% | 1.2% | 0.8% | 0.8% | 2.5% | 4.8% |
| England | 48,734,833 | 1,668,989 | 634,736 | 452,264 | 517,506 | 1,404,767 | 3,076,951 | 56,490,046 | 86.3% | 3.0% | 1.1% | 0.8% | 0.9% | 2.5% | 5.4% |
Figure 6.3 a) Unpaid Care by district

86% of people in DCC Devon provide no care with a further 4% being under 5s. Of those providing care most are either in the 9 hrs or less or the 50 hrs or more categories. In DCC Devon 9.2% provide unpaid care – This ranges from 7.6% in Exeter to 9.9% in West Devon.
Table 6.3 b) Unpaid Care by devon town
| Devon Town | Provides no unpaid care | Provides 9 hours or less unpaid care a week | Provides 10 to 19 hours unpaid care a week | Provides 20 to 34 hours unpaid care a week | Provides 35 to 49 hours unpaid care a week | Provides 50 or more hours unpaid care a week | No code required | Usual Residents |
| Ashburton-Buckfastleigh | 6,670 | 273 | 124 | 80 | 71 | 230 | 349 | 7,797 |
| Axminster | 14,122 | 589 | 193 | 124 | 134 | 415 | 665 | 16,242 |
| Barnstaple | 41,469 | 1,541 | 588 | 375 | 460 | 1,381 | 2,492 | 48,306 |
| Bideford-Northam | 33,596 | 1,388 | 488 | 345 | 371 | 1,235 | 1,601 | 39,024 |
| Braunton | 10,845 | 433 | 139 | 85 | 85 | 307 | 528 | 12,422 |
| Cranbrook | 6,507 | 198 | 68 | 49 | 70 | 153 | 773 | 7,818 |
| Crediton | 19,006 | 870 | 280 | 167 | 175 | 533 | 1,026 | 22,057 |
| Cullompton | 21,911 | 882 | 287 | 208 | 222 | 650 | 1,323 | 25,483 |
| Dartmouth | 9,223 | 399 | 144 | 98 | 88 | 292 | 332 | 10,576 |
| Dawlish | 14,260 | 643 | 204 | 171 | 165 | 545 | 652 | 16,640 |
| Exeter (Wider) | 134,837 | 5,025 | 1,612 | 1,050 | 1,148 | 3,303 | 7,161 | 154,136 |
| Exmouth | 42,587 | 1,823 | 626 | 440 | 424 | 1,446 | 1,823 | 49,169 |
| Great Torrington | 9,412 | 414 | 134 | 91 | 97 | 305 | 464 | 10,917 |
| Holsworthy | 15,027 | 579 | 216 | 164 | 166 | 582 | 718 | 17,452 |
| Honiton | 16,399 | 706 | 223 | 170 | 186 | 569 | 816 | 19,069 |
| Ilfracombe | 14,862 | 506 | 220 | 142 | 142 | 531 | 628 | 17,031 |
| Ivybridge | 31,862 | 1,473 | 444 | 328 | 328 | 933 | 1,583 | 36,951 |
| Kingsbridge | 15,499 | 711 | 233 | 128 | 135 | 453 | 694 | 17,853 |
| Lynton-Lynmouth | 1,426 | 47 | 15 | 14 | 18 | 41 | 48 | 1,609 |
| Moretonhampstead | 3,758 | 211 | 52 | 25 | 26 | 104 | 151 | 4,327 |
| Newton Abbot | 64,793 | 2,844 | 980 | 653 | 704 | 2,217 | 3,549 | 75,740 |
| Okehampton | 24,314 | 1,135 | 380 | 246 | 244 | 853 | 1,159 | 28,331 |
| Ottery St Mary | 13,602 | 586 | 205 | 102 | 108 | 414 | 686 | 15,703 |
| Seaton | 11,084 | 466 | 178 | 110 | 94 | 451 | 375 | 12,758 |
| Sidmouth | 14,431 | 707 | 234 | 143 | 138 | 498 | 524 | 16,675 |
| South Molton | 13,034 | 549 | 201 | 138 | 134 | 477 | 679 | 15,212 |
| Tavistock | 26,813 | 1,211 | 424 | 264 | 239 | 908 | 1,092 | 30,951 |
| Teignmouth | 16,330 | 687 | 245 | 159 | 163 | 529 | 694 | 18,807 |
| Tiverton | 33,935 | 1,386 | 458 | 326 | 340 | 1,047 | 1,824 | 39,316 |
| Totnes | 19,938 | 1,045 | 348 | 201 | 180 | 619 | 923 | 23,254 |
| Plymouth | 227,532 | 7,640 | 3,001 | 2,402 | 2,859 | 8,039 | 13,208 | 264,681 |
| Torbay | 118,365 | 4,497 | 2,014 | 1,549 | 1,652 | 5,186 | 6,053 | 139,316 |
| One Devon | 1,047,449 | 41,464 | 14,958 | 10,547 | 11,366 | 35,246 | 54,593 | 1,215,623 |
| DCC Devon | 701,552 | 29,327 | 9,943 | 6,596 | 6,855 | 22,021 | 35,332 | 811,626 |
| South West | 4,935,783 | 189,849 | 65,565 | 44,399 | 47,185 | 143,960 | 274,446 | 5,701,187 |
| England | 48,734,833 | 1,668,989 | 634,736 | 452,264 | 517,506 | 1,404,767 | 3,076,951 | 56,490,046 |
| Devon Town | Provides no unpaid care % | Provides 9 hours or less unpaid care a week % | Provides 10 to 19 hours unpaid care a week % | Provides 20 to 34 hours unpaid care a week % | Provides 35 to 49 hours unpaid care a week % | Provides 50 or more hours unpaid care a week % | No code required% |
| Ashburton-Buckfastleigh | 85.5% | 3.5% | 1.6% | 1.0% | 0.9% | 2.9% | 4.5% |
| Axminster | 86.9% | 3.6% | 1.2% | 0.8% | 0.8% | 2.6% | 4.1% |
| Barnstaple | 85.8% | 3.2% | 1.2% | 0.8% | 1.0% | 2.9% | 5.2% |
| Bideford-Northam | 86.1% | 3.6% | 1.3% | 0.9% | 1.0% | 3.2% | 4.1% |
| Braunton | 87.3% | 3.5% | 1.1% | 0.7% | 0.7% | 2.5% | 4.3% |
| Cranbrook | 83.2% | 2.5% | 0.9% | 0.6% | 0.9% | 2.0% | 9.9% |
| Crediton | 86.2% | 3.9% | 1.3% | 0.8% | 0.8% | 2.4% | 4.7% |
| Cullompton | 86.0% | 3.5% | 1.1% | 0.8% | 0.9% | 2.6% | 5.2% |
| Dartmouth | 87.2% | 3.8% | 1.4% | 0.9% | 0.8% | 2.8% | 3.1% |
| Dawlish | 85.7% | 3.9% | 1.2% | 1.0% | 1.0% | 3.3% | 3.9% |
| Exeter (Wider) | 87.5% | 3.3% | 1.0% | 0.7% | 0.7% | 2.1% | 4.6% |
| Exmouth | 86.6% | 3.7% | 1.3% | 0.9% | 0.9% | 2.9% | 3.7% |
| Great Torrington | 86.2% | 3.8% | 1.2% | 0.8% | 0.9% | 2.8% | 4.3% |
| Holsworthy | 86.1% | 3.3% | 1.2% | 0.9% | 1.0% | 3.3% | 4.1% |
| Honiton | 86.0% | 3.7% | 1.2% | 0.9% | 1.0% | 3.0% | 4.3% |
| Ilfracombe | 87.3% | 3.0% | 1.3% | 0.8% | 0.8% | 3.1% | 3.7% |
| Ivybridge | 86.2% | 4.0% | 1.2% | 0.9% | 0.9% | 2.5% | 4.3% |
| Kingsbridge | 86.8% | 4.0% | 1.3% | 0.7% | 0.8% | 2.5% | 3.9% |
| Lynton-Lynmouth | 88.6% | 2.9% | 0.9% | 0.9% | 1.1% | 2.5% | 3.0% |
| Moretonhampstead | 86.9% | 4.9% | 1.2% | 0.6% | 0.6% | 2.4% | 3.5% |
| Newton Abbot | 85.5% | 3.8% | 1.3% | 0.9% | 0.9% | 2.9% | 4.7% |
| Okehampton | 85.8% | 4.0% | 1.3% | 0.9% | 0.9% | 3.0% | 4.1% |
| Ottery St Mary | 86.6% | 3.7% | 1.3% | 0.6% | 0.7% | 2.6% | 4.4% |
| Seaton | 86.9% | 3.7% | 1.4% | 0.9% | 0.7% | 3.5% | 2.9% |
| Sidmouth | 86.5% | 4.2% | 1.4% | 0.9% | 0.8% | 3.0% | 3.1% |
| South Molton | 85.7% | 3.6% | 1.3% | 0.9% | 0.9% | 3.1% | 4.5% |
| Tavistock | 86.6% | 3.9% | 1.4% | 0.9% | 0.8% | 2.9% | 3.5% |
| Teignmouth | 86.8% | 3.7% | 1.3% | 0.8% | 0.9% | 2.8% | 3.7% |
| Tiverton | 86.3% | 3.5% | 1.2% | 0.8% | 0.9% | 2.7% | 4.6% |
| Totnes | 85.7% | 4.5% | 1.5% | 0.9% | 0.8% | 2.7% | 4.0% |
| Plymouth | 86.0% | 2.9% | 1.1% | 0.9% | 1.1% | 3.0% | 5.0% |
| Torbay | 85.0% | 3.2% | 1.4% | 1.1% | 1.2% | 3.7% | 4.3% |
| One Devon | 86.2% | 3.4% | 1.2% | 0.9% | 0.9% | 2.9% | 4.5% |
| DCC Devon | 86.4% | 3.6% | 1.2% | 0.8% | 0.8% | 2.7% | 4.4% |
| South West | 86.6% | 3.3% | 1.2% | 0.8% | 0.8% | 2.5% | 4.8% |
| England | 86.3% | 3.0% | 1.1% | 0.8% | 0.9% | 2.5% | 5.4% |
Figure 6.3 b) Unpaid Care by devon town

Compared to the DCC average of 9.2% of persons providing unpaid care Exeter (Wider) (7.9%) and Cranbrook (6.9%) are the lowest. At the other extreme Dawlish (10.4%), Sidmouth (10.3%) and Totnes (10.3%) are the highest.
Map 6.3 c) Unpaid Care Provision by output area
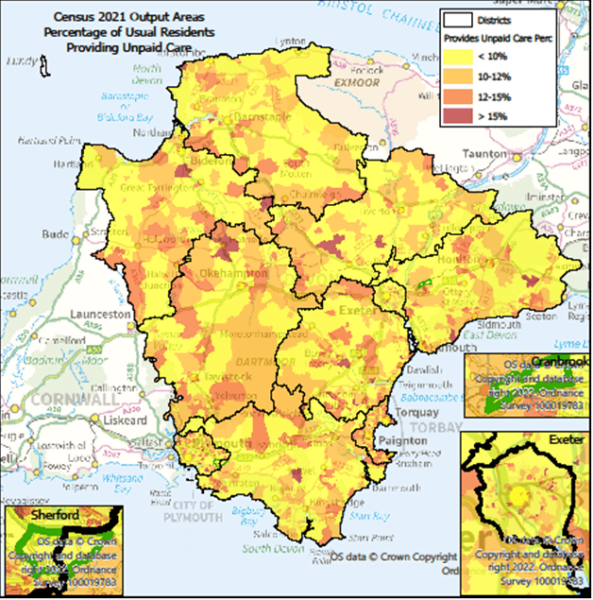
Most of the Unpaid Care providers seem to spread out – most in rural areas – Bideford in Torridge, Copplestone in Mid Devon, Hatherleigh in West Devon, Axminster and Budleigh Salterton in East Devon, Ilsington and Ashburton in Teignbridge and a rural area in South Hams.
Map 6.3 d) 50+ Hours per week Unpaid Care Provision by output area

Unpaid care 50+ hours are spread out through some rural areas and some towns Okehampton, Holsworthy, Newton Abbot, Honiton and Seaton being the most notable.