7 Work
7.1 Economic activity
(ONS Table TS066)
Table 7.1 a) Economic Activity by district
| Area | Economically active (EA) Full-time In employment | EA Part-time in Employment | EA Self-employed with employees: Full-time | EA Self-employed with employees: Part-time | EA Self-employed without employees: Full-time | EA Self-employed without employees: Part-time | EA Unemployed: Seeking work or waiting to start a job already obtained | EA full-time student: In Full-time employment | EA full-time student: In Part-time employment | EA full-time student: self Employed with Full-time employees | EA full-time student: self Employed with Part-time employees | EA full-time student: self Employed without Full-time employees | EA full-time student: self Employed without Part-time employees | EA full-time student: Unemployed: Seeking work or waiting to start a job already obtained | Economically inactive (EI): Long-term sick or disabled | EI: Looking after home or family | EI: Retired | EI: Student | EI: Other | Does not apply (U16?) | Usual Residents |
| East Devon | 34,536 | 16,230 | 1,867 | 508 | 6,543 | 5,690 | 2,195 | 208 | 1,075 | 4 | 6 | 15 | 45 | 267 | 3,866 | 4,310 | 43,583 | 3,672 | 2,768 | 23,439 | 150,827 |
| Exeter | 34,661 | 13,363 | 910 | 253 | 3,937 | 3,047 | 2,129 | 361 | 2,797 | 4 | 18 | 25 | 325 | 1,426 | 4,077 | 3,185 | 20,560 | 17,633 | 2,620 | 19,378 | 130,709 |
| Mid Devon | 21,346 | 9,098 | 1,088 | 305 | 4,359 | 3,275 | 1,185 | 112 | 647 | 0 | 2 | 9 | 38 | 190 | 2,315 | 2,495 | 18,047 | 2,208 | 1,484 | 14,647 | 82,850 |
| North Devon | 22,376 | 11,371 | 1,343 | 410 | 5,043 | 3,749 | 1,701 | 139 | 682 | 0 | 1 | 13 | 39 | 271 | 3,309 | 3,150 | 24,057 | 2,516 | 2,024 | 16,418 | 98,612 |
| South Hams | 19,002 | 9,347 | 1,295 | 438 | 4,822 | 4,845 | 1,241 | 120 | 649 | 0 | 0 | 18 | 49 | 187 | 2,499 | 2,618 | 23,739 | 2,459 | 1,640 | 13,659 | 88,627 |
| Teignbridge | 32,861 | 14,954 | 1,502 | 490 | 6,005 | 5,067 | 2,095 | 189 | 1,006 | 4 | 4 | 8 | 47 | 304 | 4,030 | 3,944 | 34,764 | 3,361 | 2,826 | 21,342 | 134,803 |
| Torridge | 13,942 | 7,662 | 946 | 271 | 3,915 | 2,805 | 1,207 | 69 | 413 | 0 | 0 | 5 | 26 | 157 | 2,566 | 2,236 | 18,399 | 1,563 | 1,378 | 10,555 | 68,115 |
| West Devon | 12,229 | 5,822 | 749 | 257 | 3,258 | 2,591 | 849 | 60 | 381 | 0 | 0 | 6 | 31 | 84 | 1,833 | 1,802 | 15,401 | 1,622 | 1,387 | 8,733 | 57,095 |
| Plymouth | 72,640 | 27,935 | 1,753 | 506 | 7,756 | 5,386 | 5,302 | 693 | 4,007 | 7 | 19 | 43 | 273 | 1,824 | 11,973 | 9,228 | 47,650 | 15,627 | 6,002 | 46,071 | 264,695 |
| Torbay | 30,845 | 15,403 | 1,184 | 440 | 5,515 | 4,278 | 3,020 | 202 | 1,009 | 7 | 4 | 18 | 30 | 424 | 6,901 | 5,037 | 35,505 | 3,848 | 3,360 | 22,292 | 139,322 |
| One Devon | 294,438 | 131,185 | 12,637 | 3,878 | 51,153 | 40,733 | 20,924 | 2,153 | 12,666 | 26 | 54 | 160 | 903 | 5,134 | 43,369 | 38,005 | 281,705 | 54,509 | 25,489 | 196,534 | 1,215,655 |
| DCC Devon | 190,953 | 87,847 | 9,700 | 2,932 | 37,882 | 31,069 | 12,602 | 1,258 | 7,650 | 12 | 31 | 99 | 600 | 2,886 | 24,495 | 23,740 | 198,550 | 35,034 | 16,127 | 128,171 | 811,638 |
| South West | 1,525,330 | 602,803 | 56,081 | 16,510 | 230,425 | 186,463 | 99,833 | 11,173 | 58,337 | 157 | 278 | 759 | 4,024 | 25,057 | 176,111 | 177,441 | 1,212,566 | 116,790 | 235,708 | 965,346 | 5,701,192 |
| England | 15,766,743 | 5,475,747 | 534,606 | 168,285 | 2,074,377 | 1,612,761 | 1,312,729 | 141,388 | 566,637 | 2,785 | 4,109 | 13,887 | 43,899 | 283,560 | 1,874,301 | 2,207,739 | 9,882,054 | 1,445,910 | 2,595,452 | 10,483,091 | 56,490,060 |
| Area | Economically active (EA) Full-time In employment | EA Part-time in Employment | EA Self-employed with employees: Full-time | EA Self-employed with employees: Part-time | EA Self-employed without employees: Full-time | EA Self-employed without employees: Part-time | EA Unemployed: Seeking work or waiting to start a job already obtained | EA full-time student: In Full-time employment | EA full-time student: In Part-time employment | EA full-time student: self Employed with Full-time employees | EA full-time student: self Employed with Part-time employees | EA full-time student: self Employed without Full-time employees | EA full-time student: self Employed without Part-time employees | EA full-time student: Unemployed: Seeking work or waiting to start a job already obtained | Economically inactive (EI): Long-term sick or disabled | EI: Looking after home or family | EI: Retired | EI: Student | EI: Other | Does not apply (U16?) |
| East Devon | 22.9% | 10.8% | 1.2% | 0.3% | 4.3% | 3.8% | 1.5% | 0.1% | 0.7% | 0.0% | 0.0% | 0.0% | 0.0% | 0.2% | 2.6% | 2.9% | 28.9% | 2.4% | 1.8% | 15.5% |
| Exeter | 26.5% | 10.2% | 0.7% | 0.2% | 3.0% | 2.3% | 1.6% | 0.3% | 2.1% | 0.0% | 0.0% | 0.0% | 0.2% | 1.1% | 3.1% | 2.4% | 15.7% | 13.5% | 2.0% | 14.8% |
| Mid Devon | 25.8% | 11.0% | 1.3% | 0.4% | 5.3% | 4.0% | 1.4% | 0.1% | 0.8% | 0.0% | 0.0% | 0.0% | 0.0% | 0.2% | 2.8% | 3.0% | 21.8% | 2.7% | 1.8% | 17.7% |
| North Devon | 22.7% | 11.5% | 1.4% | 0.4% | 5.1% | 3.8% | 1.7% | 0.1% | 0.7% | 0.0% | 0.0% | 0.0% | 0.0% | 0.3% | 3.4% | 3.2% | 24.4% | 2.6% | 2.1% | 16.6% |
| South Hams | 21.4% | 10.5% | 1.5% | 0.5% | 5.4% | 5.5% | 1.4% | 0.1% | 0.7% | 0.0% | 0.0% | 0.0% | 0.1% | 0.2% | 2.8% | 3.0% | 26.8% | 2.8% | 1.9% | 15.4% |
| Teignbridge | 24.4% | 11.1% | 1.1% | 0.4% | 4.5% | 3.8% | 1.6% | 0.1% | 0.7% | 0.0% | 0.0% | 0.0% | 0.0% | 0.2% | 3.0% | 2.9% | 25.8% | 2.5% | 2.1% | 15.8% |
| Torridge | 20.5% | 11.2% | 1.4% | 0.4% | 5.7% | 4.1% | 1.8% | 0.1% | 0.6% | 0.0% | 0.0% | 0.0% | 0.0% | 0.2% | 3.8% | 3.3% | 27.0% | 2.3% | 2.0% | 15.5% |
| West Devon | 21.4% | 10.2% | 1.3% | 0.5% | 5.7% | 4.5% | 1.5% | 0.1% | 0.7% | 0.0% | 0.0% | 0.0% | 0.1% | 0.1% | 3.2% | 3.2% | 27.0% | 2.8% | 2.4% | 15.3% |
| Plymouth | 27.4% | 10.6% | 0.7% | 0.2% | 2.9% | 2.0% | 2.0% | 0.3% | 1.5% | 0.0% | 0.0% | 0.0% | 0.1% | 0.7% | 4.5% | 3.5% | 18.0% | 5.9% | 2.3% | 17.4% |
| Torbay | 22.1% | 11.1% | 0.8% | 0.3% | 4.0% | 3.1% | 2.2% | 0.1% | 0.7% | 0.0% | 0.0% | 0.0% | 0.0% | 0.3% | 5.0% | 3.6% | 25.5% | 2.8% | 2.4% | 16.0% |
| One Devon | 24.2% | 10.8% | 1.0% | 0.3% | 4.2% | 3.4% | 1.7% | 0.2% | 1.0% | 0.0% | 0.0% | 0.0% | 0.1% | 0.4% | 3.6% | 3.1% | 23.2% | 4.5% | 2.1% | 16.2% |
| DCC Devon | 23.5% | 10.8% | 1.2% | 0.4% | 4.7% | 3.8% | 1.6% | 0.2% | 0.9% | 0.0% | 0.0% | 0.0% | 0.1% | 0.4% | 3.0% | 2.9% | 24.5% | 4.3% | 2.0% | 15.8% |
| South West | 26.8% | 10.6% | 1.0% | 0.3% | 4.0% | 3.3% | 1.8% | 0.2% | 1.0% | 0.0% | 0.0% | 0.0% | 0.1% | 0.4% | 3.1% | 3.1% | 21.3% | 2.0% | 4.1% | 16.9% |
| England | 27.9% | 9.7% | 0.9% | 0.3% | 3.7% | 2.9% | 2.3% | 0.3% | 1.0% | 0.0% | 0.0% | 0.0% | 0.1% | 0.5% | 3.3% | 3.9% | 17.5% | 2.6% | 4.6% | 18.6% |
Figure 7.1 a) Economic Activity by district
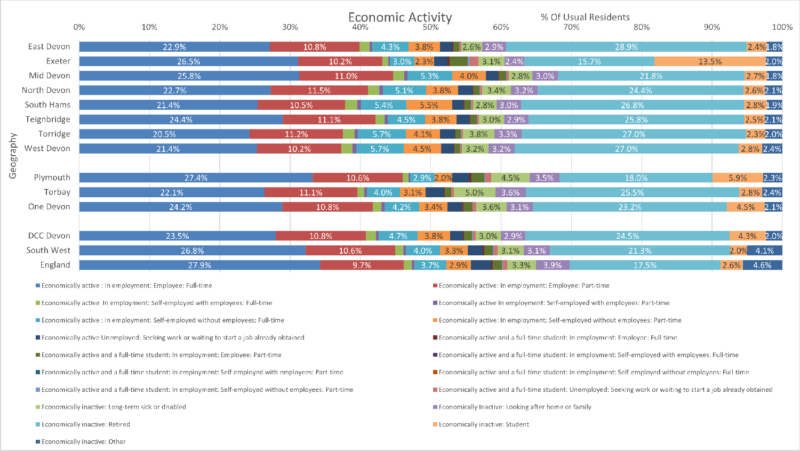
A quarter of the people in DCC Devon are retired. 24% are full-time employees with a further 11% part-time. 4% are economically inactive students (in Exeter this rises to 14%).
Table 7.1 b) Economic Activity by devon town
| Area | Economically active (EA) Full-time In employment | EA Part-time in Employment | EA Self-employed with employees: Full-time | EA Self-employed with employees: Part-time | EA Self-employed without employees: Full-time | EA Self-employed without employees: Part-time | EA Unemployed: Seeking work or waiting to start a job already obtained | EA full-time student: In Full-time employment | EA full-time student: In Part-time employment | EA full-time student: self Employed with Full-time employees | EA full-time student: self Employed with Part-time employees | EA full-time student: self Employed without Full-time employees | EA full-time student: self Employed without Part-time employees | EA full-time student: Unemployed: Seeking work or waiting to start a job already obtained | Economically inactive (EI): Long-term sick or disabled | EI: Looking after home or family | EI: Retired | EI: Student | EI: Other | Does not apply (U16?) | Usual Residents |
| Ashburton-Buckfastleigh | 1,710 | 852 | 95 | 35 | 377 | 460 | 139 | 9 | 52 | 0 | 1 | 2 | 7 | 22 | 279 | 257 | 143 | 1,784 | 238 | 1,324 | 7,786 |
| Axminster | 3,191 | 1,684 | 232 | 61 | 937 | 830 | 298 | 12 | 89 | 0 | 0 | 1 | 7 | 32 | 416 | 514 | 282 | 4,839 | 377 | 2,424 | 16,226 |
| Barnstaple | 11,723 | 5,912 | 483 | 132 | 2,138 | 1,470 | 810 | 70 | 364 | 0 | 1 | 5 | 17 | 143 | 1,791 | 1,550 | 937 | 11,167 | 1,147 | 8,441 | 48,301 |
| Bideford-Northam | 8,147 | 4,516 | 466 | 131 | 1,867 | 1,474 | 746 | 39 | 233 | 0 | 0 | 3 | 16 | 97 | 1,613 | 1,232 | 845 | 10,648 | 893 | 6,051 | 39,017 |
| Braunton | 2,885 | 1,423 | 182 | 60 | 556 | 551 | 176 | 30 | 130 | 0 | 0 | 2 | 4 | 31 | 235 | 348 | 235 | 3,061 | 327 | 2,184 | 12,420 |
| Cranbrook | 2,834 | 877 | 74 | 16 | 276 | 195 | 100 | 19 | 62 | 0 | 0 | 1 | 4 | 20 | 165 | 226 | 106 | 505 | 199 | 2,150 | 7,829 |
| Crediton | 5,337 | 2,471 | 300 | 64 | 1,268 | 1,056 | 306 | 22 | 170 | 0 | 2 | 2 | 16 | 54 | 624 | 672 | 381 | 4,972 | 582 | 3,762 | 22,061 |
| Cullompton | 7,121 | 2,872 | 353 | 95 | 1,228 | 918 | 321 | 39 | 190 | 0 | 0 | 4 | 7 | 54 | 603 | 700 | 453 | 5,119 | 656 | 4,732 | 25,465 |
| Dartmouth | 1,911 | 1,105 | 158 | 62 | 657 | 607 | 151 | 21 | 78 | 0 | 0 | 1 | 2 | 15 | 298 | 317 | 204 | 3,472 | 253 | 1,271 | 10,583 |
| Dawlish | 3,660 | 1,834 | 149 | 62 | 653 | 507 | 284 | 21 | 125 | 0 | 0 | 1 | 2 | 44 | 684 | 507 | 337 | 5,065 | 351 | 2,346 | 16,632 |
| Exeter (Wider) | 41,086 | 15,864 | 1,273 | 349 | 5,084 | 3,972 | 2,421 | 407 | 3,013 | 5 | 18 | 33 | 337 | 1,474 | 4,582 | 3,811 | 2,992 | 25,712 | 18,222 | 23,488 | 154,143 |
| Exmouth | 11,394 | 5,497 | 498 | 173 | 1,824 | 1,685 | 757 | 69 | 349 | 1 | 2 | 3 | 10 | 102 | 1,459 | 1,270 | 1,018 | 14,606 | 1,215 | 7,245 | 49,177 |
| Great Torrington | 2,381 | 1,237 | 157 | 33 | 645 | 434 | 173 | 8 | 51 | 0 | 0 | 0 | 4 | 29 | 326 | 357 | 169 | 2,979 | 253 | 1,675 | 10,911 |
| Holsworthy | 3,273 | 1,854 | 320 | 101 | 1,329 | 855 | 279 | 17 | 115 | 0 | 0 | 2 | 3 | 34 | 622 | 625 | 340 | 4,631 | 392 | 2,661 | 17,453 |
| Honiton | 4,382 | 2,076 | 252 | 59 | 1,002 | 766 | 269 | 15 | 138 | 0 | 1 | 2 | 4 | 35 | 492 | 608 | 369 | 5,305 | 432 | 2,859 | 19,066 |
| Ilfracombe | 3,460 | 2,001 | 259 | 80 | 821 | 770 | 380 | 22 | 77 | 0 | 0 | 3 | 8 | 41 | 649 | 533 | 446 | 4,315 | 516 | 2,655 | 17,036 |
| Ivybridge | 9,501 | 3,917 | 516 | 162 | 1,671 | 1,553 | 462 | 56 | 301 | 0 | 0 | 7 | 22 | 69 | 872 | 971 | 538 | 9,112 | 997 | 6,208 | 36,935 |
| Kingsbridge | 3,218 | 1,831 | 314 | 88 | 1,157 | 1,082 | 252 | 12 | 128 | 0 | 0 | 6 | 6 | 43 | 485 | 566 | 356 | 5,202 | 456 | 2,648 | 17,850 |
| Lynton-Lynmouth | 331 | 151 | 40 | 15 | 171 | 92 | 29 | 1 | 2 | 0 | 0 | 0 | 1 | 3 | 44 | 40 | 49 | 458 | 24 | 155 | 1,606 |
| Moretonhampstead | 851 | 419 | 52 | 19 | 338 | 347 | 45 | 1 | 17 | 0 | 1 | 0 | 0 | 15 | 78 | 141 | 85 | 1,182 | 112 | 630 | 4,333 |
| Newton Abbot | 19,679 | 8,629 | 851 | 261 | 3,307 | 2,659 | 1,147 | 120 | 595 | 3 | 2 | 2 | 27 | 153 | 2,151 | 2,173 | 1,693 | 17,841 | 1,934 | 12,519 | 75,746 |
| Okehampton | 6,242 | 2,893 | 412 | 110 | 1,920 | 1,397 | 411 | 28 | 167 | 0 | 0 | 4 | 14 | 42 | 875 | 962 | 566 | 6,959 | 774 | 4,554 | 28,330 |
| Ottery St Mary | 3,661 | 1,727 | 241 | 46 | 714 | 617 | 202 | 33 | 128 | 1 | 0 | 1 | 1 | 17 | 308 | 443 | 255 | 4,084 | 461 | 2,763 | 15,703 |
| Seaton | 2,265 | 1,306 | 162 | 47 | 562 | 456 | 173 | 17 | 69 | 1 | 0 | 0 | 3 | 20 | 328 | 362 | 236 | 5,092 | 217 | 1,444 | 12,760 |
| Sidmouth | 2,955 | 1,626 | 180 | 54 | 575 | 611 | 228 | 23 | 113 | 0 | 2 | 3 | 8 | 18 | 408 | 512 | 301 | 6,635 | 397 | 2,037 | 16,686 |
| South Molton | 3,206 | 1,514 | 283 | 100 | 1,049 | 677 | 231 | 16 | 86 | 0 | 0 | 3 | 4 | 45 | 464 | 533 | 286 | 3,872 | 414 | 2,427 | 15,210 |
| Tavistock | 6,395 | 3,136 | 378 | 158 | 1,499 | 1,294 | 470 | 30 | 224 | 0 | 0 | 2 | 16 | 45 | 1,020 | 907 | 867 | 9,095 | 902 | 4,517 | 30,955 |
| Teignmouth | 4,039 | 1,996 | 193 | 73 | 728 | 645 | 347 | 17 | 117 | 1 | 0 | 3 | 1 | 50 | 597 | 578 | 385 | 5,914 | 456 | 2,673 | 18,813 |
| Tiverton | 9,732 | 4,130 | 531 | 153 | 2,171 | 1,493 | 621 | 53 | 302 | 0 | 0 | 4 | 18 | 88 | 1,181 | 1,264 | 717 | 8,978 | 1,089 | 6,790 | 39,315 |
| Totnes | 4,364 | 2,492 | 309 | 123 | 1,334 | 1,601 | 377 | 28 | 141 | 0 | 0 | 5 | 19 | 60 | 847 | 755 | 539 | 5,956 | 752 | 3,545 | 23,247 |
| Plymouth | 72,640 | 27,935 | 1,753 | 506 | 7,756 | 5,386 | 5,302 | 693 | 4,007 | 7 | 19 | 43 | 273 | 1,824 | 11,973 | 9,228 | 47,650 | 15,627 | 6,002 | 46,071 | 264,695 |
| Torbay | 30,845 | 15,403 | 1,184 | 440 | 5,515 | 4,278 | 3,020 | 202 | 1,009 | 7 | 4 | 18 | 30 | 424 | 6,901 | 5,037 | 35,505 | 3,848 | 3,360 | 22,292 | 139,322 |
| One Devon | 294,438 | 131,185 | 12,637 | 3,878 | 51,153 | 40,733 | 20,924 | 2,153 | 12,666 | 26 | 54 | 160 | 903 | 5,134 | 43,369 | 38,005 | 281,705 | 54,509 | 25,489 | 196,534 | 1,215,655 |
| DCC Devon | 190,934 | 87,842 | 9,713 | 2,922 | 37,858 | 31,074 | 12,605 | 1,255 | 7,626 | 12 | 30 | 105 | 588 | 2,895 | 24,496 | 23,734 | 16,130 | 198,560 | 35,038 | 128,178 | 811,595 |
| South West | 1,525,330 | 602,803 | 56,081 | 16,510 | 230,425 | 186,463 | 99,833 | 11,173 | 58,337 | 157 | 278 | 759 | 4,024 | 25,057 | 176,111 | 177,441 | 116,790 | 1,212,566 | 235,708 | 965,346 | 5,701,192 |
| England | 15,766,743 | 5,475,747 | 534,606 | 168,285 | 2,074,377 | 1,612,761 | 1,312,729 | 141,388 | 566,637 | 2,785 | 4,109 | 13,887 | 43,899 | 283,560 | 1,874,301 | 2,207,739 | 1,445,910 | 9,882,054 | 2,595,452 | 10,483,091 | 56,490,060 |
| Area | Economically active (EA) Full-time In employment | EA Part-time in Employment | EA Self-employed with employees: Full-time | EA Self-employed with employees: Part-time | EA Self-employed without employees: Full-time | EA Self-employed without employees: Part-time | EA Unemployed: Seeking work or waiting to start a job already obtained | EA full-time student: In Full-time employment | EA full-time student: In Part-time employment | EA full-time student: self Employed with Full-time employees | EA full-time student: self Employed with Part-time employees | EA full-time student: self Employed without Full-time employees | EA full-time student: self Employed without Part-time employees | EA full-time student: Unemployed: Seeking work or waiting to start a job already obtained | Economically inactive (EI): Long-term sick or disabled | EI: Looking after home or family | EI: Retired | EI: Student | EI: Other | Does not apply (U16?) |
| Ashburton-Buckfastleigh | 22.0% | 10.9% | 1.2% | 0.4% | 4.8% | 5.9% | 1.8% | 0.1% | 0.7% | 0.0% | 0.0% | 0.0% | 0.1% | 0.3% | 3.6% | 3.3% | 1.8% | 22.9% | 3.1% | 17.0% |
| Axminster | 19.7% | 10.4% | 1.4% | 0.4% | 5.8% | 5.1% | 1.8% | 0.1% | 0.5% | 0.0% | 0.0% | 0.0% | 0.0% | 0.2% | 2.6% | 3.2% | 1.7% | 29.8% | 2.3% | 14.9% |
| Barnstaple | 24.3% | 12.2% | 1.0% | 0.3% | 4.4% | 3.0% | 1.7% | 0.1% | 0.8% | 0.0% | 0.0% | 0.0% | 0.0% | 0.3% | 3.7% | 3.2% | 1.9% | 23.1% | 2.4% | 17.5% |
| Bideford-Northam | 20.9% | 11.6% | 1.2% | 0.3% | 4.8% | 3.8% | 1.9% | 0.1% | 0.6% | 0.0% | 0.0% | 0.0% | 0.0% | 0.2% | 4.1% | 3.2% | 2.2% | 27.3% | 2.3% | 15.5% |
| Braunton | 23.2% | 11.5% | 1.5% | 0.5% | 4.5% | 4.4% | 1.4% | 0.2% | 1.0% | 0.0% | 0.0% | 0.0% | 0.0% | 0.2% | 1.9% | 2.8% | 1.9% | 24.6% | 2.6% | 17.6% |
| Cranbrook | 36.2% | 11.2% | 0.9% | 0.2% | 3.5% | 2.5% | 1.3% | 0.2% | 0.8% | 0.0% | 0.0% | 0.0% | 0.1% | 0.3% | 2.1% | 2.9% | 1.4% | 6.5% | 2.5% | 27.5% |
| Crediton | 24.2% | 11.2% | 1.4% | 0.3% | 5.7% | 4.8% | 1.4% | 0.1% | 0.8% | 0.0% | 0.0% | 0.0% | 0.1% | 0.2% | 2.8% | 3.0% | 1.7% | 22.5% | 2.6% | 17.1% |
| Cullompton | 28.0% | 11.3% | 1.4% | 0.4% | 4.8% | 3.6% | 1.3% | 0.2% | 0.7% | 0.0% | 0.0% | 0.0% | 0.0% | 0.2% | 2.4% | 2.7% | 1.8% | 20.1% | 2.6% | 18.6% |
| Dartmouth | 18.1% | 10.4% | 1.5% | 0.6% | 6.2% | 5.7% | 1.4% | 0.2% | 0.7% | 0.0% | 0.0% | 0.0% | 0.0% | 0.1% | 2.8% | 3.0% | 1.9% | 32.8% | 2.4% | 12.0% |
| Dawlish | 22.0% | 11.0% | 0.9% | 0.4% | 3.9% | 3.0% | 1.7% | 0.1% | 0.8% | 0.0% | 0.0% | 0.0% | 0.0% | 0.3% | 4.1% | 3.0% | 2.0% | 30.5% | 2.1% | 14.1% |
| Exeter (Wider) | 26.7% | 10.3% | 0.8% | 0.2% | 3.3% | 2.6% | 1.6% | 0.3% | 2.0% | 0.0% | 0.0% | 0.0% | 0.2% | 1.0% | 3.0% | 2.5% | 1.9% | 16.7% | 11.8% | 15.2% |
| Exmouth | 23.2% | 11.2% | 1.0% | 0.4% | 3.7% | 3.4% | 1.5% | 0.1% | 0.7% | 0.0% | 0.0% | 0.0% | 0.0% | 0.2% | 3.0% | 2.6% | 2.1% | 29.7% | 2.5% | 14.7% |
| Great Torrington | 21.8% | 11.3% | 1.4% | 0.3% | 5.9% | 4.0% | 1.6% | 0.1% | 0.5% | 0.0% | 0.0% | 0.0% | 0.0% | 0.3% | 3.0% | 3.3% | 1.5% | 27.3% | 2.3% | 15.4% |
| Holsworthy | 18.8% | 10.6% | 1.8% | 0.6% | 7.6% | 4.9% | 1.6% | 0.1% | 0.7% | 0.0% | 0.0% | 0.0% | 0.0% | 0.2% | 3.6% | 3.6% | 1.9% | 26.5% | 2.2% | 15.2% |
| Honiton | 23.0% | 10.9% | 1.3% | 0.3% | 5.3% | 4.0% | 1.4% | 0.1% | 0.7% | 0.0% | 0.0% | 0.0% | 0.0% | 0.2% | 2.6% | 3.2% | 1.9% | 27.8% | 2.3% | 15.0% |
| Ilfracombe | 20.3% | 11.7% | 1.5% | 0.5% | 4.8% | 4.5% | 2.2% | 0.1% | 0.5% | 0.0% | 0.0% | 0.0% | 0.0% | 0.2% | 3.8% | 3.1% | 2.6% | 25.3% | 3.0% | 15.6% |
| Ivybridge | 25.7% | 10.6% | 1.4% | 0.4% | 4.5% | 4.2% | 1.3% | 0.2% | 0.8% | 0.0% | 0.0% | 0.0% | 0.1% | 0.2% | 2.4% | 2.6% | 1.5% | 24.7% | 2.7% | 16.8% |
| Kingsbridge | 18.0% | 10.3% | 1.8% | 0.5% | 6.5% | 6.1% | 1.4% | 0.1% | 0.7% | 0.0% | 0.0% | 0.0% | 0.0% | 0.2% | 2.7% | 3.2% | 2.0% | 29.1% | 2.6% | 14.8% |
| Lynton-Lynmouth | 20.6% | 9.4% | 2.5% | 0.9% | 10.6% | 5.7% | 1.8% | 0.1% | 0.1% | 0.0% | 0.0% | 0.0% | 0.1% | 0.2% | 2.7% | 2.5% | 3.1% | 28.5% | 1.5% | 9.7% |
| Moretonhampstead | 19.6% | 9.7% | 1.2% | 0.4% | 7.8% | 8.0% | 1.0% | 0.0% | 0.4% | 0.0% | 0.0% | 0.0% | 0.0% | 0.3% | 1.8% | 3.3% | 2.0% | 27.3% | 2.6% | 14.5% |
| Newton Abbot | 26.0% | 11.4% | 1.1% | 0.3% | 4.4% | 3.5% | 1.5% | 0.2% | 0.8% | 0.0% | 0.0% | 0.0% | 0.0% | 0.2% | 2.8% | 2.9% | 2.2% | 23.6% | 2.6% | 16.5% |
| Okehampton | 22.0% | 10.2% | 1.5% | 0.4% | 6.8% | 4.9% | 1.5% | 0.1% | 0.6% | 0.0% | 0.0% | 0.0% | 0.0% | 0.1% | 3.1% | 3.4% | 2.0% | 24.6% | 2.7% | 16.1% |
| Ottery St Mary | 23.3% | 11.0% | 1.5% | 0.3% | 4.5% | 3.9% | 1.3% | 0.2% | 0.8% | 0.0% | 0.0% | 0.0% | 0.0% | 0.1% | 2.0% | 2.8% | 1.6% | 26.0% | 2.9% | 17.6% |
| Seaton | 17.8% | 10.2% | 1.3% | 0.4% | 4.4% | 3.6% | 1.4% | 0.1% | 0.5% | 0.0% | 0.0% | 0.0% | 0.0% | 0.2% | 2.6% | 2.8% | 1.8% | 39.9% | 1.7% | 11.3% |
| Sidmouth | 17.7% | 9.7% | 1.1% | 0.3% | 3.4% | 3.7% | 1.4% | 0.1% | 0.7% | 0.0% | 0.0% | 0.0% | 0.0% | 0.1% | 2.4% | 3.1% | 1.8% | 39.8% | 2.4% | 12.2% |
| South Molton | 21.1% | 10.0% | 1.9% | 0.7% | 6.9% | 4.5% | 1.5% | 0.1% | 0.6% | 0.0% | 0.0% | 0.0% | 0.0% | 0.3% | 3.1% | 3.5% | 1.9% | 25.5% | 2.7% | 16.0% |
| Tavistock | 20.7% | 10.1% | 1.2% | 0.5% | 4.8% | 4.2% | 1.5% | 0.1% | 0.7% | 0.0% | 0.0% | 0.0% | 0.1% | 0.1% | 3.3% | 2.9% | 2.8% | 29.4% | 2.9% | 14.6% |
| Teignmouth | 21.5% | 10.6% | 1.0% | 0.4% | 3.9% | 3.4% | 1.8% | 0.1% | 0.6% | 0.0% | 0.0% | 0.0% | 0.0% | 0.3% | 3.2% | 3.1% | 2.0% | 31.4% | 2.4% | 14.2% |
| Tiverton | 24.8% | 10.5% | 1.4% | 0.4% | 5.5% | 3.8% | 1.6% | 0.1% | 0.8% | 0.0% | 0.0% | 0.0% | 0.0% | 0.2% | 3.0% | 3.2% | 1.8% | 22.8% | 2.8% | 17.3% |
| Totnes | 18.8% | 10.7% | 1.3% | 0.5% | 5.7% | 6.9% | 1.6% | 0.1% | 0.6% | 0.0% | 0.0% | 0.0% | 0.1% | 0.3% | 3.6% | 3.2% | 2.3% | 25.6% | 3.2% | 15.2% |
| Plymouth | 27.4% | 10.6% | 0.7% | 0.2% | 2.9% | 2.0% | 2.0% | 0.3% | 1.5% | 0.0% | 0.0% | 0.0% | 0.1% | 0.7% | 4.5% | 3.5% | 5.9% | 18.0% | 2.3% | 17.4% |
| Torbay | 22.1% | 11.1% | 0.8% | 0.3% | 4.0% | 3.1% | 2.2% | 0.1% | 0.7% | 0.0% | 0.0% | 0.0% | 0.0% | 0.3% | 5.0% | 3.6% | 2.8% | 25.5% | 2.4% | 16.0% |
| One Devon | 24.2% | 10.8% | 1.0% | 0.3% | 4.2% | 3.4% | 1.7% | 0.2% | 1.0% | 0.0% | 0.0% | 0.0% | 0.1% | 0.4% | 3.6% | 3.1% | 4.5% | 23.2% | 2.1% | 16.2% |
| DCC Devon | 23.5% | 10.8% | 1.2% | 0.4% | 4.7% | 3.8% | 1.6% | 0.2% | 0.9% | 0.0% | 0.0% | 0.0% | 0.1% | 0.4% | 3.0% | 2.9% | 2.0% | 24.5% | 4.3% | 15.8% |
| South West | 26.8% | 10.6% | 1.0% | 0.3% | 4.0% | 3.3% | 1.8% | 0.2% | 1.0% | 0.0% | 0.0% | 0.0% | 0.1% | 0.4% | 3.1% | 3.1% | 2.0% | 21.3% | 4.1% | 16.9% |
| England | 27.9% | 9.7% | 0.9% | 0.3% | 3.7% | 2.9% | 2.3% | 0.3% | 1.0% | 0.0% | 0.0% | 0.0% | 0.1% | 0.5% | 3.3% | 3.9% | 2.6% | 17.5% | 4.6% | 18.6% |
Figure 7.1 b) Economic Activity by devon town
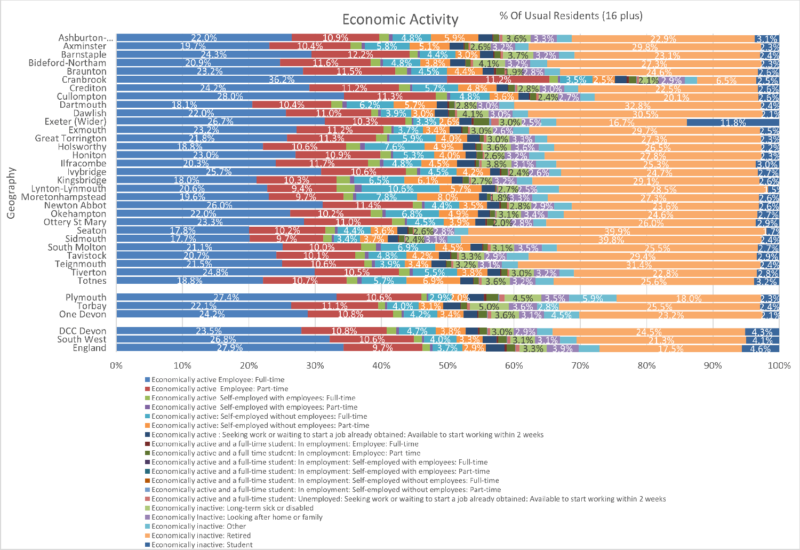
Cranbrook has 36% of its people in full-time employment (but only 6.5% retired), Cullompton have 28% in full-time employment. Seaton and Sidmouth have 40% retired followed by Dartmouth (33%) and Teignmouth (31%).
Map 7.1 c) Unemployed by output area
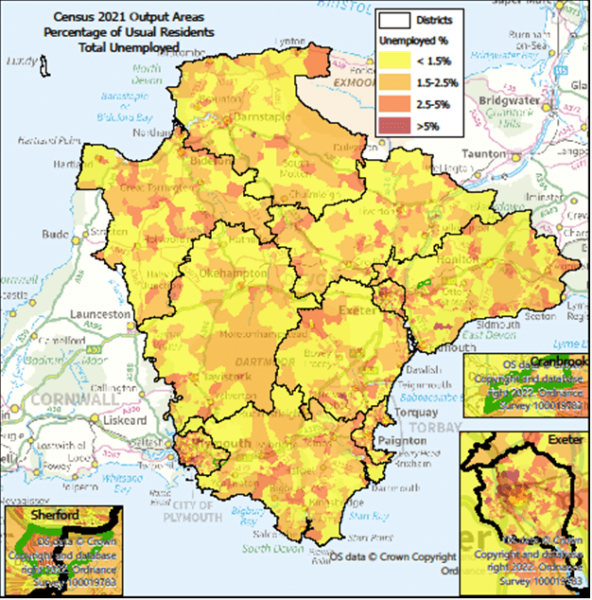
Exeter, Plymouth and Torbay all have areas of unemployment. Barnstaple, Ilfracombe. Tiverton, Cullompton and Ashburton also feature.
Map 7.1 d) Never Worked by output area
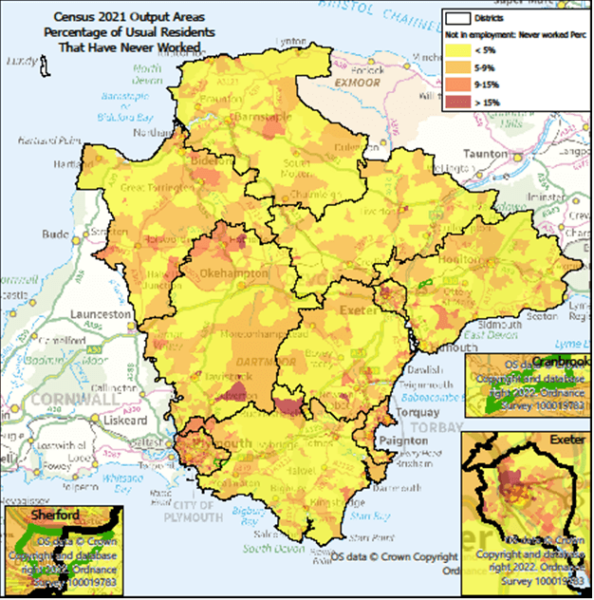
The area around the University seems to the main area in Exeter where people have never worked. Isolated rural areas feature Hatherleigh, Princetown, Holne and Abbotskerswell.
7.2 Employment history
(ONS Table TS065)
Table 7.2 a) Employment History by district
| Area | Not in employment: Worked in the last 12 months | Not in employment: Not worked in the last 12 months | Not in employment: Never worked | Does not apply | Usual Residents | Not in employment: Worked in the last 12 months % | Not in employment: Not worked in the last 12 months % | Not in employment: Never worked % | Does not apply % |
| East Devon | 5,965 | 47,044 | 7,653 | 90,166 | 150,828 | 4.0% | 31.2% | 5.1% | 59.8% |
| Exeter | 11,142 | 28,990 | 11,499 | 79,078 | 130,709 | 8.5% | 22.2% | 8.8% | 60.5% |
| Mid Devon | 3,196 | 20,131 | 4,596 | 54,929 | 82,852 | 3.9% | 24.3% | 5.5% | 66.3% |
| North Devon | 4,390 | 26,760 | 5,881 | 61,581 | 98,612 | 4.5% | 27.1% | 6.0% | 62.4% |
| South Hams | 3,724 | 25,775 | 4,884 | 54,245 | 88,628 | 4.2% | 29.1% | 5.5% | 61.2% |
| Teignbridge | 5,447 | 38,369 | 7,508 | 83,479 | 134,803 | 4.0% | 28.5% | 5.6% | 61.9% |
| Torridge | 2,755 | 20,449 | 4,301 | 40,608 | 68,113 | 4.0% | 30.0% | 6.3% | 59.6% |
| West Devon | 2,264 | 17,350 | 3,365 | 34,117 | 57,096 | 4.0% | 30.4% | 5.9% | 59.8% |
| Plymouth | 13,936 | 61,100 | 22,570 | 167,089 | 264,695 | 5.3% | 23.1% | 8.5% | 63.1% |
| Torbay | 5,876 | 41,371 | 10,850 | 81,227 | 139,324 | 4.2% | 29.7% | 7.8% | 58.3% |
| One Devon | 58,695 | 327,339 | 83,107 | 746,519 | 1,215,660 | 4.8% | 26.9% | 6.8% | 61.4% |
| DCC Devon | 38,883 | 224,868 | 49,687 | 498,203 | 811,641 | 4.8% | 27.7% | 6.1% | 61.4% |
| South West | 268,111 | 1,407,208 | 368,187 | 3,657,680 | 5,701,186 | 4.7% | 24.7% | 6.5% | 64.2% |
| England | 2,592,969 | 11,983,992 | 5,024,787 | 36,888,302 | 56,490,050 | 4.6% | 21.2% | 8.9% | 65.3% |
Figure 7.2 a) Employment History by district
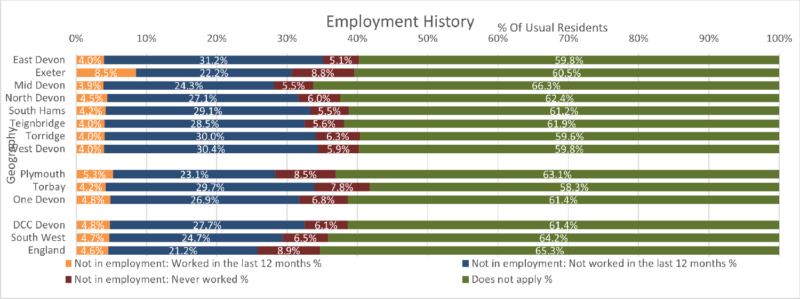
61% in DCC Devon were either in employment, inactive or too young. 5% are unemployed but worked in last 12 months, 28% are unemployed for at least 12 months and 6% have never worked.
Table 7.2 b) Employment History by devon town
| DevonTown | Not in employment: Worked in the last 12 months | Not in employment: Not worked in the last 12 months | Not in employment: Never worked | Does not apply | Usual Residents | Not in employment: Worked in the last 12 months % | Not in employment: Not worked in the last 12 months % | Not in employment: Never worked % | Does not apply % |
| Ashburton-Buckfastleigh | 326 | 2,068 | 473 | 4,927 | 7,794 | 4.2% | 26.5% | 6.1% | 63.2% |
| Axminster | 692 | 5,194 | 878 | 9,474 | 16,238 | 4.3% | 32.0% | 5.4% | 58.3% |
| Barnstaple | 1,967 | 12,662 | 2,920 | 30,765 | 48,314 | 4.1% | 26.2% | 6.0% | 63.7% |
| Bideford-Northam | 1,612 | 11,890 | 2,567 | 22,949 | 39,018 | 4.1% | 30.5% | 6.6% | 58.8% |
| Braunton | 576 | 3,244 | 596 | 8,009 | 12,425 | 4.6% | 26.1% | 4.8% | 64.5% |
| Cranbrook | 228 | 812 | 277 | 6,500 | 7,817 | 2.9% | 10.4% | 3.5% | 83.2% |
| Crediton | 851 | 5,550 | 1,194 | 14,475 | 22,070 | 3.9% | 25.1% | 5.4% | 65.6% |
| Cullompton | 939 | 5,645 | 1,335 | 17,563 | 25,482 | 3.7% | 22.2% | 5.2% | 68.9% |
| Dartmouth | 453 | 3,665 | 590 | 5,872 | 10,580 | 4.3% | 34.6% | 5.6% | 55.5% |
| Dawlish | 707 | 5,542 | 1,024 | 9,364 | 16,637 | 4.2% | 33.3% | 6.2% | 56.3% |
| Exeter (Wider) | 12,063 | 34,544 | 12,596 | 94,941 | 154,144 | 7.8% | 22.4% | 8.2% | 61.6% |
| Exmouth | 2,056 | 15,711 | 2,660 | 28,752 | 49,179 | 4.2% | 31.9% | 5.4% | 58.5% |
| Great Torrington | 412 | 3,252 | 625 | 6,630 | 10,919 | 3.8% | 29.8% | 5.7% | 60.7% |
| Holsworthy | 703 | 5,142 | 1,074 | 10,534 | 17,453 | 4.0% | 29.5% | 6.2% | 60.4% |
| Honiton | 698 | 5,775 | 1,037 | 11,556 | 19,066 | 3.7% | 30.3% | 5.4% | 60.6% |
| Ilfracombe | 905 | 4,815 | 1,152 | 10,160 | 17,032 | 5.3% | 28.3% | 6.8% | 59.7% |
| Ivybridge | 1,401 | 9,666 | 1,962 | 23,917 | 36,946 | 3.8% | 26.2% | 5.3% | 64.7% |
| Kingsbridge | 813 | 5,588 | 956 | 10,494 | 17,851 | 4.6% | 31.3% | 5.4% | 58.8% |
| Lynton-Lynmouth | 79 | 491 | 78 | 960 | 1,608 | 4.9% | 30.5% | 4.9% | 59.7% |
| Moretonhampstead | 206 | 1,253 | 202 | 2,668 | 4,329 | 4.8% | 28.9% | 4.7% | 61.6% |
| Newton Abbot | 2,921 | 19,963 | 4,217 | 48,645 | 75,746 | 3.9% | 26.4% | 5.6% | 64.2% |
| Okehampton | 1,136 | 7,876 | 1,568 | 17,744 | 28,324 | 4.0% | 27.8% | 5.5% | 62.6% |
| Ottery St Mary | 627 | 4,407 | 724 | 9,929 | 15,687 | 4.0% | 28.1% | 4.6% | 63.3% |
| Seaton | 479 | 5,286 | 663 | 6,330 | 12,758 | 3.8% | 41.4% | 5.2% | 49.6% |
| Sidmouth | 674 | 7,039 | 778 | 8,187 | 16,678 | 4.0% | 42.2% | 4.7% | 49.1% |
| South Molton | 670 | 4,281 | 898 | 9,361 | 15,210 | 4.4% | 28.1% | 5.9% | 61.5% |
| Tavistock | 1,220 | 10,167 | 1,904 | 17,661 | 30,952 | 3.9% | 32.8% | 6.2% | 57.1% |
| Teignmouth | 828 | 6,452 | 1,039 | 10,480 | 18,799 | 4.4% | 34.3% | 5.5% | 55.7% |
| Tiverton | 1,585 | 10,036 | 2,318 | 25,388 | 39,327 | 4.0% | 25.5% | 5.9% | 64.6% |
| Totnes | 1,062 | 6,856 | 1,370 | 13,963 | 23,251 | 4.6% | 29.5% | 5.9% | 60.1% |
| Plymouth | 13,936 | 61,100 | 22,570 | 167,089 | 264,695 | 5.3% | 23.1% | 8.5% | 63.1% |
| Torbay | 5,876 | 41,371 | 10,850 | 81,227 | 139,324 | 4.2% | 29.7% | 7.8% | 58.3% |
| One Devon | 58,695 | 327,339 | 83,107 | 746,519 | 1,215,660 | 4.8% | 26.9% | 6.8% | 61.4% |
| DCC Devon | 38,889 | 224,872 | 49,675 | 498,198 | 811,634 | 4.8% | 27.7% | 6.1% | 61.4% |
| South West | 268,111 | 1,407,208 | 368,187 | 3,657,680 | 5,701,186 | 4.7% | 24.7% | 6.5% | 64.2% |
| England | 2,592,969 | 11,983,992 | 5,024,787 | 36,888,302 | 56,490,050 | 4.6% | 21.2% | 8.9% | 65.3% |
Figure 7.2 b) Employment History by devon town
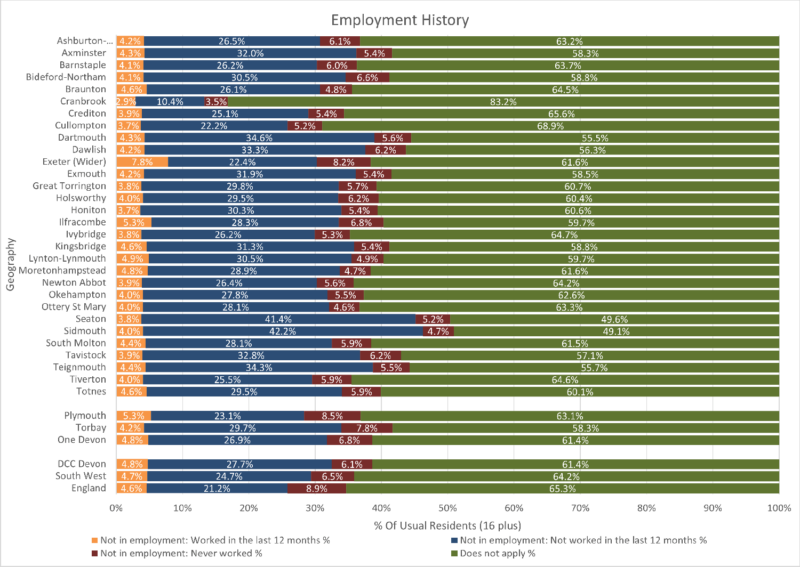
Cranbrook with 17% in the three unemployed is significantly less than the DCC Devon figure of 39% Crediton with 34% is the next lowest. Sidmouth (51%), Seaton (50%) and Teignmouth (44%) have high figures. Exeter (Wider) has high figures in worked in last 12 months (7.8%) and never worked (8.2%).
Map 7.2 c) Never Worked by output area

Exeter (around the Uni), Plymouth & Torbay all have areas where people have never worked. Abbotskerswell, Holne and Princetown are rural areas with high figures.
7.3 Hours worked
(ONS Table TS059)
Table 7.3 a) Hours Worked by district
| Areas | Part-time: 15 hours or less worked | Part-time: 16 to 30 hours worked | Full-time: 31 to 48 hours worked | Full-time: 49 or more hours worked | Does not apply (U16 or not employed?) | Usual Residents | % Part-time: 15 hours or less worked | % Part-time: 16 to 30 hours worked | % Full-time: 31 to 48 hours worked | % Full-time: 49 or more hours worked | % Does not apply |
| East Devon | 8,359 | 15,195 | 35,143 | 8,030 | 84,101 | 150,828 | 5.5% | 10.1% | 23.3% | 5.3% | 55.8% |
| Exeter | 7,394 | 12,409 | 34,634 | 5,263 | 71,009 | 130,709 | 5.7% | 9.5% | 26.5% | 4.0% | 54.3% |
| Mid Devon | 4,586 | 8,779 | 21,569 | 5,348 | 42,570 | 82,852 | 5.5% | 10.6% | 26.0% | 6.5% | 51.4% |
| North Devon | 5,651 | 10,598 | 23,636 | 5,278 | 53,448 | 98,611 | 5.7% | 10.7% | 24.0% | 5.4% | 54.2% |
| South Hams | 5,884 | 9,444 | 20,077 | 5,180 | 48,043 | 88,628 | 6.6% | 10.7% | 22.7% | 5.8% | 54.2% |
| Teignbridge | 7,295 | 14,271 | 33,592 | 6,979 | 72,666 | 134,803 | 5.4% | 10.6% | 24.9% | 5.2% | 53.9% |
| Torridge | 3,842 | 7,334 | 14,726 | 4,151 | 38,061 | 68,114 | 5.6% | 10.8% | 21.6% | 6.1% | 55.9% |
| West Devon | 3,397 | 5,685 | 12,630 | 3,672 | 31,712 | 57,096 | 5.9% | 10.0% | 22.1% | 6.4% | 55.5% |
| Plymouth | 11,999 | 26,127 | 71,595 | 11,297 | 143,677 | 264,695 | 4.5% | 9.9% | 27.0% | 4.3% | 54.3% |
| Torbay | 6,943 | 14,221 | 32,078 | 5,693 | 80,389 | 139,324 | 5.0% | 10.2% | 23.0% | 4.1% | 57.7% |
| One Devon | 65,350 | 124,063 | 299,680 | 60,891 | 665,676 | 1,215,660 | 5.4% | 10.2% | 24.7% | 5.0% | 54.8% |
| DCC Devon | 46,408 | 83,715 | 196,007 | 43,901 | 441,610 | 811,641 | 5.7% | 10.3% | 24.1% | 5.4% | 54.4% |
| South West | 303,625 | 564,787 | 1,534,131 | 289,791 | 3,008,852 | 5,701,186 | 5.3% | 9.9% | 26.9% | 5.1% | 52.8% |
| England | 2,731,449 | 5,139,988 | 15,608,863 | 2,924,913 | 30,084,833 | 56,490,046 | 4.8% | 9.1% | 27.6% | 5.2% | 53.3% |
Figure 7.3 a) Hours Worked by district
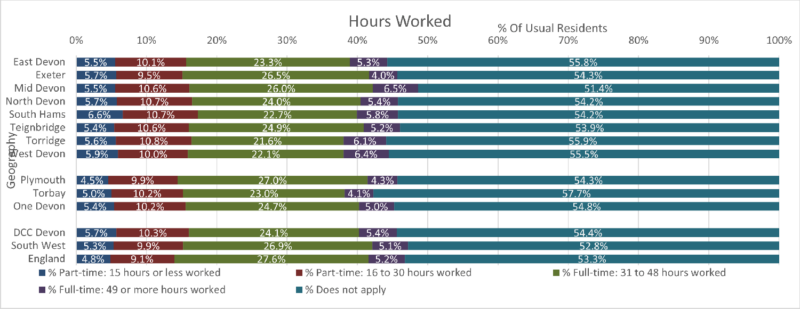
5.4% of DCC Devon work 49 hrs or more per week, 24% 31-48 hrs per week, 10% 16-30 hrs part-time and 6% 15 hrs or less part-time. Mid Devon, Torridge and West Devon have more than 6% in the 49hrs plus category.
Table 7.3 b) Hours Worked by devon town
| Area | Part-time: 15 hours or less worked | Part-time: 16 to 30 hours worked | Full-time: 31 to 48 hours worked | Full-time: 49 or more hours worked | Does not apply | Usual Residents | % Part-time: 15 hours or less worked | % Part-time: 16 to 30 hours worked | % Full-time: 31 to 48 hours worked | % Full-time: 49 or more hours worked | % Does not apply |
| Ashburton-Buckfastleigh | 533 | 876 | 1,830 | 363 | 4,189 | 7,791 | 6.8% | 11.2% | 23.5% | 4.7% | 53.8% |
| Axminster | 1,017 | 1,656 | 3,394 | 983 | 9,190 | 16,240 | 6.3% | 10.2% | 20.9% | 6.1% | 56.6% |
| Barnstaple | 2,553 | 5,350 | 12,220 | 2,200 | 25,986 | 48,309 | 5.3% | 11.1% | 25.3% | 4.6% | 53.8% |
| Bideford-Northam | 2,121 | 4,260 | 8,596 | 1,930 | 22,123 | 39,030 | 5.4% | 10.9% | 22.0% | 4.9% | 56.7% |
| Braunton | 822 | 1,345 | 2,987 | 671 | 6,599 | 12,424 | 6.6% | 10.8% | 24.0% | 5.4% | 53.1% |
| Cranbrook | 309 | 839 | 2,758 | 446 | 3,466 | 7,818 | 4.0% | 10.7% | 35.3% | 5.7% | 44.3% |
| Crediton | 1,352 | 2,425 | 5,523 | 1,411 | 11,354 | 22,065 | 6.1% | 11.0% | 25.0% | 6.4% | 51.5% |
| Cullompton | 1,330 | 2,756 | 7,041 | 1,701 | 12,647 | 25,475 | 5.2% | 10.8% | 27.6% | 6.7% | 49.6% |
| Dartmouth | 788 | 1,067 | 2,096 | 652 | 5,979 | 10,582 | 7.4% | 10.1% | 19.8% | 6.2% | 56.5% |
| Dawlish | 857 | 1,674 | 3,825 | 666 | 9,616 | 16,638 | 5.2% | 10.1% | 23.0% | 4.0% | 57.8% |
| Exeter (Wider) | 8,642 | 14,910 | 41,094 | 6,809 | 82,698 | 154,153 | 5.6% | 9.7% | 26.7% | 4.4% | 53.6% |
| Exmouth | 2,710 | 5,015 | 11,427 | 2,359 | 27,674 | 49,185 | 5.5% | 10.2% | 23.2% | 4.8% | 56.3% |
| Great Torrington | 581 | 1,183 | 2,506 | 687 | 5,962 | 10,919 | 5.3% | 10.8% | 23.0% | 6.3% | 54.6% |
| Holsworthy | 1,104 | 1,824 | 3,500 | 1,443 | 9,581 | 17,452 | 6.3% | 10.5% | 20.1% | 8.3% | 54.9% |
| Honiton | 1,072 | 1,970 | 4,490 | 1,163 | 10,369 | 19,064 | 5.6% | 10.3% | 23.6% | 6.1% | 54.4% |
| Ilfracombe | 1,092 | 1,848 | 3,731 | 834 | 9,526 | 17,031 | 6.4% | 10.9% | 21.9% | 4.9% | 55.9% |
| Ivybridge | 2,100 | 3,851 | 9,515 | 2,246 | 19,227 | 36,939 | 5.7% | 10.4% | 25.8% | 6.1% | 52.1% |
| Kingsbridge | 1,304 | 1,836 | 3,637 | 1,068 | 10,004 | 17,849 | 7.3% | 10.3% | 20.4% | 6.0% | 56.0% |
| Lynton-Lynmouth | 122 | 141 | 392 | 152 | 803 | 1,610 | 7.6% | 8.8% | 24.3% | 9.4% | 49.9% |
| Moretonhampstead | 293 | 509 | 952 | 289 | 2,289 | 4,332 | 6.8% | 11.7% | 22.0% | 6.7% | 52.8% |
| Newton Abbot | 4,068 | 8,103 | 19,875 | 4,076 | 39,621 | 75,743 | 5.4% | 10.7% | 26.2% | 5.4% | 52.3% |
| Okehampton | 1,749 | 2,840 | 6,561 | 2,044 | 15,136 | 28,330 | 6.2% | 10.0% | 23.2% | 7.2% | 53.4% |
| Ottery St Mary | 932 | 1,587 | 3,721 | 924 | 8,535 | 15,699 | 5.9% | 10.1% | 23.7% | 5.9% | 54.4% |
| Seaton | 681 | 1,201 | 2,443 | 562 | 7,875 | 12,762 | 5.3% | 9.4% | 19.1% | 4.4% | 61.7% |
| Sidmouth | 910 | 1,501 | 3,067 | 669 | 10,528 | 16,675 | 5.5% | 9.0% | 18.4% | 4.0% | 63.1% |
| South Molton | 853 | 1,526 | 3,464 | 1,085 | 8,275 | 15,203 | 5.6% | 10.0% | 22.8% | 7.1% | 54.4% |
| Tavistock | 1,782 | 3,054 | 6,512 | 1,800 | 17,808 | 30,956 | 5.8% | 9.9% | 21.0% | 5.8% | 57.5% |
| Teignmouth | 942 | 1,889 | 4,143 | 846 | 10,998 | 18,818 | 5.0% | 10.0% | 22.0% | 4.5% | 58.4% |
| Tiverton | 2,104 | 4,000 | 9,890 | 2,600 | 20,730 | 39,324 | 5.4% | 10.2% | 25.2% | 6.6% | 52.7% |
| Totnes | 1,690 | 2,693 | 4,828 | 1,212 | 12,830 | 23,253 | 7.3% | 11.6% | 20.8% | 5.2% | 55.2% |
| Plymouth | 11,999 | 26,127 | 71,595 | 11,297 | 143,677 | 264,695 | 4.5% | 9.9% | 27.0% | 4.3% | 54.3% |
| Torbay | 6,943 | 14,221 | 32,078 | 5,693 | 80,389 | 139,324 | 5.0% | 10.2% | 23.0% | 4.1% | 57.7% |
| One Devon | 65,350 | 124,063 | 299,680 | 60,891 | 665,676 | 1,215,660 | 5.4% | 10.2% | 24.7% | 5.0% | 54.8% |
| DCC Devon | 46,408 | 83,715 | 196,007 | 43,901 | 441,610 | 811,641 | 5.7% | 10.3% | 24.1% | 5.4% | 54.4% |
| South West | 303,625 | 564,787 | 1,534,131 | 289,791 | 3,008,852 | 5,701,186 | 5.3% | 9.9% | 26.9% | 5.1% | 52.8% |
| England | 2,731,449 | 5,139,988 | 15,608,863 | 2,924,913 | 30,084,833 | 56,490,046 | 4.8% | 9.1% | 27.6% | 5.2% | 53.3% |
Figure 7.3 b) Hours Worked by devon town
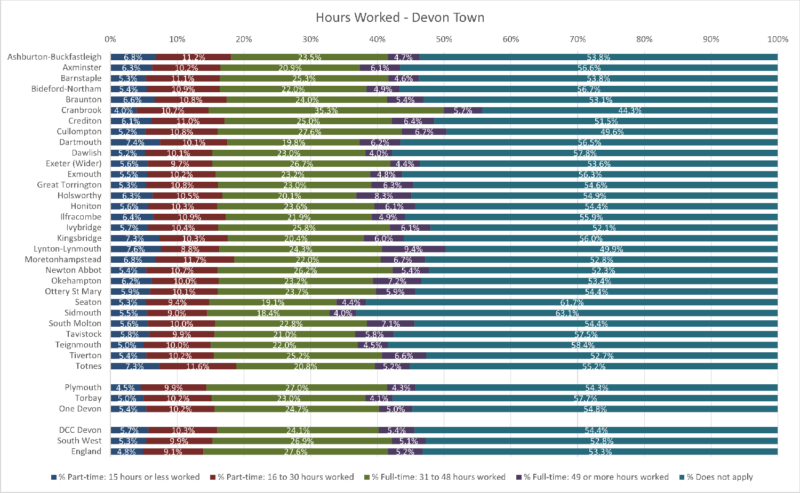
P-T<= 15hrs pw Lynton/Lynmouth (8%), Dartmouth (7%), Kingsbridge (7%) and Totnes (7%). P-T 16-30hrs Moretonhampstead (12%) and Totnes (11%). F-T 31-48 hrs Cranbrook (35%) and Cullompton (28%). F-T => 49 hrs Lynton/Lynmouth (9%) and Holsworthy (8%).
Map 7.3 c) 49+ hrs worked per week.
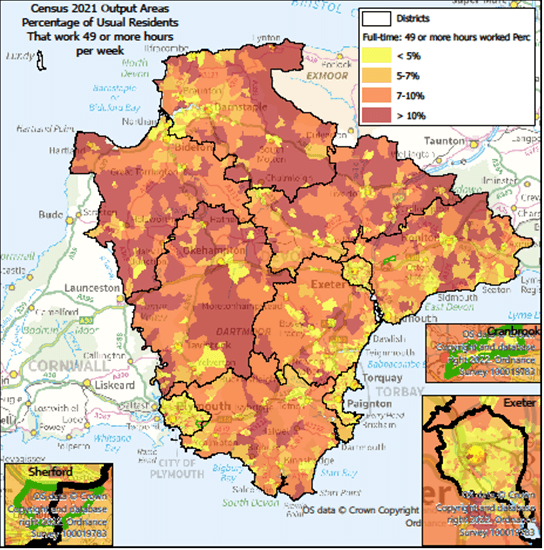
The rural nature of people working 49+ hours per week suggests it could be farmers working these long hours.
7.4 Industry
(ONS Table TS060)
Table 7.4 a) Larger Industries by district
| Area | 01 Crop and animal production, hunting and related service activities | 41 Construction of buildings; 42 Civil engineering; 43 Specialised construction activities | 46 Wholesale trade, except of motor vehicles and motorcycles | 47 Retail trade, except of motor vehicles and motorcycles | 56 Food and beverage service activities | 62 Computer programming, consultancy and related activities | 63 Information service activities | 81 Services to buildings and landscape activities | 84 Public administration and defence; compulsory social security | 85 Education | 86 Human health activities | 87 Residential care activities | 88 Social work activities without accommodation | Usual Residents |
| East Devon | 1,783 | 6,267 | 1,628 | 6,842 | 2,964 | 1,173 | 33 | 2,167 | 4,285 | 6,439 | 5,850 | 1,648 | 3,082 | 150,828 |
| Exeter | 207 | 4,570 | 1,415 | 6,167 | 2,809 | 1,173 | 60 | 1,448 | 3,565 | 8,109 | 7,741 | 970 | 2,425 | 130,710 |
| Mid Devon | 2,177 | 4,026 | 1,530 | 3,989 | 1,310 | 610 | 18 | 1,130 | 2,099 | 3,909 | 2,982 | 714 | 1,875 | 82,847 |
| North Devon | 2,097 | 4,433 | 1,169 | 4,949 | 2,307 | 538 | 19 | 1,355 | 2,080 | 3,853 | 4,604 | 952 | 1,932 | 98,613 |
| South Hams | 1,253 | 4,061 | 894 | 3,873 | 1,847 | 673 | 19 | 1,377 | 2,521 | 4,392 | 3,755 | 640 | 1,711 | 88,623 |
| Teignbridge | 1,013 | 6,397 | 1,789 | 6,248 | 2,734 | 960 | 52 | 1,799 | 3,572 | 6,063 | 6,370 | 1,348 | 3,055 | 134,806 |
| Torridge | 2,075 | 3,366 | 810 | 3,148 | 1,150 | 331 | 6 | 878 | 1,161 | 2,618 | 2,132 | 993 | 1,610 | 68,118 |
| West Devon | 1,491 | 2,487 | 637 | 2,462 | 1,055 | 346 | 10 | 753 | 1,477 | 2,496 | 2,080 | 578 | 1,135 | 57,086 |
| Plymouth | 188 | 11,249 | 2,633 | 12,630 | 5,514 | 1,428 | 76 | 2,934 | 12,535 | 11,866 | 13,510 | 2,435 | 5,996 | 264,699 |
| Torbay | 184 | 6,048 | 1,579 | 6,881 | 3,220 | 635 | 26 | 1,557 | 2,876 | 5,156 | 7,014 | 1,789 | 3,288 | 139,326 |
| One Devon | 12,468 | 52,904 | 14,084 | 57,189 | 24,910 | 7,867 | 319 | 15,398 | 36,171 | 54,901 | 56,038 | 12,067 | 26,109 | 1,215,656 |
| DCC Devon | 12,096 | 35,607 | 9,872 | 37,678 | 16,176 | 5,804 | 217 | 10,907 | 20,760 | 37,879 | 35,514 | 7,843 | 16,825 | 811,631 |
| South West | 40,297 | 245,894 | 70,340 | 272,531 | 114,975 | 64,696 | 2,065 | 74,205 | 179,397 | 259,274 | 239,283 | 51,969 | 119,657 | 5,701,184 |
| England | 199,945 | 2,288,550 | 735,142 | 2,707,341 | 1,093,910 | 770,879 | 31,484 | 679,681 | 1,521,181 | 2,601,728 | 2,343,838 | 405,652 | 1,107,161 | 56,490,053 |
Figure 7.4 a) Larger Industries by district
| Area | 01 Crop and animal production, hunting and related service activities | 41 Construction of buildings; 42 Civil engineering; 43 Specialised construction activities | 46 Wholesale trade, except of motor vehicles and motorcycles | 47 Retail trade, except of motor vehicles and motorcycles | 56 Food and beverage service activities | 62 Computer programming, consultancy and related activities | 63 Information service activities | 81 Services to buildings and landscape activities | 84 Public administration and defence; compulsory social securit | 85 Education | 86 Human health activities | 87 Residential care activities | 88 Social work activities without accommodation |
| East Devon | 1.2% | 4.2% | 1.1% | 4.5% | 2.0% | 0.8% | 0.0% | 1.4% | 2.8% | 4.3% | 3.9% | 1.1% | 2.0% |
| Exeter | 0.2% | 3.5% | 1.1% | 4,7% | 2.1% | 0.9% | 0.0% | 1.1% | 2.7% | 6.2% | 5.9% | 0.7% | 1.9% |
| Mid Devon | 2.6% | 4.9% | 1.8% | 4,8% | 1.6% | 0.7% | 0.0% | 1.4% | 2.5% | 4.7% | 3.6% | 0.9% | 2.3% |
| North Devon | 2.1% | 4.5% | 1.2% | 5.0% | 2.3% | 0.5% | 0.0% | 1.4% | 2.1% | 3.9% | 4.7% | 1.0% | 2.0% |
| South Hams | 1.4% | 4.6% | 1.0% | 4.4% | 2.1% | 0.8% | 0.0% | 1.6% | 2.8% | 5.0% | 4.2% | 0.7% | 1.9% |
| Teignbridge | 0.8% | 4.7% | 1.3% | 4.6% | 2.0% | 0.7% | 0.0% | 1.3% | 2.6% | 4.5% | 4.7% | 1.0% | 2.3% |
| Torridge | 3.0% | 4.9% | 1.2% | 4.6% | 1.7% | 0.5% | 0.0% | 1.3% | 1.7% | 3.8% | 3.1% | 1.5% | 2.4% |
| West Devon | 2.6% | 4.4% | 1.1% | 4.3% | 1.8% | 0.6% | 0.0% | 1.3% | 2.6% | 4.4% | 3.6% | 1.0% | 2.0% |
| Plymouth | 0.1% | 4.2% | 1.0% | 4.8% | 2.1% | 0.5% | 0.0% | 1.1% | 4.7% | 4.5% | 5.1% | 0.9% | 2.3% |
| Torbay | 0.1% | 4.3% | 1.1% | 4.9% | 2.3% | 0.5% | 0.0% | 1.1% | 2.1% | 3.7% | 5.0% | 1.3% | 2.4% |
| One Devon | 1.0% | 4.4% | 1.2% | 4.7% | 2.0% | 0.6% | 0.0% | 1.3% | 3.0% | 4.5% | 4.6% | 1.0% | 2.1% |
| DCC Devon | 1.5% | 4.4% | 1.2% | 4.6% | 2.0% | 0.7% | 0.0% | 1.3% | 2.6% | 4.7% | 4.4% | 1.0% | 2.1% |
| South West | 0.7% | 4.3% | 1.2% | 4.8% | 2.0% | 1.1% | 0.0% | 1.3% | 3.1% | 4.5% | 4.2% | 0.9% | 2.1% |
| England | 0.4% | 4.1% | 1.3% | 4.8% | 1.9% | 1.4% | 0.1% | 1.2% | 2.7% | 4.6% | 4.1% | 0.7% | 2.0% |
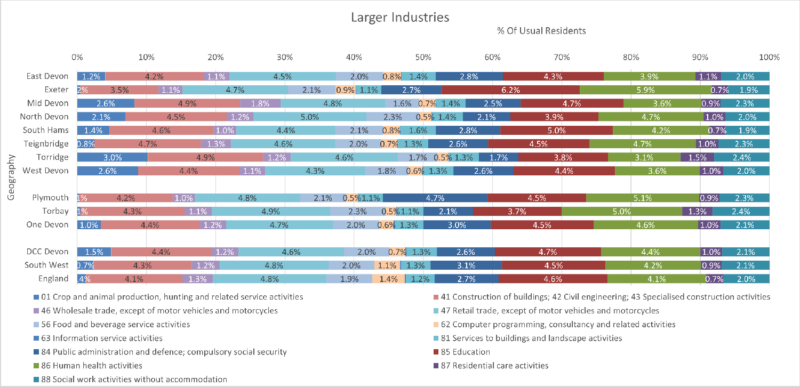
Generally, in these larger Industries we follow the SW and England comparators. The major difference come in 01 Crop and animal production etc category – apart from Exeter the districts have quite high percentages in this agriculture area. We are relatively poorly off in the 62 computer programming section.
7.5 Occupation Group
(ONS Table TS063)
Table 7.5 a) Occupation Group by district
| Area | 1. Managers, directors and senior officials | 2. Professional occupations | 3. Associate professional and technical occupations | 4. Administrative and secretarial occupations | 5. Skilled trades occupations | 6. Caring, leisure and other service occupations | 7. Sales and customer service occupations | 8. Process, plant and machine operatives | 9. Elementary occupations | Does not apply | Usual Residents |
| East Devon | 9,439 | 11,685 | 8,238 | 5,924 | 9,142 | 7,048 | 5,250 | 3,606 | 6,397 | 84,109 | 150,838 |
| Exeter | 5,849 | 14,754 | 7,327 | 5,298 | 5,353 | 5,801 | 5,106 | 3,651 | 6,559 | 71,009 | 130,707 |
| Mid Devon | 5,312 | 6,476 | 4,424 | 3,586 | 6,031 | 3,910 | 3,131 | 3,276 | 4,123 | 42,571 | 82,840 |
| North Devon | 5,749 | 6,901 | 5,073 | 3,614 | 7,156 | 4,878 | 3,407 | 3,239 | 5,164 | 53,448 | 98,629 |
| South Hams | 6,743 | 8,282 | 5,139 | 3,263 | 6,133 | 3,281 | 2,677 | 1,733 | 3,348 | 48,040 | 88,639 |
| Teignbridge | 8,408 | 11,546 | 7,545 | 5,512 | 8,128 | 6,674 | 4,664 | 3,918 | 5,751 | 72,671 | 134,817 |
| Torridge | 3,598 | 3,803 | 2,900 | 2,525 | 5,645 | 3,724 | 2,331 | 2,209 | 3,329 | 38,063 | 68,127 |
| West Devon | 3,452 | 4,443 | 2,889 | 2,121 | 4,267 | 2,451 | 1,748 | 1,536 | 2,469 | 31,707 | 57,083 |
| Plymouth | 10,872 | 20,138 | 15,670 | 11,413 | 15,498 | 13,829 | 11,106 | 9,028 | 13,468 | 143,681 | 264,703 |
| Torbay | 7,202 | 8,240 | 6,358 | 4,944 | 7,763 | 8,343 | 5,155 | 4,097 | 6,819 | 80,387 | 139,308 |
| One Devon | 66,624 | 96,268 | 65,563 | 48,200 | 75,116 | 59,939 | 44,575 | 36,293 | 57,427 | 665,686 | 1,215,691 |
| DCC Devon | 48,550 | 67,890 | 43,535 | 31,843 | 51,855 | 37,767 | 28,314 | 23,168 | 37,140 | 441,618 | 811,680 |
| South West | 344,168 | 513,706 | 344,899 | 250,257 | 326,017 | 266,925 | 202,354 | 173,764 | 270,244 | 3,008,852 | 5,701,186 |
| England | 3,403,916 | 5,356,648 | 3,499,749 | 2,446,563 | 2,683,139 | 2,447,147 | 1,972,553 | 1,832,667 | 2,762,830 | 30,084,833 | 56,490,045 |
| Area | 1. Managers, directors and senior officials % | 2. Professional occupations % | 3. Associate professional and technical occupations % | 4. Administrative and secretarial occupations % | 5. Skilled trades occupations % | 6. Caring, leisure and other service occupations % | 7. Sales and customer service occupations % | 8. Process, plant and machine operatives % | 9. Elementary occupations % | Does not apply % |
| East Devon | 6.3% | 7.7% | 5.5% | 3.9% | 6.1% | 4.7% | 3.5% | 2.4% | 4.2% | 55.8% |
| Exeter | 4.5% | 11.3% | 5.6% | 4.1% | 4.1% | 4.4% | 3.9% | 2.8% | 5.0% | 54.3% |
| Mid Devon | 6.4% | 7.8% | 5.3% | 4.3% | 7.3% | 4.7% | 3.8% | 4.0% | 5.0% | 51.4% |
| North Devon | 5.8% | 7.0% | 5.1% | 3.7% | 7.3% | 4.9% | 3.5% | 3.3% | 5.2% | 54.2% |
| South Hams | 7.6% | 9.3% | 5.8% | 3.7% | 6.9% | 3.7% | 3.0% | 2.0% | 3.8% | 54.2% |
| Teignbridge | 6.2% | 8.6% | 5.6% | 4.1% | 6.0% | 5.0% | 3.5% | 2.9% | 4.3% | 53.9% |
| Torridge | 5.3% | 5.6% | 4.3% | 3.7% | 8.3% | 5.5% | 3.4% | 3.2% | 4.9% | 55.9% |
| West Devon | 6.0% | 7.8% | 5.1% | 3.7% | 7.5% | 4.3% | 3.1% | 2.7% | 4.3% | 55.5% |
| Plymouth | 4.1% | 7.6% | 5.9% | 4.3% | 5.9% | 5.2% | 4.2% | 3.4% | 5.1% | 54.3% |
| Torbay | 5.2% | 5.9% | 4.6% | 3.5% | 5.6% | 6.0% | 3.7% | 2.9% | 4.9% | 57.7% |
| One Devon | 5.5% | 7.9% | 5.4% | 4.0% | 6.2% | 4.9% | 3.7% | 3.0% | 4.7% | 54.8% |
| DCC Devon | 6.0% | 8.4% | 5.4% | 3.9% | 6.4% | 4.7% | 3.5% | 2.9% | 4.6% | 54.4% |
| South West | 6.0% | 9.0% | 6.0% | 4.4% | 5.7% | 4.7% | 3.5% | 3.0% | 4.7% | 52.8% |
| England | 6.0% | 9.5% | 6.2% | 4.3% | 4.7% | 4.3% | 3.5% | 3.2% | 4.9% | 53.3% |
Figure 7.5 a) Occupation Group by district
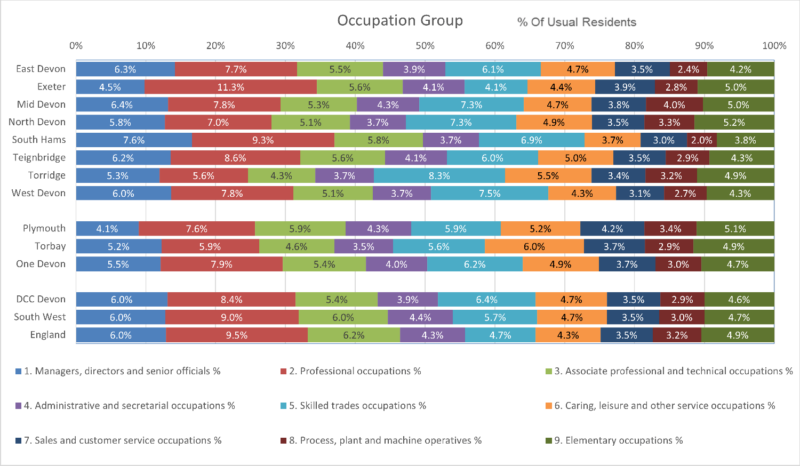
DCC Devon is quite closely matched to the SW & England figures. There is some variation within the Districts – Exeter has more 2 Professional, South Hams has both 1 Managers and 2 Professional and Torridge has 5 Skilled trades.
Table 7.5 b) Occupation Group by devon town
| Area | 1. Managers, directors and senior officials | 2. Professional occupations | 3. Associate professional and technical occupations | 4. Administrative and secretarial occupations | 5. Skilled trades occupations | 6. Caring, leisure and other service occupations | 7. Sales and customer service occupations | 8. Process, plant and machine operatives | 9. Elementary occupations | Does not apply | Usual Residents |
| Ashburton-Buckfastleigh | 462 | 698 | 433 | 245 | 540 | 349 | 244 | 254 | 377 | 4,189 | 7,791 |
| Axminster | 1,040 | 1,057 | 765 | 574 | 1,209 | 738 | 535 | 412 | 721 | 9,190 | 16,241 |
| Barnstaple | 2,527 | 3,524 | 2,394 | 1,851 | 3,199 | 2,515 | 1,873 | 1,738 | 2,714 | 25,986 | 48,321 |
| Bideford-Northam | 1,904 | 2,296 | 1,782 | 1,409 | 2,760 | 2,277 | 1,352 | 1,205 | 1,921 | 22,123 | 39,029 |
| Braunton | 857 | 1,046 | 1,046 | 436 | 753 | 508 | 361 | 275 | 541 | 6,599 | 12,422 |
| Cranbrook | 527 | 846 | 652 | 486 | 427 | 442 | 327 | 261 | 383 | 3,466 | 7,817 |
| Crediton | 1,402 | 1,817 | 1,123 | 984 | 1,710 | 1,038 | 797 | 788 | 1,050 | 11,354 | 22,063 |
| Cullompton | 1,773 | 2,099 | 1,516 | 1,220 | 1,740 | 1,217 | 978 | 1,024 | 1,259 | 12,647 | 25,473 |
| Dartmouth | 882 | 671 | 549 | 426 | 761 | 335 | 336 | 146 | 492 | 5,979 | 10,577 |
| Dawlish | 872 | 1,058 | 811 | 629 | 904 | 951 | 602 | 418 | 776 | 9,616 | 16,637 |
| Exeter (Wider) | 7,711 | 17,522 | 8,917 | 6,370 | 6,721 | 6,702 | 5,835 | 4,253 | 7,412 | 82,698 | 154,141 |
| Exmouth | 2,867 | 3,717 | 2,826 | 1,862 | 2,673 | 2,575 | 1,748 | 1,144 | 2,097 | 27,674 | 49,183 |
| Great Torrington | 568 | 653 | 439 | 398 | 974 | 598 | 373 | 443 | 511 | 5,962 | 10,919 |
| Holsworthy | 1,098 | 857 | 650 | 680 | 1,815 | 833 | 576 | 507 | 864 | 9,581 | 17,461 |
| Honiton | 1,147 | 1,289 | 876 | 753 | 1,453 | 919 | 691 | 551 | 1,021 | 10,369 | 19,069 |
| Ilfracombe | 1,075 | 993 | 719 | 560 | 1,188 | 869 | 579 | 597 | 926 | 9,526 | 17,032 |
| Ivybridge | 2,702 | 3,938 | 2,324 | 1,588 | 2,445 | 1,450 | 1,123 | 899 | 1,252 | 19,227 | 36,948 |
| Kingsbridge | 1,503 | 1,178 | 757 | 564 | 1,490 | 638 | 600 | 308 | 816 | 10,004 | 17,858 |
| Lynton-Lynmouth | 174 | 79 | 70 | 51 | 149 | 94 | 71 | 36 | 81 | 803 | 1,608 |
| Moretonhampstead | 347 | 469 | 240 | 138 | 343 | 154 | 97 | 98 | 154 | 2,289 | 4,329 |
| Newton Abbot | 4,793 | 6,462 | 4,393 | 3,366 | 4,671 | 3,805 | 2,784 | 2,467 | 3,393 | 39,621 | 75,755 |
| Okehampton | 1,798 | 1,901 | 1,399 | 1,126 | 2,462 | 1,277 | 926 | 955 | 1,342 | 15,136 | 28,322 |
| Ottery St Mary | 1,106 | 1,548 | 905 | 654 | 942 | 606 | 507 | 331 | 565 | 8,535 | 15,699 |
| Seaton | 724 | 668 | 514 | 393 | 784 | 603 | 441 | 257 | 505 | 7,875 | 12,764 |
| Sidmouth | 922 | 1,035 | 719 | 541 | 831 | 679 | 537 | 288 | 596 | 10,528 | 16,676 |
| South Molton | 837 | 979 | 677 | 577 | 1,470 | 738 | 423 | 483 | 753 | 8,275 | 15,212 |
| Tavistock | 1,787 | 2,669 | 1,585 | 1,085 | 1,996 | 1,246 | 891 | 664 | 1,219 | 17,808 | 30,950 |
| Teignmouth | 1,046 | 1,464 | 964 | 669 | 1,009 | 958 | 619 | 411 | 673 | 10,998 | 18,811 |
| Tiverton | 2,443 | 2,862 | 1,981 | 1,523 | 2,999 | 1,795 | 1,470 | 1,575 | 1,938 | 20,730 | 39,316 |
| Totnes | 1,656 | 2,495 | 1,509 | 685 | 1,437 | 858 | 618 | 380 | 788 | 12,830 | 23,256 |
| Plymouth | 10,872 | 20,138 | 15,670 | 11,413 | 15,498 | 13,829 | 11,106 | 9,028 | 13,468 | 143,681 | 264,703 |
| Torbay | 7,202 | 8,240 | 6,358 | 4,944 | 7,763 | 8,343 | 5,155 | 4,097 | 6,819 | 80,387 | 139,308 |
| One Devon | 66,624 | 96,268 | 65,563 | 48,200 | 75,116 | 59,939 | 44,575 | 36,293 | 57,427 | 665,686 | 1,215,691 |
| DCC Devon | 48,550 | 67,890 | 43,535 | 31,843 | 51,855 | 37,767 | 28,314 | 23,168 | 37,140 | 441,618 | 811,680 |
| South West | 344,168 | 513,706 | 344,899 | 250,257 | 326,017 | 266,925 | 202,354 | 173,764 | 270,244 | 3,008,852 | 5,701,186 |
| England | 3,403,916 | 5,356,648 | 3,499,749 | 2,446,563 | 2,683,139 | 2,447,147 | 1,972,553 | 1,832,667 | 2,762,830 | 30,084,833 | 56,490,045 |
| Area | 1. Managers, directors and senior officials | 2. Professional occupations | 3. Associate professional and technical occupations | 4. Administrative and secretarial occupations | 5. Skilled trades occupations | 6. Caring, leisure and other service occupations | 7. Sales and customer service occupations | 8. Process, plant and machine operatives | 9. Elementary occupations | Does not apply |
| Ashburton-Buckfastleigh | 5.9% | 9.0% | 5.6% | 3.1% | 6.9% | 4.5% | 3.1% | 3.3% | 4.8% | 53.8% |
| Axminster | 6.4% | 6.5% | 4.7% | 3.5% | 7.4% | 4.5% | 3.3% | 2.5% | 4.4% | 56.6% |
| Barnstaple | 5.2% | 7.3% | 5.0% | 3.8% | 6.6% | 5.2% | 3.9% | 3.6% | 5.6% | 53.8% |
| Bideford-Northam | 4.9% | 5.9% | 4.6% | 3.6% | 7.1% | 5.8% | 3.5% | 3.1% | 4.9% | 56.7% |
| Braunton | 6.9% | 8.4% | 8.4% | 3.5% | 6.1% | 4.1% | 2.9% | 2.2% | 4.4% | 53.1% |
| Cranbrook | 6.7% | 10.8% | 8.3% | 6.2% | 5.5% | 5.7% | 4.2% | 3.3% | 4.9% | 44.3% |
| Crediton | 6.4% | 8.2% | 5.1% | 4.5% | 7.8% | 4.7% | 3.6% | 3.6% | 4.8% | 51.5% |
| Cullompton | 7.0% | 8.2% | 6.0% | 4.8% | 6.8% | 4.8% | 3.8% | 4.0% | 4.9% | 49.6% |
| Dartmouth | 8.3% | 6.3% | 5.2% | 4.0% | 7.2% | 3.2% | 3.2% | 1.4% | 4.7% | 56.5% |
| Dawlish | 5.2% | 6.4% | 4.9% | 3.8% | 5.4% | 5.7% | 3.6% | 2.5% | 4.7% | 57.8% |
| Exeter (Wider) | 5.0% | 11.4% | 5.8% | 4.1% | 4.4% | 4.3% | 3.8% | 2.8% | 4.8% | 53.7% |
| Exmouth | 5.8% | 7.6% | 5.7% | 3.8% | 5.4% | 5.2% | 3.6% | 2.3% | 4.3% | 56.3% |
| Great Torrington | 5.2% | 6.0% | 4.0% | 3.6% | 8.9% | 5.5% | 3.4% | 4.1% | 4.7% | 54.6% |
| Holsworthy | 6.3% | 4.9% | 3.7% | 3.9% | 10.4% | 4.8% | 3.3% | 2.9% | 4.9% | 54.9% |
| Honiton | 6.0% | 6.8% | 4.6% | 3.9% | 7.6% | 4.8% | 3.6% | 2.9% | 5.4% | 54.4% |
| Ilfracombe | 6.3% | 5.8% | 4.2% | 3.3% | 7.0% | 5.1% | 3.4% | 3.5% | 5.4% | 55.9% |
| Ivybridge | 7.3% | 10.7% | 6.3% | 4.3% | 6.6% | 3.9% | 3.0% | 2.4% | 3.4% | 52.0% |
| Kingsbridge | 8.4% | 6.6% | 4.2% | 3.2% | 8.3% | 3.6% | 3.4% | 1.7% | 4.6% | 56.0% |
| Lynton-Lynmouth | 10.8% | 4.9% | 4.4% | 3.2% | 9.3% | 5.8% | 4.4% | 2.2% | 5.0% | 49.9% |
| Moretonhampstead | 8.0% | 10.8% | 5.5% | 3.2% | 7.9% | 3.6% | 2.2% | 2.3% | 3.6% | 52.9% |
| Newton Abbot | 6.3% | 8.5% | 5.8% | 4.4% | 6.2% | 5.0% | 3.7% | 3.3% | 4.5% | 52.3% |
| Okehampton | 6.3% | 6.7% | 4.9% | 4.0% | 8.7% | 4.5% | 3.3% | 3.4% | 4.7% | 53.4% |
| Ottery St Mary | 7.0% | 9.9% | 5.8% | 4.2% | 6.0% | 3.9% | 3.2% | 2.1% | 3.6% | 54.4% |
| Seaton | 5.7% | 5.2% | 4.0% | 3.1% | 6.1% | 4.7% | 3.5% | 2.0% | 4.0% | 61.7% |
| Sidmouth | 5.5% | 6.2% | 4.3% | 3.2% | 5.0% | 4.1% | 3.2% | 1.7% | 3.6% | 63.1% |
| South Molton | 5.5% | 6.4% | 4.5% | 3.8% | 9.7% | 4.9% | 2.8% | 3.2% | 5.0% | 54.4% |
| Tavistock | 5.8% | 8.6% | 5.1% | 3.5% | 6.4% | 4.0% | 2.9% | 2.1% | 3.9% | 57.5% |
| Teignmouth | 5.6% | 7.8% | 5.1% | 3.6% | 5.4% | 5.1% | 3.3% | 2.2% | 3.6% | 58.5% |
| Tiverton | 6.2% | 7.3% | 5.0% | 3.9% | 7.6% | 4.6% | 3.7% | 4.0% | 4.9% | 52.7% |
| Totnes | 7.1% | 10.7% | 6.5% | 2.9% | 6.2% | 3.7% | 2.7% | 1.6% | 3.4% | 55.2% |
| Plymouth | 4.1% | 7.6% | 5.9% | 4.3% | 5.9% | 5.2% | 4.2% | 3.4% | 5.1% | 54.3% |
| Torbay | 5.2% | 5.9% | 4.6% | 3.5% | 5.6% | 6.0% | 3.7% | 2.9% | 4.9% | 57.7% |
| One Devon | 5.5% | 7.9% | 5.4% | 4.0% | 6.2% | 4.9% | 3.7% | 3.0% | 4.7% | 54.8% |
| DCC Devon | 6.0% | 8.4% | 5.4% | 3.9% | 6.4% | 4.7% | 3.5% | 2.9% | 4.6% | 54.4% |
| South West | 6.0% | 9.0% | 6.0% | 4.4% | 5.7% | 4.7% | 3.5% | 3.0% | 4.7% | 52.8% |
| England | 6.0% | 9.5% | 6.2% | 4.3% | 4.7% | 4.3% | 3.5% | 3.2% | 4.9% | 53.3% |
Figure 7.5 b) Occupation Group by devon town
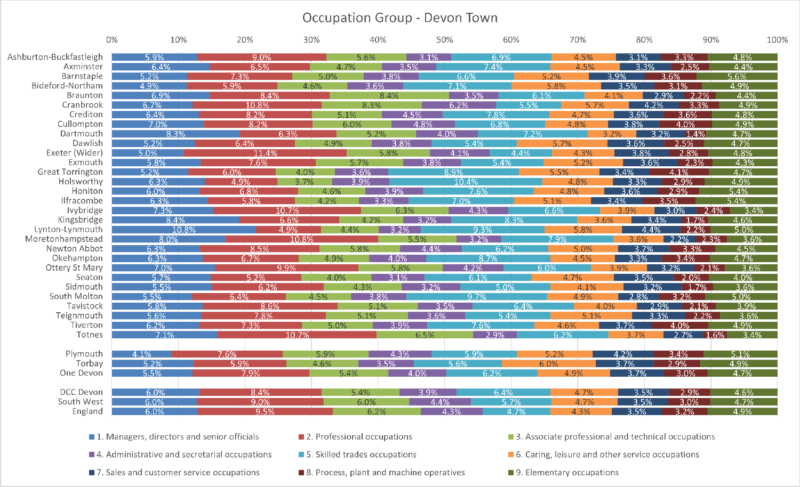
1 Managers etc are larger in Lynton & Lynmouth (10.8%), Kingsbridge (8.4%) and Dartmouth (8.3%). 2. Professionals Exeter (11.4%), Cranbrook (10.8%) and Moretonhampstead (10.8%). 3 Associate Professionals Braunton (8.4%) and Cranbrook (8.3%). 5 Skilled Trades Holsworthy (10.4%) and Tavistock (9.7%).
7.6 Socio-economic Classification
(ONS Table TS062)
Table 7.6 a) Socio-economic classification by district
| Area | L1, L2 and L3: Higher managerial, administrative and professional occupations | L4, L5 and L6: Lower managerial, administrative and professional occupations | L7: Intermediate occupations | L8 and L9: Small employers and own account workers | L10 and L11: Lower supervisory and technical occupations | L12: Semi-routine occupations | L13: Routine occupations | L14.1 and L14.2: Never worked and long-term unemployed | L15: Full-time students | Does not apply | Usual Residents |
| East Devon | 17,183 | 28,688 | 15,717 | 19,230 | 7,033 | 15,503 | 12,408 | 6,551 | 5,066 | 23,437 | 150,816 |
| Exeter | 13,772 | 20,305 | 11,940 | 8,853 | 4,929 | 11,326 | 12,140 | 5,738 | 22,326 | 19,375 | 130,704 |
| Mid Devon | 8,073 | 13,864 | 7,584 | 10,974 | 3,906 | 8,296 | 8,782 | 3,669 | 3,063 | 14,641 | 82,852 |
| North Devon | 7,940 | 16,292 | 8,844 | 13,685 | 5,239 | 11,501 | 10,082 | 5,090 | 3,511 | 16,419 | 98,603 |
| South Hams | 11,427 | 17,352 | 7,509 | 13,452 | 3,654 | 7,559 | 6,617 | 4,084 | 3,312 | 13,672 | 88,638 |
| Teignbridge | 14,270 | 24,990 | 13,301 | 16,317 | 6,670 | 14,448 | 12,366 | 6,396 | 4,713 | 21,342 | 134,813 |
| Torridge | 5,121 | 10,640 | 6,032 | 10,684 | 3,626 | 8,446 | 7,064 | 3,802 | 2,136 | 10,556 | 68,107 |
| West Devon | 6,283 | 10,302 | 4,991 | 8,757 | 2,595 | 5,460 | 5,181 | 2,758 | 2,046 | 8,736 | 57,109 |
| Plymouth | 19,049 | 40,217 | 26,856 | 18,817 | 13,741 | 29,548 | 30,784 | 17,676 | 21,925 | 46,077 | 264,690 |
| Torbay | 9,866 | 21,940 | 13,400 | 16,506 | 7,277 | 17,625 | 15,518 | 9,603 | 5,313 | 22,290 | 139,338 |
| One Devon | 112,984 | 204,590 | 116,174 | 137,275 | 58,670 | 129,712 | 120,942 | 65,367 | 73,411 | 196,545 | 1,215,670 |
| DCC Devon | 84,069 | 142,433 | 75,918 | 101,952 | 37,652 | 82,539 | 74,640 | 38,088 | 46,173 | 128,178 | 811,642 |
| South West | 612,503 | 988,678 | 553,309 | 582,005 | 267,533 | 574,019 | 547,264 | 285,136 | 325,393 | 965,346 | 5,701,186 |
| England | 6,092,791 | 9,172,371 | 5,255,333 | 4,873,405 | 2,460,733 | 5,183,578 | 5,522,275 | 3,915,482 | 3,530,990 | 10,483,091 | 56,490,049 |
| Area | L1, L2 and L3: Higher managerial, administrative and professional occupations | L4, L5 and L6: Lower managerial, administrative and professional occupations | L7: Intermediate occupations | L8 and L9: Small employers and own account workers | L10 and L11: Lower supervisory and technical occupations | L12: Semi-routine occupations | L13: Routine occupations | L14.1 and L14.2: Never worked and long-term unemployed | L15: Full-time students | Does not apply |
| East Devon | 11.4% | 19.0% | 10.4% | 12.8% | 4.7% | 10.3% | 8.2% | 4.3% | 3.4% | 15.5% |
| Exeter | 10.5% | 15.5% | 9.1% | 6.8% | 3.8% | 8.7% | 9.3% | 4.4% | 17.1% | 14.8% |
| Mid Devon | 9.7% | 16.7% | 9.2% | 13.2% | 4.7% | 10.0% | 10.6% | 4.4% | 3.7% | 17.7% |
| North Devon | 8.1% | 16.5% | 9.0% | 13.9% | 5.3% | 11.7% | 10.2% | 5.2% | 3.6% | 16.7% |
| South Hams | 12.9% | 19.6% | 8.5% | 15.2% | 4.1% | 8.5% | 7.5% | 4.6% | 3.7% | 15.4% |
| Teignbridge | 10.6% | 18.5% | 9.9% | 12.1% | 4.9% | 10.7% | 9.2% | 4.7% | 3.5% | 15.8% |
| Torridge | 7.5% | 15.6% | 8.9% | 15.7% | 5.3% | 12.4% | 10.4% | 5.6% | 3.1% | 15.5% |
| West Devon | 11.0% | 18.0% | 8.7% | 15.3% | 4.5% | 9.6% | 9.1% | 4.8% | 3.6% | 15.3% |
| Plymouth | 7.2% | 15.2% | 10.1% | 7.1% | 5.2% | 11.2% | 11.6% | 6.7% | 8.3% | 17.4% |
| Torbay | 7.1% | 15.7% | 9.6% | 11.8% | 5.2% | 12.6% | 11.1% | 6.9% | 3.8% | 16.0% |
| One Devon | 9.3% | 16.8% | 9.6% | 11.3% | 4.8% | 10.7% | 9.9% | 5.4% | 6.0% | 16.2% |
| DCC Devon | 10.4% | 17.5% | 9.4% | 12.6% | 4.6% | 10.2% | 9.2% | 4.7% | 5.7% | 15.8% |
| South West | 10.7% | 17.3% | 9.7% | 10.2% | 4.7% | 10.1% | 9.6% | 5.0% | 5.7% | 16.9% |
| England | 10.8% | 16.2% | 9.3% | 8.6% | 4.4% | 9.2% | 9.8% | 6.9% | 6.3% | 18.6% |
Figure 7.6 a) Socio-economic classification by district
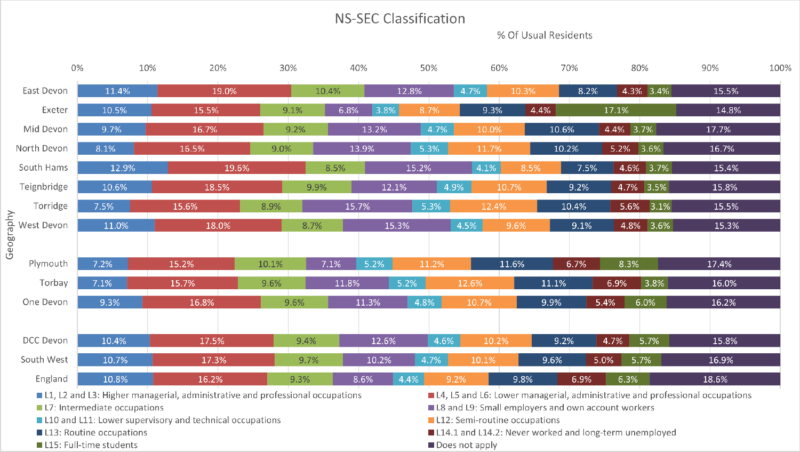
DCC Devon follows the trend of SW and England fairly closely but with more L8 & L9 Small employers. District variations include South Hams L1 to L3 (13%) and L4 to L6 (20%), Torridge L8 (16%), North Devon L12 (12%), Mid Devon L13 (11%) and Exeter L15 (17%).
Table 7.6 b) Socio-economic classification by devon town
| Area | L1, L2 and L3: Higher managerial, administrative and professional occupations | L4, L5 and L6: Lower managerial, administrative and professional occupations | L7: Intermediate occupations | L8 and L9: Small employers and own account workers | L10 and L11: Lower supervisory and technical occupations | L12: Semi-routine occupations | L13: Routine occupations | L14.1 and L14.2: Never worked and long-term unemployed | L15: Full-time students | Does not apply | Usual Residents |
| Ashburton-Buckfastleigh | 714 | 1,369 | 581 | 1,114 | 428 | 767 | 804 | 382 | 308 | 1,324 | 7,791 |
| Axminster | 1,752 | 2,810 | 1,485 | 2,621 | 758 | 1,720 | 1,347 | 817 | 500 | 2,424 | 16,234 |
| Barnstaple | 3,694 | 7,861 | 4,625 | 5,375 | 2,619 | 6,120 | 5,376 | 2,519 | 1,670 | 8,441 | 48,300 |
| Bideford-Northam | 2,964 | 6,288 | 3,538 | 5,256 | 2,187 | 5,113 | 4,089 | 2,299 | 1,235 | 6,051 | 39,020 |
| Braunton | 1,228 | 2,380 | 1,257 | 1,660 | 551 | 1,184 | 964 | 502 | 514 | 2,184 | 12,424 |
| Cranbrook | 787 | 1,449 | 840 | 598 | 340 | 585 | 582 | 190 | 292 | 2,150 | 7,813 |
| Crediton | 2,257 | 3,739 | 2,063 | 3,253 | 934 | 2,199 | 2,122 | 940 | 805 | 3,762 | 22,074 |
| Cullompton | 2,571 | 4,433 | 2,394 | 3,094 | 1,204 | 2,405 | 2,686 | 1,040 | 915 | 4,732 | 25,474 |
| Dartmouth | 1,392 | 2,046 | 854 | 1,894 | 436 | 932 | 884 | 536 | 339 | 1,271 | 10,584 |
| Dawlish | 1,528 | 3,007 | 1,783 | 1,890 | 876 | 2,029 | 1,706 | 944 | 528 | 2,346 | 16,637 |
| Exeter (Wider) | 17,018 | 24,929 | 14,350 | 11,786 | 5,921 | 13,092 | 13,743 | 6,612 | 23,202 | 23,488 | 154,141 |
| Exmouth | 5,477 | 9,560 | 5,346 | 5,521 | 2,361 | 5,426 | 4,256 | 2,290 | 1,701 | 7,245 | 49,183 |
| Great Torrington | 828 | 1,773 | 932 | 1,704 | 573 | 1,338 | 1,235 | 534 | 322 | 1,675 | 10,914 |
| Holsworthy | 1,318 | 2,549 | 1,478 | 3,575 | 837 | 1,944 | 1,604 | 939 | 545 | 2,661 | 17,450 |
| Honiton | 1,764 | 3,265 | 1,906 | 2,754 | 977 | 2,160 | 1,881 | 904 | 596 | 2,859 | 19,066 |
| Ilfracombe | 1,202 | 2,650 | 1,294 | 2,639 | 1,004 | 2,039 | 1,866 | 1,042 | 636 | 2,655 | 17,027 |
| Ivybridge | 4,897 | 7,475 | 3,557 | 4,461 | 1,635 | 3,022 | 2,718 | 1,587 | 1,398 | 6,208 | 36,958 |
| Kingsbridge | 2,013 | 3,095 | 1,336 | 3,454 | 761 | 1,709 | 1,364 | 844 | 624 | 2,648 | 17,848 |
| Lynton-Lynmouth | 153 | 245 | 112 | 439 | 76 | 179 | 136 | 85 | 29 | 155 | 1,609 |
| Moretonhampstead | 640 | 838 | 341 | 853 | 159 | 296 | 268 | 164 | 142 | 630 | 4,331 |
| Newton Abbot | 7,775 | 13,755 | 7,470 | 8,672 | 3,862 | 8,273 | 7,220 | 3,497 | 2,704 | 12,519 | 75,747 |
| Okehampton | 2,706 | 4,656 | 2,397 | 4,885 | 1,287 | 2,724 | 2,855 | 1,309 | 968 | 4,554 | 28,341 |
| Ottery St Mary | 2,121 | 3,108 | 1,581 | 1,942 | 630 | 1,297 | 1,079 | 573 | 610 | 2,763 | 15,704 |
| Seaton | 1,292 | 2,354 | 1,331 | 1,941 | 718 | 1,603 | 1,140 | 636 | 302 | 1,444 | 12,761 |
| Sidmouth | 2,112 | 3,568 | 1,858 | 2,197 | 712 | 1,773 | 1,199 | 674 | 542 | 2,037 | 16,672 |
| South Molton | 1,252 | 2,427 | 1,204 | 2,778 | 816 | 1,599 | 1,436 | 726 | 553 | 2,427 | 15,218 |
| Tavistock | 3,785 | 5,996 | 2,806 | 4,294 | 1,402 | 2,920 | 2,545 | 1,550 | 1,143 | 4,517 | 30,958 |
| Teignmouth | 2,016 | 3,674 | 1,965 | 2,279 | 846 | 2,164 | 1,615 | 953 | 617 | 2,673 | 18,802 |
| Tiverton | 3,688 | 6,398 | 3,472 | 5,380 | 1,920 | 4,031 | 4,269 | 1,883 | 1,482 | 6,790 | 39,313 |
| Totnes | 3,125 | 4,736 | 1,762 | 3,643 | 822 | 1,896 | 1,651 | 1,117 | 951 | 3,545 | 23,248 |
| Plymouth | 19,049 | 40,217 | 26,856 | 18,817 | 13,741 | 29,548 | 30,784 | 17,676 | 21,925 | 46,077 | 264,690 |
| Torbay | 9,866 | 21,940 | 13,400 | 16,506 | 7,277 | 17,625 | 15,518 | 9,603 | 5,313 | 22,290 | 139,338 |
| One Devon | 112,984 | 204,590 | 116,174 | 137,275 | 58,670 | 129,712 | 120,942 | 65,367 | 73,411 | 196,545 | 1,215,670 |
| DCC Devon | 84,069 | 142,433 | 75,918 | 101,952 | 37,652 | 82,539 | 74,640 | 38,088 | 46,173 | 128,178 | 811,642 |
| South West | 612,503 | 988,678 | 553,309 | 582,005 | 267,533 | 574,019 | 547,264 | 285,136 | 325,393 | 965,346 | 5,701,186 |
| England | 6,092,791 | 9,172,371 | 5,255,333 | 4,873,405 | 2,460,733 | 5,183,578 | 5,522,275 | 3,915,482 | 3,530,990 | 10,483,091 | 56,490,049 |
| Area | L1, L2 and L3: Higher managerial, administrative and professional occupations | L4, L5 and L6: Lower managerial, administrative and professional occupations | L7: Intermediate occupations | L8 and L9: Small employers and own account workers | L10 and L11: Lower supervisory and technical occupations | L12: Semi-routine occupations | L13: Routine occupations | L14.1 and L14.2: Never worked and long-term unemployed | L15: Full-time students | Does not apply |
| Ashburton-Buckfastleigh | 9.2% | 17.6% | 7.5% | 14.3% | 5.5% | 9.8% | 10.3% | 4.9% | 4.0% | 17.0% |
| Axminster | 10.8% | 17.3% | 9.1% | 16.1% | 4.7% | 10.6% | 8.3% | 5.0% | 3.1% | 14.9% |
| Barnstaple | 7.6% | 16.3% | 9.6% | 11.1% | 5.4% | 12.7% | 11.1% | 5.2% | 3.5% | 17.5% |
| Bideford-Northam | 7.6% | 16.1% | 9.1% | 13.5% | 5.6% | 13.1% | 10.5% | 5.9% | 3.2% | 15.5% |
| Braunton | 9.9% | 19.2% | 10.1% | 13.4% | 4.4% | 9.5% | 7.8% | 4.0% | 4.1% | 17.6% |
| Cranbrook | 10.1% | 18.5% | 10.8% | 7.7% | 4.4% | 7.5% | 7.4% | 2.4% | 3.7% | 27.5% |
| Crediton | 10.2% | 16.9% | 9.3% | 14.7% | 4.2% | 10.0% | 9.6% | 4.3% | 3.6% | 17.0% |
| Cullompton | 10.1% | 17.4% | 9.4% | 12.1% | 4.7% | 9.4% | 10.5% | 4.1% | 3.6% | 18.6% |
| Dartmouth | 13.2% | 19.3% | 8.1% | 17.9% | 4.1% | 8.8% | 8.4% | 5.1% | 3.2% | 12.0% |
| Dawlish | 9.2% | 18.1% | 10.7% | 11.4% | 5.3% | 12.2% | 10.3% | 5.7% | 3.2% | 14.1% |
| Exeter (Wider) | 11.0% | 16.2% | 9.3% | 7.6% | 3.8% | 8.5% | 8.9% | 4.3% | 15.1% | 15.2% |
| Exmouth | 11.1% | 19.4% | 10.9% | 11.2% | 4.8% | 11.0% | 8.7% | 4.7% | 3.5% | 14.7% |
| Great Torrington | 7.6% | 16.2% | 8.5% | 15.6% | 5.3% | 12.3% | 11.3% | 4.9% | 3.0% | 15.3% |
| Holsworthy | 7.6% | 14.6% | 8.5% | 20.5% | 4.8% | 11.1% | 9.2% | 5.4% | 3.1% | 15.2% |
| Honiton | 9.3% | 17.1% | 10.0% | 14.4% | 5.1% | 11.3% | 9.9% | 4.7% | 3.1% | 15.0% |
| Ilfracombe | 7.1% | 15.6% | 7.6% | 15.5% | 5.9% | 12.0% | 11.0% | 6.1% | 3.7% | 15.6% |
| Ivybridge | 13.3% | 20.2% | 9.6% | 12.1% | 4.4% | 8.2% | 7.4% | 4.3% | 3.8% | 16.8% |
| Kingsbridge | 11.3% | 17.3% | 7.5% | 19.4% | 4.3% | 9.6% | 7.6% | 4.7% | 3.5% | 14.8% |
| Lynton-Lynmouth | 9.5% | 15.2% | 7.0% | 27.3% | 4.7% | 11.1% | 8.5% | 5.3% | 1.8% | 9.6% |
| Moretonhampstead | 14.8% | 19.3% | 7.9% | 19.7% | 3.7% | 6.8% | 6.2% | 3.8% | 3.3% | 14.5% |
| Newton Abbot | 10.3% | 18.2% | 9.9% | 11.4% | 5.1% | 10.9% | 9.5% | 4.6% | 3.6% | 16.5% |
| Okehampton | 9.5% | 16.4% | 8.5% | 17.2% | 4.5% | 9.6% | 10.1% | 4.6% | 3.4% | 16.1% |
| Ottery St Mary | 13.5% | 19.8% | 10.1% | 12.4% | 4.0% | 8.3% | 6.9% | 3.6% | 3.9% | 17.6% |
| Seaton | 10.1% | 18.4% | 10.4% | 15.2% | 5.6% | 12.6% | 8.9% | 5.0% | 2.4% | 11.3% |
| Sidmouth | 12.7% | 21.4% | 11.1% | 13.2% | 4.3% | 10.6% | 7.2% | 4.0% | 3.3% | 12.2% |
| South Molton | 8.2% | 15.9% | 7.9% | 18.3% | 5.4% | 10.5% | 9.4% | 4.8% | 3.6% | 15.9% |
| Tavistock | 12.2% | 19.4% | 9.1% | 13.9% | 4.5% | 9.4% | 8.2% | 5.0% | 3.7% | 14.6% |
| Teignmouth | 10.7% | 19.5% | 10.5% | 12.1% | 4.5% | 11.5% | 8.6% | 5.1% | 3.3% | 14.2% |
| Tiverton | 9.4% | 16.3% | 8.8% | 13.7% | 4.9% | 10.3% | 10.9% | 4.8% | 3.8% | 17.3% |
| Totnes | 13.4% | 20.4% | 7.6% | 15.7% | 3.5% | 8.2% | 7.1% | 4.8% | 4.1% | 15.2% |
| Plymouth | 7.2% | 15.2% | 10.1% | 7.1% | 5.2% | 11.2% | 11.6% | 6.7% | 8.3% | 17.4% |
| Torbay | 7.1% | 15.7% | 9.6% | 11.8% | 5.2% | 12.6% | 11.1% | 6.9% | 3.8% | 16.0% |
| One Devon | 9.3% | 16.8% | 9.6% | 11.3% | 4.8% | 10.7% | 9.9% | 5.4% | 6.0% | 16.2% |
| DCC Devon | 10.4% | 17.5% | 9.4% | 12.6% | 4.6% | 10.2% | 9.2% | 4.7% | 5.7% | 15.8% |
| South West | 10.7% | 17.3% | 9.7% | 10.2% | 4.7% | 10.1% | 9.6% | 5.0% | 5.7% | 16.9% |
| England | 10.8% | 16.2% | 9.3% | 8.6% | 4.4% | 9.2% | 9.8% | 6.9% | 6.3% | 18.6% |
Some figures significantly greater than the DCC Devon include L1-L3 Moretonhampstead (15%), Ottery St Mary (13%) and Totnes (13%). L4-L6 Totnes (20%), Ivybridge (20%) and Ottery St Mary (20%). L7 Sidmouth (11%), Cranbrook (11%) and Dawlish (11%). L8-L9 Lynton/Lynmouth (27%), Holsworthy (21%) and Moretonhampstead (20%). L12 Bideford/Northam (13%) and Barnstaple (13%). L15 Exeter (Wider) 15%.
Figure 7.6 b) Socio-economic classification by devon town
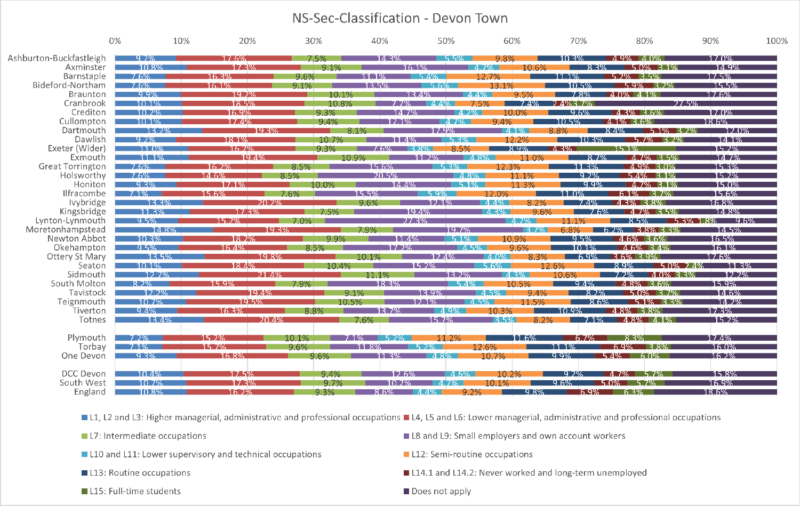
Moretonhampstead has 15% in the Higher Managerial Classification. Sidmouth has 21% in the Lower Managerial Class. Lynton/Lynmouth has 27% in Small Employers Class. Exeter has 15% full-time Students.
Map 7.6 c) Socio-economic classification by output area – Never Worked & Long-term Unemployed
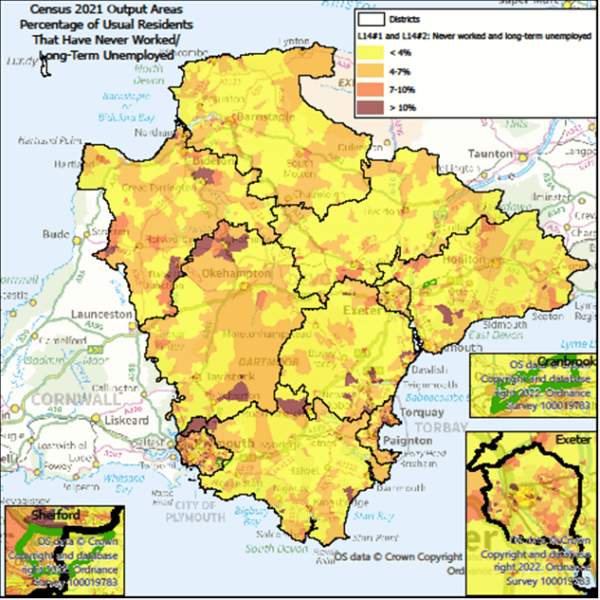
L14-1 & L14-2 Have a few in Exeter, Plymouth & Torbay. Teignbridge has some in the Newton Abbot area. South Hams have Bickleigh and Holne. West Devon have Princetown and the Hatherleigh area. Torridge have Halwell and Torrington.
Map 7.6 d) Socio-economic classification by output area – Full-time Students
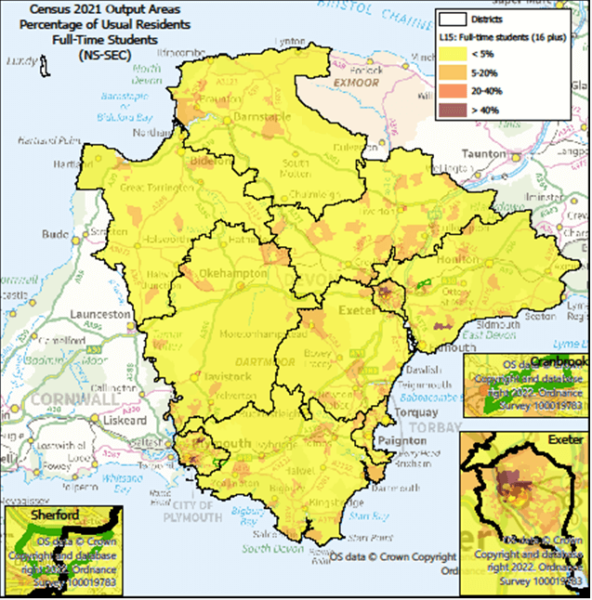
Not surprisingly the L15 Full-Time Students are in Exeter & Plymouth near the universities. The one in East Devon is near Bicton College.
7.7 Method of travel to work
(ONS Table TS061)
Table 7.7 a) Method to Travel to Work by district
| Area | Bicycle | Bus, minibus or coach | Driving a car or van | Motorcycle, scooter or moped | On foot | Other method of travel to work | Passenger in a car or van | Taxi | Train | Underground, metro, light rail, tram | Work mainly at or from home | Not in employment or aged 15 years and under | Usual Residents |
| East Devon | 1,177 | 1,159 | 34,839 | 441 | 5,856 | 671 | 2,149 | 113 | 540 | 26 | 19,757 | 84,101 | 150,829 |
| Exeter | 2,821 | 2,838 | 22,190 | 472 | 9,603 | 543 | 2,176 | 208 | 528 | 35 | 18,285 | 71,009 | 130,708 |
| Mid Devon | 476 | 579 | 21,306 | 194 | 3,605 | 388 | 1,558 | 64 | 139 | 10 | 11,963 | 42,570 | 82,852 |
| North Devon | 1,098 | 977 | 23,589 | 268 | 5,834 | 427 | 1,807 | 119 | 71 | 16 | 10,957 | 53,448 | 98,611 |
| South Hams | 412 | 491 | 20,416 | 299 | 3,601 | 510 | 1,183 | 59 | 137 | 28 | 13,451 | 48,043 | 88,630 |
| Teignbridge | 779 | 1,059 | 33,785 | 432 | 5,013 | 590 | 2,228 | 121 | 612 | 22 | 17,497 | 72,666 | 134,804 |
| Torridge | 217 | 604 | 16,989 | 152 | 2,746 | 273 | 1,174 | 68 | 45 | 7 | 7,776 | 38,061 | 68,112 |
| West Devon | 235 | 284 | 13,172 | 126 | 2,353 | 307 | 829 | 38 | 56 | 11 | 7,973 | 31,712 | 57,096 |
| Plymouth | 2,554 | 7,672 | 61,976 | 1,582 | 12,221 | 1,520 | 6,220 | 1,201 | 371 | 44 | 25,656 | 143,677 | 264,694 |
| Torbay | 702 | 1,971 | 31,532 | 580 | 7,442 | 746 | 3,068 | 379 | 340 | 20 | 12,155 | 80,389 | 139,324 |
| One Devon | 10,471 | 17,634 | 279,794 | 4,546 | 58,274 | 5,975 | 22,392 | 2,370 | 2,839 | 219 | 145,470 | 665,676 | 1,215,660 |
| DCC Devon | 7,215 | 7,991 | 186,286 | 2,384 | 38,611 | 3,709 | 13,104 | 790 | 2,128 | 155 | 107,659 | 441,610 | 811,642 |
| South West | 63,427 | 75,929 | 1,319,538 | 17,194 | 248,004 | 25,871 | 100,997 | 8,257 | 13,321 | 1,265 | 818,531 | 3,008,852 | 5,701,186 |
| England | 554,210 | 1,129,537 | 11,751,946 | 124,207 | 2,016,982 | 274,170 | 1,017,401 | 192,884 | 517,901 | 504,716 | 8,321,252 | 30,084,833 | 56,490,039 |
| Area | Bicycle | Bus, minibus or coach | Driving a car or van | Motorcycle, scooter or moped | On foot | Other method of travel to work | Passenger in a car or van | Taxi | Train | Underground, metro, light rail, tram | Work mainly at or from home | Not in employment or aged 15 years and under |
| East Devon | 0.8% | 0.8% | 23.1% | 0.3% | 3.9% | 0.4% | 1.4% | 0.1% | 0.4% | 0.0% | 13.1% | 55.8% |
| Exeter | 2.2% | 2.2% | 17.0% | 0.4% | 7.3% | 0.4% | 1.7% | 0.2% | 0.4% | 0.0% | 14.0% | 54.3% |
| Mid Devon | 0.6% | 0.7% | 25.7% | 0.2% | 4.4% | 0.5% | 1.9% | 0.1% | 0.2% | 0.0% | 14.4% | 51.4% |
| North Devon | 1.1% | 1.0% | 23.9% | 0.3% | 5.9% | 0.4% | 1.8% | 0.1% | 0.1% | 0.0% | 11.1% | 54.2% |
| South Hams | 0.5% | 0.6% | 23.0% | 0.3% | 4.1% | 0.6% | 1.3% | 0.1% | 0.2% | 0.0% | 15.2% | 54.2% |
| Teignbridge | 0.6% | 0.8% | 25.1% | 0.3% | 3.7% | 0.4% | 1.7% | 0.1% | 0.5% | 0.0% | 13.0% | 53.9% |
| Torridge | 0.3% | 0.9% | 24.9% | 0.2% | 4.0% | 0.4% | 1.7% | 0.1% | 0.1% | 0.0% | 11.4% | 55.9% |
| West Devon | 0.4% | 0.5% | 23.1% | 0.2% | 4.1% | 0.5% | 1.5% | 0.1% | 0.1% | 0.0% | 14.0% | 55.5% |
| Plymouth | 1.0% | 2.9% | 23.4% | 0.6% | 4.6% | 0.6% | 2.3% | 0.5% | 0.1% | 0.0% | 9.7% | 54.3% |
| Torbay | 0.5% | 1.4% | 22.6% | 0.4% | 5.3% | 0.5% | 2.2% | 0.3% | 0.2% | 0.0% | 8.7% | 57.7% |
| One Devon | 0.9% | 1.5% | 23.0% | 0.4% | 4.8% | 0.5% | 1.8% | 0.2% | 0.2% | 0.0% | 12.0% | 54.8% |
| DCC Devon | 0.9% | 1.0% | 23.0% | 0.3% | 4.8% | 0.5% | 1.6% | 0.1% | 0.3% | 0.0% | 13.3% | 54.4% |
| South West | 1.1% | 1.3% | 23.1% | 0.3% | 4.4% | 0.5% | 1.8% | 0.1% | 0.2% | 0.0% | 14.4% | 52.8% |
| England | 1.0% | 2.0% | 20.8% | 0.2% | 3.6% | 0.5% | 1.8% | 0.3% | 0.9% | 0.9% | 14.7% | 53.3% |
Figure 7.7 a) Method to Travel to Work by district
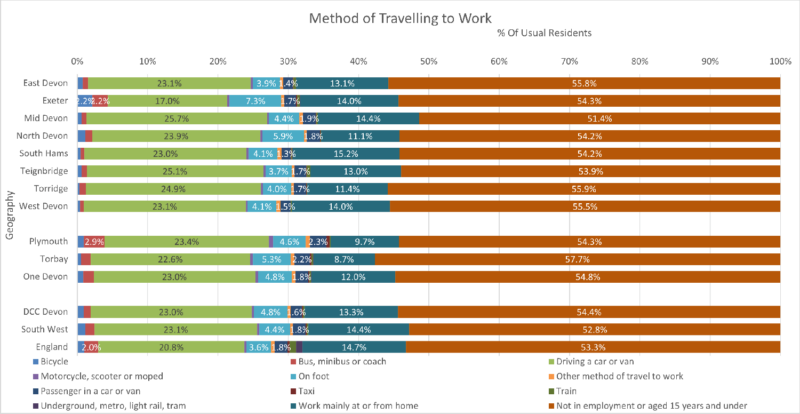
DCC Devon roughly compares with the England figures – driving a car or van is greater. Exeter has more people cycling, public transport and walking than all the other districts. Car/Van usage is highest in Mid Devon (26%), Teignbridge (25%) and Torridge (25%).
Table 7.7 b) Method to Travel to Work by devon town
| Area | Bicycle | Bus, minibus or coach | Driving a car or van | Motorcycle, scooter or moped | On foot | Other method of travel to work | Passenger in a car or van | Taxi | Train | Underground, metro, light rail, tram | Work mainly at or from home | Not in employment or aged 15 years and under | Usual Residents |
| Ashburton-Buckfastleigh | 50 | 35 | 1,879 | 24 | 334 | 48 | 122 | 2 | 9 | 1 | 1,101 | 4,189 | 7,794 |
| Axminster | 62 | 53 | 3,925 | 28 | 527 | 79 | 221 | 10 | 46 | 2 | 2,096 | 9,190 | 16,239 |
| Barnstaple | 716 | 606 | 12,027 | 158 | 2,978 | 184 | 1,001 | 66 | 39 | 5 | 4,552 | 25,986 | 48,318 |
| Bideford-Northam | 161 | 455 | 9,596 | 102 | 1,670 | 155 | 760 | 57 | 28 | 4 | 3,909 | 22,123 | 39,020 |
| Braunton | 268 | 117 | 2,966 | 30 | 625 | 60 | 183 | – | 6 | 4 | 1,572 | 6,599 | 12,430 |
| Cranbrook | 68 | 159 | 2,488 | 38 | 131 | 37 | 118 | 3 | 30 | 1 | 1,273 | 3,466 | 7,812 |
| Crediton | 91 | 180 | 5,553 | 56 | 940 | 105 | 350 | 10 | 57 | 6 | 3,366 | 11,354 | 22,068 |
| Cullompton | 132 | 185 | 7,052 | 63 | 872 | 99 | 476 | 18 | 34 | 3 | 3,891 | 12,647 | 25,472 |
| Dartmouth | 39 | 65 | 1,946 | 42 | 684 | 77 | 151 | 10 | 17 | 5 | 1,570 | 5,979 | 10,585 |
| Dawlish | 80 | 190 | 3,654 | 56 | 744 | 76 | 265 | 15 | 176 | 6 | 1,761 | 9,616 | 16,639 |
| Exeter (Wider) | 3,098 | 3,081 | 28,185 | 565 | 10,038 | 635 | 2,500 | 215 | 576 | 42 | 22,504 | 82,698 | 154,137 |
| Exmouth | 539 | 498 | 10,777 | 150 | 2,406 | 241 | 752 | 53 | 265 | 11 | 5,818 | 27,674 | 49,184 |
| Great Torrington | 40 | 88 | 2,851 | 15 | 537 | 28 | 155 | 2 | 7 | 2 | 1,225 | 5,962 | 10,912 |
| Holsworthy | 22 | 54 | 4,377 | 37 | 526 | 85 | 235 | 10 | 7 | 1 | 2,519 | 9,581 | 17,454 |
| Honiton | 72 | 80 | 4,690 | 44 | 813 | 88 | 298 | 19 | 87 | 3 | 2,499 | 10,369 | 19,062 |
| Ilfracombe | 60 | 165 | 3,750 | 50 | 1,304 | 79 | 313 | 41 | 8 | 3 | 1,732 | 9,526 | 17,031 |
| Ivybridge | 175 | 234 | 9,836 | 137 | 1,024 | 204 | 504 | 29 | 35 | 9 | 5,539 | 19,227 | 36,953 |
| Kingsbridge | 55 | 62 | 3,954 | 54 | 945 | 118 | 243 | 8 | 8 | 3 | 2,399 | 10,004 | 17,853 |
| Lynton-Lynmouth | 4 | 7 | 299 | 3 | 130 | 16 | 22 | – | 1 | – | 318 | 803 | 1,603 |
| Moretonhampstead | 10 | 11 | 913 | 10 | 151 | 21 | 48 | 3 | 7 | – | 867 | 2,289 | 4,330 |
| Newton Abbot | 439 | 540 | 20,579 | 260 | 2,733 | 338 | 1,349 | 80 | 249 | 11 | 9,549 | 39,621 | 75,748 |
| Okehampton | 97 | 117 | 6,798 | 60 | 1,298 | 135 | 438 | 28 | 16 | 5 | 4,208 | 15,136 | 28,336 |
| Ottery St Mary | 98 | 62 | 3,692 | 46 | 410 | 69 | 193 | 6 | 51 | 3 | 2,542 | 8,535 | 15,707 |
| Seaton | 81 | 50 | 2,629 | 29 | 611 | 48 | 167 | 9 | 17 | 1 | 1,239 | 7,875 | 12,756 |
| Sidmouth | 112 | 115 | 3,020 | 40 | 711 | 63 | 233 | 6 | 24 | 4 | 1,816 | 10,528 | 16,672 |
| South Molton | 41 | 59 | 3,652 | 28 | 672 | 72 | 242 | 8 | 15 | 3 | 2,139 | 8,275 | 15,206 |
| Tavistock | 144 | 175 | 6,868 | 66 | 1,103 | 176 | 433 | 14 | 39 | 6 | 4,119 | 17,808 | 30,951 |
| Teignmouth | 57 | 169 | 4,039 | 39 | 827 | 64 | 277 | 20 | 149 | 3 | 2,162 | 10,998 | 18,804 |
| Tiverton | 258 | 231 | 9,629 | 83 | 1,903 | 194 | 777 | 37 | 54 | 6 | 5,421 | 20,730 | 39,323 |
| Totnes | 142 | 136 | 4,675 | 69 | 949 | 115 | 283 | 14 | 78 | 8 | 3,946 | 12,830 | 23,245 |
| Plymouth | 2,554 | 7,672 | 61,976 | 1,582 | 12,221 | 1,520 | 6,220 | 1,201 | 371 | 44 | 25,656 | 143,677 | 264,694 |
| Torbay | 702 | 1,971 | 31,532 | 580 | 7,442 | 746 | 3,068 | 379 | 340 | 20 | 12,155 | 80,389 | 139,324 |
| One Devon | 10,471 | 17,634 | 279,794 | 4,546 | 58,274 | 5,975 | 22,392 | 2,370 | 2,839 | 219 | 145,470 | 665,676 | 1,215,660 |
| DCC Devon | 7,215 | 7,991 | 186,286 | 2,384 | 38,611 | 3,709 | 13,104 | 790 | 2,128 | 155 | 107,659 | 441,610 | 811,642 |
| South West | 63,427 | 75,929 | 1,319,538 | 17,194 | 248,004 | 25,871 | 100,997 | 8,257 | 13,321 | 1,265 | 818,531 | 3,008,852 | 5,701,186 |
| England | 554,210 | 1,129,537 | 11,751,946 | 124,207 | 2,016,982 | 274,170 | 1,017,401 | 192,884 | 517,901 | 504,716 | 8,321,252 | 30,084,833 | 56,490,039 |
| Area | Bicycle | Bus, minibus or coach | Driving a car or van | Motorcycle, scooter or moped | On foot | Other method of travel to work | Passenger in a car or van | Taxi | Train | Underground, metro, light rail, tram | Work mainly at or from home | Not in employment or aged 15 years and under |
| Ashburton-Buckfastleigh | 0.6% | 0.4% | 24.1% | 0.3% | 4.3% | 0.6% | 1.6% | 0.0% | 0.1% | 0.0% | 14.1% | 53.7% |
| Axminster | 0.4% | 0.3% | 24.2% | 0.2% | 3.2% | 0.5% | 1.4% | 0.1% | 0.3% | 0.0% | 12.9% | 56.6% |
| Barnstaple | 1.5% | 1.3% | 24.9% | 0.3% | 6.2% | 0.4% | 2.1% | 0.1% | 0.1% | 0.0% | 9.4% | 53.8% |
| Bideford-Northam | 0.4% | 1.2% | 24.6% | 0.3% | 4.3% | 0.4% | 1.9% | 0.1% | 0.1% | 0.0% | 10.0% | 56.7% |
| Braunton | 2.2% | 0.9% | 23.9% | 0.2% | 5.0% | 0.5% | 1.5% | 0.0% | 0.0% | 0.0% | 12.6% | 53.1% |
| Cranbrook | 0.9% | 2.0% | 31.8% | 0.5% | 1.7% | 0.5% | 1.5% | 0.0% | 0.4% | 0.0% | 16.3% | 44.4% |
| Crediton | 0.4% | 0.8% | 25.2% | 0.3% | 4.3% | 0.5% | 1.6% | 0.0% | 0.3% | 0.0% | 15.3% | 51.5% |
| Cullompton | 0.5% | 0.7% | 27.7% | 0.2% | 3.4% | 0.4% | 1.9% | 0.1% | 0.1% | 0.0% | 15.3% | 49.7% |
| Dartmouth | 0.4% | 0.6% | 18.4% | 0.4% | 6.5% | 0.7% | 1.4% | 0.1% | 0.2% | 0.0% | 14.8% | 56.5% |
| Dawlish | 0.5% | 1.1% | 22.0% | 0.3% | 4.5% | 0.5% | 1.6% | 0.1% | 1.1% | 0.0% | 10.6% | 57.8% |
| Exeter (Wider) | 2.0% | 2.0% | 18.3% | 0.4% | 6.5% | 0.4% | 1.6% | 0.1% | 0.4% | 0.0% | 14.6% | 53.7% |
| Exmouth | 1.1% | 1.0% | 21.9% | 0.3% | 4.9% | 0.5% | 1.5% | 0.1% | 0.5% | 0.0% | 11.8% | 56.3% |
| Great Torrington | 0.4% | 0.8% | 26.1% | 0.1% | 4.9% | 0.3% | 1.4% | 0.0% | 0.1% | 0.0% | 11.2% | 54.6% |
| Holsworthy | 0.1% | 0.3% | 25.1% | 0.2% | 3.0% | 0.5% | 1.3% | 0.1% | 0.0% | 0.0% | 14.4% | 54.9% |
| Honiton | 0.4% | 0.4% | 24.6% | 0.2% | 4.3% | 0.5% | 1.6% | 0.1% | 0.5% | 0.0% | 13.1% | 54.4% |
| Ilfracombe | 0.4% | 1.0% | 22.0% | 0.3% | 7.7% | 0.5% | 1.8% | 0.2% | 0.0% | 0.0% | 10.2% | 55.9% |
| Ivybridge | 0.5% | 0.6% | 26.6% | 0.4% | 2.8% | 0.6% | 1.4% | 0.1% | 0.1% | 0.0% | 15.0% | 52.0% |
| Kingsbridge | 0.3% | 0.3% | 22.1% | 0.3% | 5.3% | 0.7% | 1.4% | 0.0% | 0.0% | 0.0% | 13.4% | 56.0% |
| Lynton-Lynmouth | 0.2% | 0.4% | 18.7% | 0.2% | 8.1% | 1.0% | 1.4% | 0.0% | 0.1% | 0.0% | 19.8% | 50.1% |
| Moretonhampstead | 0.2% | 0.3% | 21.1% | 0.2% | 3.5% | 0.5% | 1.1% | 0.1% | 0.2% | 0.0% | 20.0% | 52.9% |
| Newton Abbot | 0.6% | 0.7% | 27.2% | 0.3% | 3.6% | 0.4% | 1.8% | 0.1% | 0.3% | 0.0% | 12.6% | 52.3% |
| Okehampton | 0.3% | 0.4% | 24.0% | 0.2% | 4.6% | 0.5% | 1.5% | 0.1% | 0.1% | 0.0% | 14.9% | 53.4% |
| Ottery St Mary | 0.6% | 0.4% | 23.5% | 0.3% | 2.6% | 0.4% | 1.2% | 0.0% | 0.3% | 0.0% | 16.2% | 54.3% |
| Seaton | 0.6% | 0.4% | 20.6% | 0.2% | 4.8% | 0.4% | 1.3% | 0.1% | 0.1% | 0.0% | 9.7% | 61.7% |
| Sidmouth | 0.7% | 0.7% | 18.1% | 0.2% | 4.3% | 0.4% | 1.4% | 0.0% | 0.1% | 0.0% | 10.9% | 63.1% |
| South Molton | 0.3% | 0.4% | 24.0% | 0.2% | 4.4% | 0.5% | 1.6% | 0.1% | 0.1% | 0.0% | 14.1% | 54.4% |
| Tavistock | 0.5% | 0.6% | 22.2% | 0.2% | 3.6% | 0.6% | 1.4% | 0.0% | 0.1% | 0.0% | 13.3% | 57.5% |
| Teignmouth | 0.3% | 0.9% | 21.5% | 0.2% | 4.4% | 0.3% | 1.5% | 0.1% | 0.8% | 0.0% | 11.5% | 58.5% |
| Tiverton | 0.7% | 0.6% | 24.5% | 0.2% | 4.8% | 0.5% | 2.0% | 0.1% | 0.1% | 0.0% | 13.8% | 52.7% |
| Totnes | 0.6% | 0.6% | 20.1% | 0.3% | 4.1% | 0.5% | 1.2% | 0.1% | 0.3% | 0.0% | 17.0% | 55.2% |
| Plymouth | 1.0% | 2.9% | 23.4% | 0.6% | 4.6% | 0.6% | 2.3% | 0.5% | 0.1% | 0.0% | 9.7% | 54.3% |
| Torbay | 0.5% | 1.4% | 22.6% | 0.4% | 5.3% | 0.5% | 2.2% | 0.3% | 0.2% | 0.0% | 8.7% | 57.7% |
| One Devon | 0.9% | 1.5% | 23.0% | 0.4% | 4.8% | 0.5% | 1.8% | 0.2% | 0.2% | 0.0% | 12.0% | 54.8% |
| DCC Devon | 0.9% | 1.0% | 23.0% | 0.3% | 4.8% | 0.5% | 1.6% | 0.1% | 0.3% | 0.0% | 13.3% | 54.4% |
| South West | 1.1% | 1.3% | 23.1% | 0.3% | 4.4% | 0.5% | 1.8% | 0.1% | 0.2% | 0.0% | 14.4% | 52.8% |
| England | 1.0% | 2.0% | 20.8% | 0.2% | 3.6% | 0.5% | 1.8% | 0.3% | 0.9% | 0.9% | 14.7% | 53.3% |
Figure 7.7 b) Method to Travel to Work by devon town
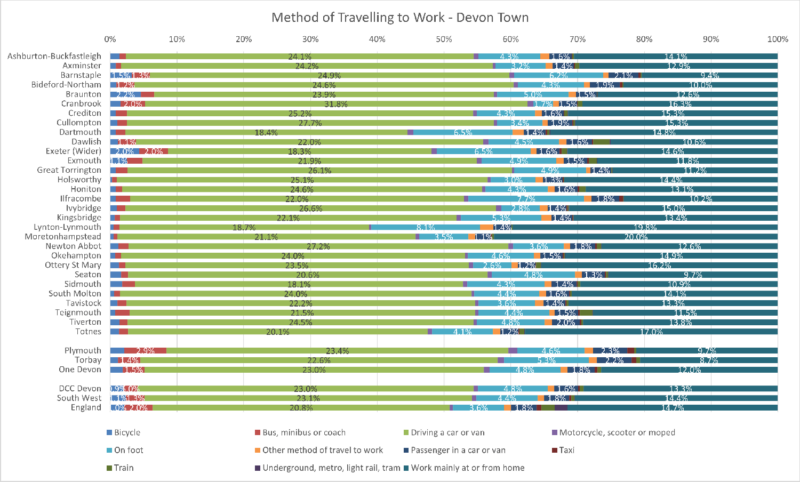
Public Transport is popular in Plymouth, Exeter (Wider) and Cranbrook. Cycling features in Braunton, Barnstaple and Exeter (Wider). Car/Van usage Cranbrook (32%, Cullompton (28%), Newton Abbot (27%) and Ivybridge (27%). On Foot Lynton/Lynmouth (8%) and Ilfracombe (8%). Working at Home Moretonhampstead (20%), Lynton/Lynmouth (20%) and Totnes (17%).
Map 7.7 c) Method to Travel to Work by output area – Mainly Working at Home
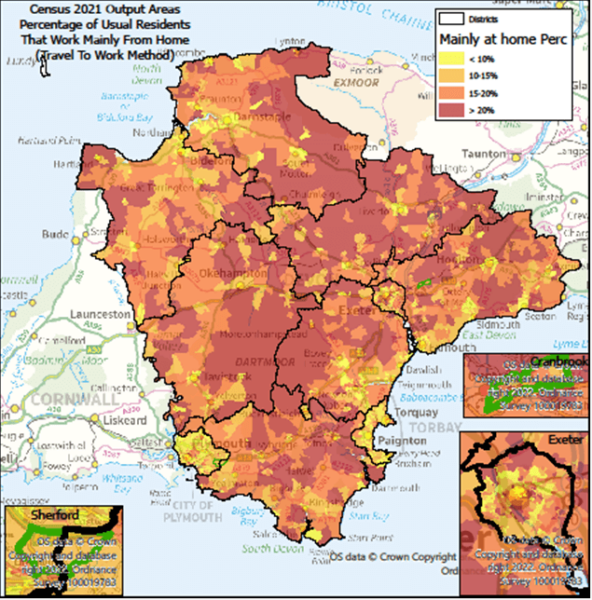
Working from home is spread well over especially in rural areas
Map 7.7 d) Method to Travel to Work by output area – Bicycle
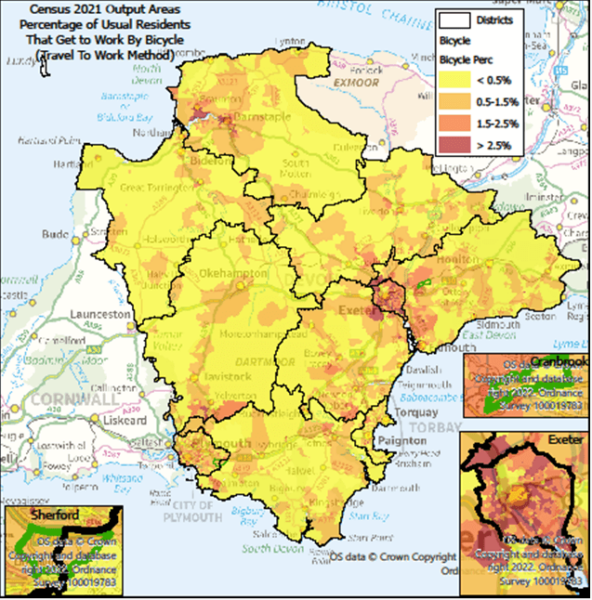
Biking to work is mainly where established cycle routes are available – Exeter and the Barnstaple-Braunton area.
Map 7.7 e) Method to Travel to Work by output area – On Foot
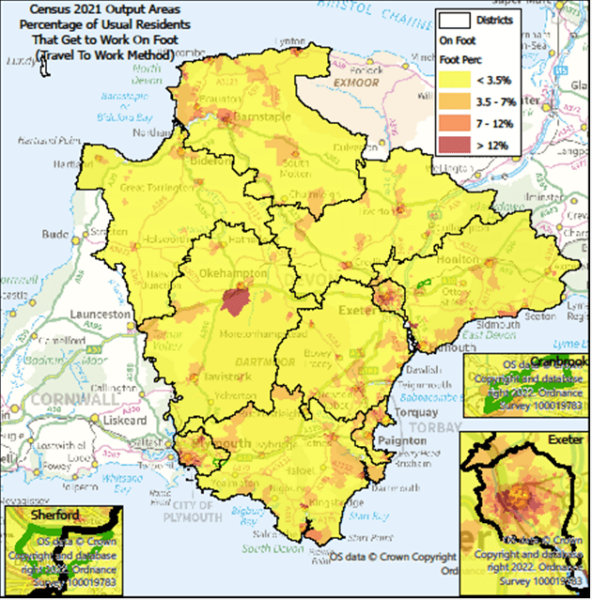
Not surprisingly walking is in the town centres – Exeter, Plymouth, Barnstaple, Exmouth, Okehampton, Tiverton, Crediton and most towns.
Map 7.7 f) Method to Travel to Work by output area – All Forms of Public Transport
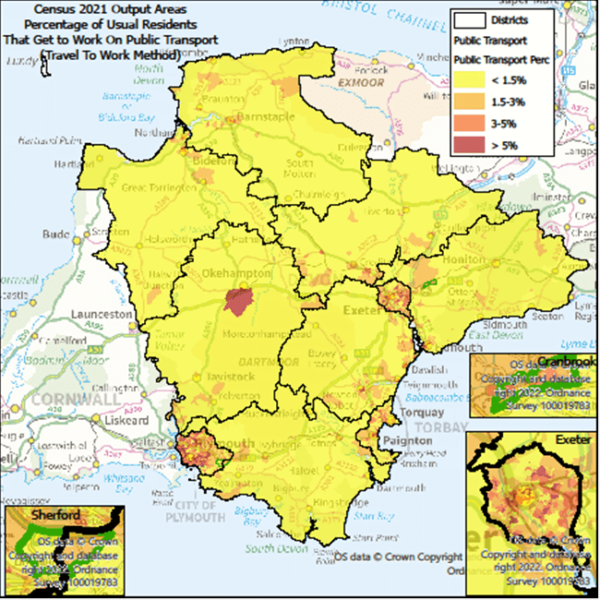
Exeter, Plymouth and to a lesser extent Torbay have most Public Transport uses – Okehampton and Newton Abbot also feature.
Map 7.7 g) Method to Travel to Work by output area – All Forms of Private Transport
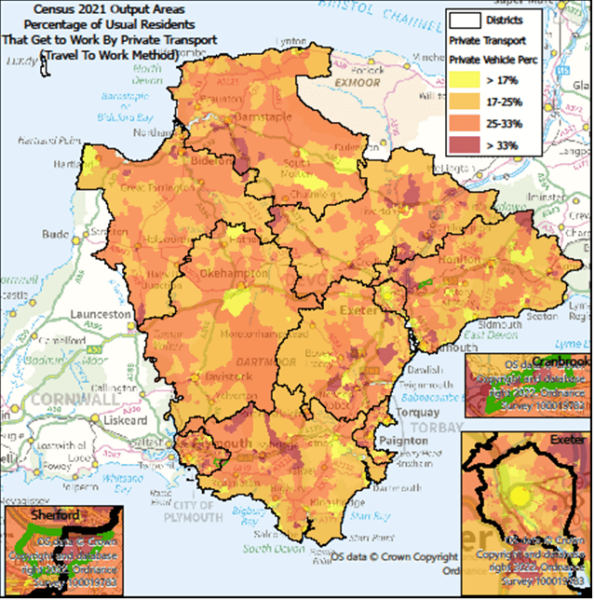
Private Transport seems to be mainly in the areas outside the main towns – maybe where Public Transport doesn’t cover reliably.
7.8 Distance travelled to work
(ONS Table TS058)
Table 7.8 a) Distance travelled to work by district
| Area | Less than 2km | 2km to less than 5km | 5km to less than 10km | 10km to less than 20km | 20km to less than 30km | 30km to less than 40km | 40km to less than 60km | 60km and over | Works mainly from home | Works mainly at an offshore installation, in no fixed place, or outside the UK | Does not apply (U16/Retired/Unemployed) | Usual Residents |
| East Devon | 7,615 | 4,981 | 6,794 | 9,873 | 3,355 | 1,484 | 678 | 1,382 | 19,757 | 10,808 | 84,101 | 150,828 |
| Exeter | 11,839 | 12,314 | 3,274 | 2,390 | 1,503 | 448 | 773 | 1,101 | 18,285 | 7,773 | 71,009 | 130,709 |
| Mid Devon | 5,134 | 2,006 | 3,487 | 5,767 | 3,241 | 792 | 853 | 642 | 11,963 | 6,397 | 42,570 | 82,852 |
| North Devon | 8,004 | 4,983 | 4,355 | 5,833 | 1,411 | 498 | 706 | 932 | 10,957 | 7,486 | 53,448 | 98,613 |
| South Hams | 3,936 | 2,710 | 3,802 | 5,273 | 2,097 | 1,011 | 516 | 635 | 13,451 | 7,153 | 48,043 | 88,627 |
| Teignbridge | 6,660 | 5,689 | 7,532 | 8,666 | 3,248 | 911 | 863 | 892 | 17,497 | 10,178 | 72,666 | 134,802 |
| Torridge | 3,576 | 2,405 | 2,227 | 5,108 | 1,650 | 593 | 460 | 713 | 7,776 | 5,546 | 38,061 | 68,115 |
| West Devon | 2,914 | 909 | 2,238 | 2,888 | 1,471 | 1,187 | 933 | 413 | 7,973 | 4,459 | 31,712 | 57,097 |
| Plymouth | 17,167 | 27,786 | 21,082 | 4,302 | 1,004 | 1,036 | 1,761 | 2,696 | 25,656 | 18,531 | 143,677 | 264,698 |
| Torbay | 11,133 | 8,196 | 8,816 | 3,530 | 1,551 | 1,088 | 526 | 826 | 12,155 | 11,117 | 80,389 | 139,327 |
| One Devon | 77,978 | 71,979 | 63,607 | 53,630 | 20,531 | 9,048 | 8,069 | 10,232 | 145,470 | 89,448 | 665,676 | 1,215,668 |
| DCC Devon | 49,678 | 35,997 | 33,709 | 45,798 | 17,976 | 6,924 | 5,782 | 6,710 | 107,659 | 59,800 | 441,610 | 811,643 |
| South West | 347,026 | 322,329 | 285,380 | 266,918 | 101,160 | 52,451 | 44,539 | 48,089 | 818,531 | 3,008,852 | 405,911 | 5,701,186 |
| England | 2,898,994 | 3,335,948 | 3,099,302 | 2,750,302 | 1,051,968 | 439,294 | 336,581 | 355,062 | 8,321,252 | 30,084,833 | 3,816,512 | 56,490,048 |
| Area | Less than 2km | 2km to less than 5km | 5km to less than 10km | 10km to less than 20km | 20km to less than 30km | 30km to less than 40km | 40km to less than 60km | 60km and over | Works mainly from home | Works mainly at an offshore installation, in no fixed place, or outside the UK | Does not apply (U16/Retired/ Unemployed) |
| East Devon | 5.0% | 3.3% | 4.5% | 6.5% | 2.2% | 1.0% | 0.4% | 0.9% | 13.1% | 7.2% | 55.8% |
| Exeter | 9.1% | 9.4% | 2.5% | 1.8% | 1.1% | 0.3% | 0.6% | 0.8% | 14.0% | 5.9% | 54.3% |
| Mid Devon | 6.2% | 2.4% | 4.2% | 7.0% | 3.9% | 1.0% | 1.0% | 0.8% | 14.4% | 7.7% | 51.4% |
| North Devon | 8.1% | 5.1% | 4.4% | 5.9% | 1.4% | 0.5% | 0.7% | 0.9% | 11.1% | 7.6% | 54.2% |
| South Hams | 4.4% | 3.1% | 4.3% | 5.9% | 2.4% | 1.1% | 0.6% | 0.7% | 15.2% | 8.1% | 54.2% |
| Teignbridge | 4.9% | 4.2% | 5.6% | 6.4% | 2.4% | 0.7% | 0.6% | 0.7% | 13.0% | 7.6% | 53.9% |
| Torridge | 5.2% | 3.5% | 3.3% | 7.5% | 2.4% | 0.9% | 0.7% | 1.0% | 11.4% | 8.1% | 55.9% |
| West Devon | 5.1% | 1.6% | 3.9% | 5.1% | 2.6% | 2.1% | 1.6% | 0.7% | 14.0% | 7.8% | 55.5% |
| Plymouth | 6.5% | 10.5% | 8.0% | 1.6% | 0.4% | 0.4% | 0.7% | 1.0% | 9.7% | 7.0% | 54.3% |
| Torbay | 8.0% | 5.9% | 6.3% | 2.5% | 1.1% | 0.8% | 0.4% | 0.6% | 8.7% | 8.0% | 57.7% |
| One Devon | 6.4% | 5.9% | 5.2% | 4.4% | 1.7% | 0.7% | 0.7% | 0.8% | 12.0% | 7.4% | 54.8% |
| DCC Devon | 6.1% | 4.4% | 4.2% | 5.6% | 2.2% | 0.9% | 0.7% | 0.8% | 13.3% | 7.4% | 54.4% |
| South West | 6.1% | 5.7% | 5.0% | 4.7% | 1.8% | 0.9% | 0.8% | 0.8% | 14.4% | 7.1% | 52.8% |
| England | 5.1% | 5.9% | 5.5% | 4.9% | 1.9% | 0.8% | 0.6% | 0.6% | 14.7% | 6.8% | 53.3% |
Figure 7.8 a) Distance travelled to work by district.
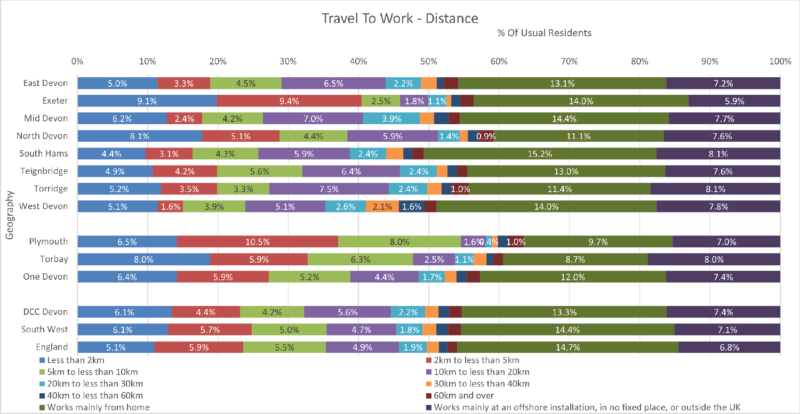
DCC figures roughly match the SW & England comparators. Exeter (9%), North Devon (8%) and Torbay (8%) travel less than 2km. 2k – 5k – Plymouth (11%) and Exeter (9%). South Hams have 15% Working at Home.
Table 7.8 b) Distance travelled to work by devon town
| Area | Less than 2km | 2km to less than 5km | 5km to less than 10km | 10km to less than 20km | 20km to less than 30km | 30km to less than 40km | 40km to less than 60km | 60km and over | Works mainly at an offshore installation, in no fixed place, or outside the UK | Works mainly from home | Does not apply | Usual Residents |
| Ashburton-Buckfastleigh | 387 | 189 | 265 | 538 | 253 | 139 | 18 | 46 | 669 | 1,101 | 4,189 | 7,794 |
| Axminster | 718 | 399 | 625 | 797 | 330 | 539 | 88 | 144 | 1,318 | 2,096 | 9,190 | 16,244 |
| Barnstaple | 4,580 | 3,877 | 2,067 | 2,545 | 262 | 125 | 389 | 429 | 3,492 | 4,552 | 25,986 | 48,304 |
| Bideford-Northam | 2,337 | 1,973 | 1,189 | 2,848 | 692 | 237 | 168 | 456 | 3,096 | 3,909 | 22,123 | 39,028 |
| Braunton | 839 | 369 | 1,232 | 531 | 115 | 34 | 45 | 156 | 938 | 1,572 | 6,599 | 12,430 |
| Cranbrook | 144 | 278 | 1,172 | 559 | 98 | 78 | 39 | 119 | 589 | 1,273 | 3,466 | 7,815 |
| Crediton | 1,148 | 400 | 699 | 1,867 | 812 | 247 | 270 | 143 | 1,746 | 3,366 | 11,354 | 22,052 |
| Cullompton | 1,073 | 805 | 1,233 | 2,286 | 843 | 190 | 226 | 238 | 2,042 | 3,891 | 12,647 | 25,474 |
| Dartmouth | 691 | 206 | 320 | 477 | 142 | 147 | 74 | 89 | 880 | 1,570 | 5,979 | 10,575 |
| Dawlish | 969 | 504 | 366 | 1,829 | 139 | 39 | 113 | 119 | 1,177 | 1,761 | 9,616 | 16,632 |
| Exeter (Wider) | 12,258 | 13,779 | 5,190 | 3,452 | 1,934 | 642 | 982 | 1,288 | 9,425 | 22,504 | 82,698 | 154,152 |
| Exmouth | 3,204 | 1,951 | 1,767 | 3,606 | 654 | 229 | 223 | 509 | 3,534 | 5,818 | 27,674 | 49,169 |
| Great Torrington | 584 | 132 | 438 | 1,086 | 300 | 45 | 114 | 90 | 943 | 1,225 | 5,962 | 10,919 |
| Holsworthy | 627 | 318 | 706 | 1,112 | 571 | 257 | 169 | 164 | 1,428 | 2,519 | 9,581 | 17,452 |
| Honiton | 1,190 | 313 | 607 | 1,090 | 1,107 | 113 | 97 | 154 | 1,524 | 2,499 | 10,369 | 19,063 |
| Ilfracombe | 1,596 | 338 | 511 | 1,497 | 222 | 39 | 55 | 184 | 1,333 | 1,732 | 9,526 | 17,033 |
| Ivybridge | 1,342 | 1,230 | 1,944 | 2,998 | 934 | 284 | 318 | 298 | 2,827 | 5,539 | 19,227 | 36,941 |
| Kingsbridge | 973 | 558 | 721 | 569 | 509 | 173 | 74 | 102 | 1,772 | 2,399 | 10,004 | 17,854 |
| Lynton-Lynmouth | 134 | 25 | 15 | 42 | 125 | 7 | 11 | 9 | 118 | 318 | 803 | 1,607 |
| Moretonhampstead | 116 | 61 | 80 | 327 | 152 | 51 | 7 | 28 | 347 | 867 | 2,289 | 4,325 |
| Newton Abbot | 3,945 | 3,910 | 4,818 | 4,211 | 2,237 | 563 | 477 | 500 | 5,920 | 9,549 | 39,621 | 75,751 |
| Okehampton | 1,563 | 453 | 879 | 1,079 | 1,016 | 1,010 | 421 | 159 | 2,412 | 4,208 | 15,136 | 28,336 |
| Ottery St Mary | 497 | 369 | 726 | 1,494 | 213 | 86 | 54 | 110 | 1,067 | 2,542 | 8,535 | 15,693 |
| Plymstock | 944 | 1,816 | 2,877 | 340 | 132 | 123 | 146 | 236 | 1,581 | 2,625 | 13,330 | 24,150 |
| Seaton | 812 | 308 | 321 | 545 | 409 | 233 | 57 | 108 | 851 | 1,239 | 7,875 | 12,758 |
| Sidmouth | 822 | 488 | 346 | 1,160 | 314 | 73 | 34 | 119 | 971 | 1,816 | 10,528 | 16,671 |
| South Molton | 782 | 300 | 328 | 1,035 | 563 | 219 | 166 | 113 | 1,285 | 2,139 | 8,275 | 15,205 |
| Tavistock | 1,400 | 481 | 1,410 | 1,908 | 564 | 235 | 534 | 255 | 2,231 | 4,119 | 17,808 | 30,945 |
| Teignmouth | 1,056 | 406 | 1,227 | 1,181 | 214 | 49 | 125 | 133 | 1,254 | 2,162 | 10,998 | 18,805 |
| Tiverton | 2,992 | 845 | 1,671 | 1,878 | 1,733 | 429 | 385 | 301 | 2,945 | 5,421 | 20,730 | 39,330 |
| Totnes | 923 | 716 | 819 | 1,226 | 507 | 403 | 55 | 143 | 1,677 | 3,946 | 12,830 | 23,245 |
| Plymouth | 17,167 | 27,786 | 21,082 | 4,302 | 1,004 | 1,036 | 1,761 | 2,696 | 143,677 | 25,656 | 18,531 | 264,698 |
| Torbay | 11,133 | 8,196 | 8,816 | 3,530 | 1,551 | 1,088 | 526 | 826 | 80,389 | 12,155 | 11,117 | 139,327 |
| One Devon | 77,978 | 71,979 | 63,607 | 53,630 | 20,531 | 9,048 | 8,069 | 10,232 | 665,676 | 145,470 | 89,448 | 1,215,668 |
| DCC Devon | 50,646 | 37,797 | 36,569 | 46,113 | 18,096 | 7,038 | 5,934 | 6,942 | 61,392 | 110,277 | 454,948 | 835,752 |
| South West | 347,026 | 322,329 | 285,380 | 266,918 | 101,160 | 52,451 | 44,539 | 48,089 | 405,911 | 818,531 | 3,008,852 | 5,701,186 |
| England | 2,898,994 | 3,335,948 | 3,099,302 | 2,750,302 | 1,051,968 | 439,294 | 336,581 | 355,062 | 3,816,512 | 8,321,252 | 30,084,833 | 56,490,048 |
| Area | Less than 2km | 2km to less than 5km | 5km to less than 10km | 10km to less than 20km | 20km to less than 30km | 30km to less than 40km | 40km to less than 60km | 60km and over | Works mainly at an offshore installation, in no fixed place, or outside the UK | Works mainly from home | Does not apply |
| Ashburton-Buckfastleigh | 5.0% | 2.4% | 3.4% | 6.9% | 3.2% | 1.8% | 0.2% | 0.6% | 8.6% | 14.1% | 53.7% |
| Axminster | 4.4% | 2.5% | 3.8% | 4.9% | 2.0% | 3.3% | 0.5% | 0.9% | 8.1% | 12.9% | 56.6% |
| Barnstaple | 9.5% | 8.0% | 4.3% | 5.3% | 0.5% | 0.3% | 0.8% | 0.9% | 7.2% | 9.4% | 53.8% |
| Bideford-Northam | 6.0% | 5.1% | 3.0% | 7.3% | 1.8% | 0.6% | 0.4% | 1.2% | 7.9% | 10.0% | 56.7% |
| Braunton | 6.7% | 3.0% | 9.9% | 4.3% | 0.9% | 0.3% | 0.4% | 1.3% | 7.5% | 12.6% | 53.1% |
| Cranbrook | 1.8% | 3.6% | 15.0% | 7.2% | 1.3% | 1.0% | 0.5% | 1.5% | 7.5% | 16.3% | 44.4% |
| Crediton | 5.2% | 1.8% | 3.2% | 8.5% | 3.7% | 1.1% | 1.2% | 0.6% | 7.9% | 15.3% | 51.5% |
| Cullompton | 4.2% | 3.2% | 4.8% | 9.0% | 3.3% | 0.7% | 0.9% | 0.9% | 8.0% | 15.3% | 49.6% |
| Dartmouth | 6.5% | 1.9% | 3.0% | 4.5% | 1.3% | 1.4% | 0.7% | 0.8% | 8.3% | 14.8% | 56.5% |
| Dawlish | 5.8% | 3.0% | 2.2% | 11.0% | 0.8% | 0.2% | 0.7% | 0.7% | 7.1% | 10.6% | 57.8% |
| Exeter (Wider) | 8.0% | 8.9% | 3.4% | 2.2% | 1.3% | 0.4% | 0.6% | 0.8% | 6.1% | 14.6% | 53.6% |
| Exmouth | 6.5% | 4.0% | 3.6% | 7.3% | 1.3% | 0.5% | 0.5% | 1.0% | 7.2% | 11.8% | 56.3% |
| Great Torrington | 5.3% | 1.2% | 4.0% | 9.9% | 2.7% | 0.4% | 1.0% | 0.8% | 8.6% | 11.2% | 54.6% |
| Holsworthy | 3.6% | 1.8% | 4.0% | 6.4% | 3.3% | 1.5% | 1.0% | 0.9% | 8.2% | 14.4% | 54.9% |
| Honiton | 6.2% | 1.6% | 3.2% | 5.7% | 5.8% | 0.6% | 0.5% | 0.8% | 8.0% | 13.1% | 54.4% |
| Ilfracombe | 9.4% | 2.0% | 3.0% | 8.8% | 1.3% | 0.2% | 0.3% | 1.1% | 7.8% | 10.2% | 55.9% |
| Ivybridge | 3.6% | 3.3% | 5.3% | 8.1% | 2.5% | 0.8% | 0.9% | 0.8% | 7.7% | 15.0% | 52.0% |
| Kingsbridge | 5.4% | 3.1% | 4.0% | 3.2% | 2.9% | 1.0% | 0.4% | 0.6% | 9.9% | 13.4% | 56.0% |
| Lynton-Lynmouth | 8.3% | 1.6% | 0.9% | 2.6% | 7.8% | 0.4% | 0.7% | 0.6% | 7.3% | 19.8% | 50.0% |
| Moretonhampstead | 2.7% | 1.4% | 1.8% | 7.6% | 3.5% | 1.2% | 0.2% | 0.6% | 8.0% | 20.0% | 52.9% |
| Newton Abbot | 5.2% | 5.2% | 6.4% | 5.6% | 3.0% | 0.7% | 0.6% | 0.7% | 7.8% | 12.6% | 52.3% |
| Okehampton | 5.5% | 1.6% | 3.1% | 3.8% | 3.6% | 3.6% | 1.5% | 0.6% | 8.5% | 14.9% | 53.4% |
| Ottery St Mary | 3.2% | 2.4% | 4.6% | 9.5% | 1.4% | 0.5% | 0.3% | 0.7% | 6.8% | 16.2% | 54.4% |
| Plymstock | 3.9% | 7.5% | 11.9% | 1.4% | 0.5% | 0.5% | 0.6% | 1.0% | 6.5% | 10.9% | 55.2% |
| Seaton | 6.4% | 2.4% | 2.5% | 4.3% | 3.2% | 1.8% | 0.4% | 0.8% | 6.7% | 9.7% | 61.7% |
| Sidmouth | 4.9% | 2.9% | 2.1% | 7.0% | 1.9% | 0.4% | 0.2% | 0.7% | 5.8% | 10.9% | 63.2% |
| South Molton | 5.1% | 2.0% | 2.2% | 6.8% | 3.7% | 1.4% | 1.1% | 0.7% | 8.5% | 14.1% | 54.4% |
| Tavistock | 4.5% | 1.6% | 4.6% | 6.2% | 1.8% | 0.8% | 1.7% | 0.8% | 7.2% | 13.3% | 57.5% |
| Teignmouth | 5.6% | 2.2% | 6.5% | 6.3% | 1.1% | 0.3% | 0.7% | 0.7% | 6.7% | 11.5% | 58.5% |
| Tiverton | 7.6% | 2.1% | 4.2% | 4.8% | 4.4% | 1.1% | 1.0% | 0.8% | 7.5% | 13.8% | 52.7% |
| Totnes | 4.0% | 3.1% | 3.5% | 5.3% | 2.2% | 1.7% | 0.2% | 0.6% | 7.2% | 17.0% | 55.2% |
| Plymouth | 6.5% | 10.5% | 8.0% | 1.6% | 0.4% | 0.4% | 0.7% | 1.0% | 9.7% | 7.0% | 54.3% |
| Torbay | 8.0% | 5.9% | 6.3% | 2.5% | 1.1% | 0.8% | 0.4% | 0.6% | 8.7% | 8.0% | 57.7% |
| One Devon | 6.4% | 5.9% | 5.2% | 4.4% | 1.7% | 0.7% | 0.7% | 0.8% | 12.0% | 7.4% | 54.8% |
| DCC Devon | 6.1% | 4.5% | 4.4% | 5.5% | 2.2% | 0.8% | 0.7% | 0.8% | 7.3% | 13.2% | 54.4% |
| South West | 6.1% | 5.7% | 5.0% | 4.7% | 1.8% | 0.9% | 0.8% | 0.8% | 7.1% | 14.4% | 52.8% |
| England | 5.1% | 5.9% | 5.5% | 4.9% | 1.9% | 0.8% | 0.6% | 0.6% | 6.8% | 14.7% | 53.3% |
Figure 7.8 b) Distance travelled to work by devon town
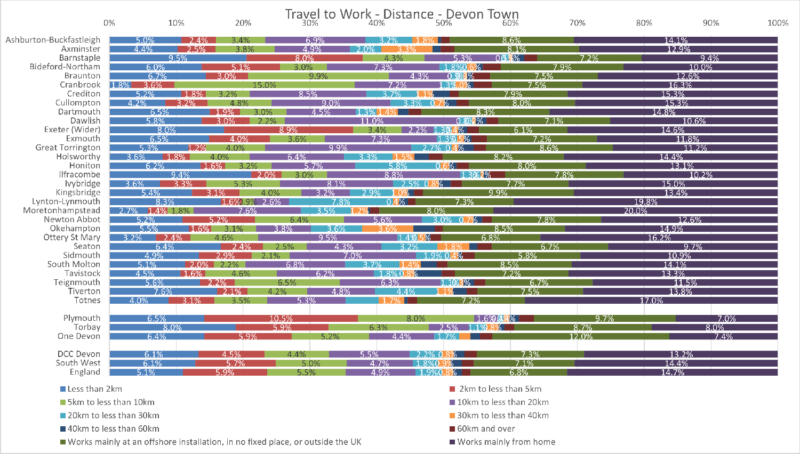
Under 5km Barnstaple (9.5%), Ilfracombe (9%) and Exeter (Wider) (8%). 2-5km Plymouth (10.5%), Exeter (Wider) (8%) and Barnstaple (8%). 5-10km Cranbrook (15%) and Braunton (10%). 10-20km Dawlish (11%), Gt Torrington (10% and Ottery St Mary (9.5%). 20-30km Lynton/Lynmouth (8%) and Honiton (6%), Offshore etc Kingsbridge (10%). Working at Home Moretonhampstead (20%), Lynton/Lynmouth (20%) and Totnes (17%).