Contents
Introduction
This report presents key data relevant to the development of the Clyst Valley Trail. It outlines the current and predicted usage of existing multi-use trails in Devon as well as outlining potential cycling rates in the area surrounding the Clyst Valley Trail corridor.
Multi-use Trails
Increasing the uptake of cycling is a key government aspiration; investing in cycling extends the travel options available to people for work, school, business, shopping, exercise and leisure. Indeed, in Devon, and particularly around Exeter, cycling, multi-use trails and public open space are seen as an intrinsic part of the solution for a modern growing economy. Because of this, there is a growing demand for a network of segregated high quality cycle paths and trails for use by a variety of users for a variety of purpose.
Devon’s existing walking and cycling network offers the opportunity for all to be active and enjoy the outdoors, whether this is walkers, cyclists, wheelchair users or horse riders. The county is recognised nationally as a prime location for walking and cycling and has a number of branded trails providing for a variety of non-motorised users.
The past and current usage of Devon’s multi-use trails gives an indication of the popularity and demand for walking and cycling provisions in the county.
Data from existing multi-use trails
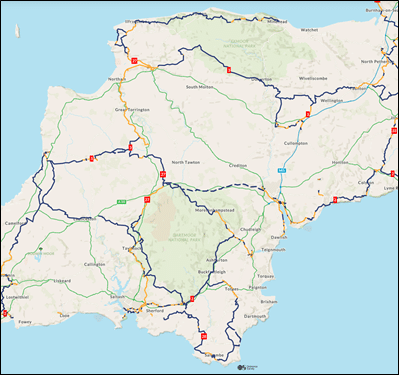
Devon has a network of multi-use trails, many of which are National Cycle Network (NCN) Routes. Figure 1 shows the coverage of such trails across the county.
Figure 1 National Cycle Network Routes in Devon
Average daily traffic count data
Table 1 presents the average daily traffic count recorded at ATC counters located at various points along key strategic NCN routes across Devon. It shows counts for the 10 years between 2012 and 2021.
The table shows that at all sites along all routes, the average daily traffic count of cycles has increased over time. The largest percentage increase is seen on NCN 2 at Dawlish Warren, while the smallest percentage increase is seen on NCN 2 at Exmouth Esplanade – however it is worth noting that observations suggest that on reaching Exmouth station, many cycles join the road network rather than continuing along the NCN2.
Table 1 average daily traffic count NCN routes
| Year | NCN 2 – Dawlish Warren | NCN – Exeter Quay Haven Banks | NCN 2 Lympstone | NCN 2 – Exmouth Esplanade | NCN 27- Meldon Reservoir | NCN 27 – Fremington Quay | NCN 27 – Bideford | NCN 3 – Little Torrington |
|---|---|---|---|---|---|---|---|---|
| 2012 | 36 | 666 | 244 | 121 | 80 | 128 | 238 | 30 |
| 2013 | 17 | 723 | 251 | 124 | 39 | 250 | 221 | 33 |
| 2014 | 87 | 925 | 305 | 138 | 106 | 287 | 232 | 36 |
| 2015 | 144 | 963 | 524 | 128 | 98 | 303 | 233 | 20 |
| 2016 | 147 | 1046 | 531 | 145 | 103 | 327 | 261 | 23 |
| 2017 | 160 | 1002 | 542 | 141 | 107 | 283 | 226 | 13 |
| 2018 | 189 | 946 | 459 | 155 | 92 | 286 | 218 | 22 |
| 2019 | 192 | 777 | 333 | 108 | 109 | 294 | 145 | 21 |
| 2020 | 265 | 1103 | 706 | 184 | 158 | 388 | 271 | 31 |
| 2021 | 200 | 936 | 575 | 124 | 115 | 383 | 300 | 61 |
| Percentage change over time | + 456% | +41% | +136% | +2% | +44% | +199% | +26% | +103% |
Average percentage change = 126%
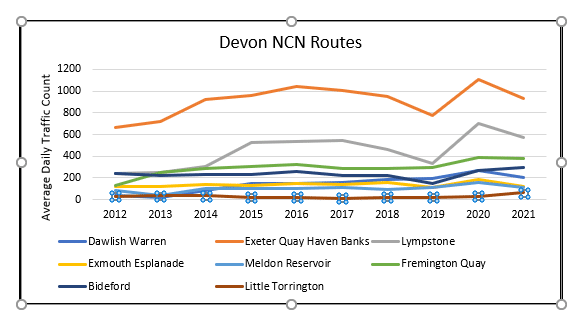
Figure 2 shows this data presented in graph form. It highlights that the counter located on Exeter Quay and Lympstone sties have consistently recorded the highest number of users daily, suggesting that Exeter and the Exe Estuary Trail have a high cycling demand.
Figure 2 average daily traffic cont NCN routes
Cycling in the Clyst Valley
The Clyst Valley Trail
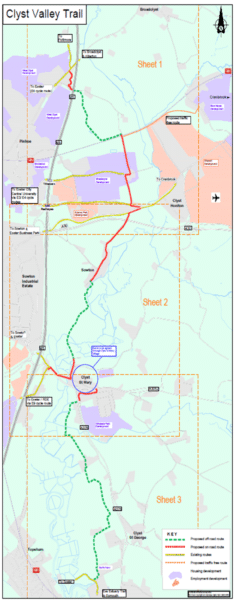
The Clyst Valley Trail is listed as a high priority route for delivery in Devon County Council’s multiuse trail strategy. The 13 km (8 mile) route will be linking the Exe Estuary Trail with Pinhoe in Exeter. Figure 3 shows an overview of the proposed route.
It will be a recreational trail for walkers, cyclists, mobility scooters and where feasible, horse riders. It will provide an attractive, safe and direct commuter and leisure route through the Clyst Valley regional park and the surrounding towns, villages and employment areas.
The total population that will benefit from the route (and are within 5km of the route) are specified below. This data has been taken from the 2011 census by looking at the middle super output areas.
Table 2 population data
| 2011 Middle super output area | 2011 population |
|---|---|
| E02004151: Exeter 003 | 7957 |
| E02004159: Exeter 011 | 9307 |
| E02004163: Exeter 015 | 6591 |
| E02004134: East Devon 006 | 6883 |
| E02004142: East Devon 014 | 5981 |
| Cranbrook * | 6000 |
| Total | 42,719 |
*A total of 2,617 households are now occupied at Cranbrook, with the average household size being 2.4 people it could be assumed that around 43,000 people will benefit from the route.
Figure 3 proposed clyst valley trail
ATC Counters in the Clyst Valley
Cycling data in the Clyst Valley area is available on C2. Figure 4 shows the location of ATC counters in the area, and Table 3 shows data collected at each counter between 2011 and 2020.The data shows that cycle flows tend to be greater closer to the estuary and that generally, flows have increased over time. It is likely that the significant growth seen at Redhayes Bridge is due to the expanding housing growth in Cranbrook and in the East of Exeter. The slight reduction in cycles passing the counter at Sowton in 2020, is likely to reflect the closure of the industrial and employment facilities as a result of the Covid-19 lockdown.
Figure 4 map of cycle counters in the Clyst Valley
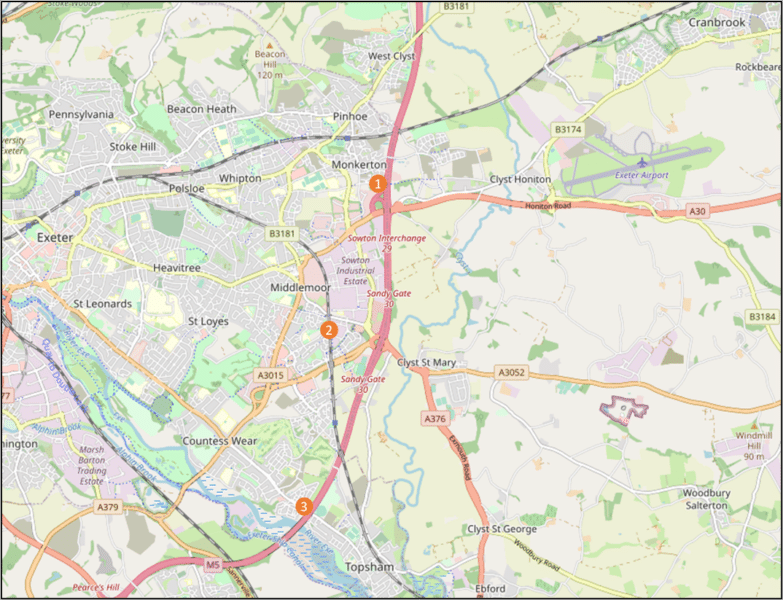
Table 3 Clyst Valley Cycle counters ADT
| Year | 1-Redhayes Bridge | 2-Sowton Sidmouth Road | 3 – Exe Estuary Topsham Road |
|---|---|---|---|
| 2011 | 32 | 109 | 312 |
| 2012 | 40 | 110 | 314 |
| 2013 | 83 | 122 | 222 |
| 2014 | 108 | 119 | 430 |
| 2015 | 113 | 125 | 443 |
| 2016 | 102 | 137 | |
| 2017 | 119 | 148 | |
| 2018 | 152 | 148 | 226 |
| 2019 | 155 | 137 | 371 |
| 2020 | 180 | 98 | 489 |
| Percentage change over time | +462% | -10% | +56% |
Extrapolating from the network of almost 100 automatic cycle counters across Devon, we have estimated the number of daily cycle trips – view Table 2 below. It is estimated that around half of the users of the off-road sections of the National Cycle Network are people out walking. This figure is confirmed by counts on the Exe Estuary Trail undertaken between January 2008 and August 2010 on the section between Lympstone and Exmouth. Of the 379,132 users, 45.7% were walking.
Table 4 estimated daily trips (walking and cycling)
| Section | Estimated daily trips (walking and cycling) * | Estimated daily trips (walking and cycling) * |
|---|---|---|
| Main section | 2016 | 2031 |
| Section 1:Mosshayne Lane | 200-250 (21 hourly trips) ** | 600-700 (58 hourly trips) |
| Section 2: Sowton Stretch – Clyst Honiton to Clyst St Mary | 200-250 (21 hourly trips) | 600-700 (58 hourly trips) |
| Section 3: Estuary link – Clyst St Mary to Exe Estuary Trail | 100-150 (13 hourly trips) | 400-500 (42 hourly trips) |
* A trip is defined as a count of a pedestrian or cyclist passing a data line (a recording point). An example of 700 trips may actually be 350 people passing a certain location as it could record outward and return journeys.
** possibly hourly trips (that is divided by 12 hours) in brackets.
Propensity to cycle tool
The Propensity to Cycle tool is a web-based tool for estimating cycling potential and corresponding health and CO2 benefits, down to the street level. It uses 2011 census data and origin-destination data to provide an insight into how cycling habits and patterns would change under different scenarios and in different ‘cycling futures’. The tool presents the potential uplift in commuting cycling – those who report cycling as their primary mode of transport to their place of work.
Base Line Cyclists: Commuting to work data from 2011 census enhanced with gender composition, area mortality rate and origin-destination data.
Government Target (Equality): Doubling the level of cycling in line with the government’s target to double the number of ‘stages’ cycled by 2025. Accounts only for trip distance and hilliness.
Government Target (Near Market): Doubling the level of cycling in line with the government’s target to double the number of ‘stages’ cycled by 2025. Increase calculated as a function of trip distance, hilliness, and sociodemographic and geographical characteristics. This is the target that is considered the most feasible in terms of forecasting commuter cycle uptake.
Gender Equality: This scenario illustrates the increase in cycling that would result if women were as likely as men to cycle a given trip.
Go Dutch: What would happen if English people were as likely as Dutch people to cycle a trip of a given distance and level of hilliness if all areas of England had the same infrastructure and cycling culture as the Netherlands.
E-Bikes: This scenario models the additional increase in cycling that would be achieved through widespread uptake of electric cycles (scaling up from Go Dutch scenario)
Clyst Valley propensity to cycle results
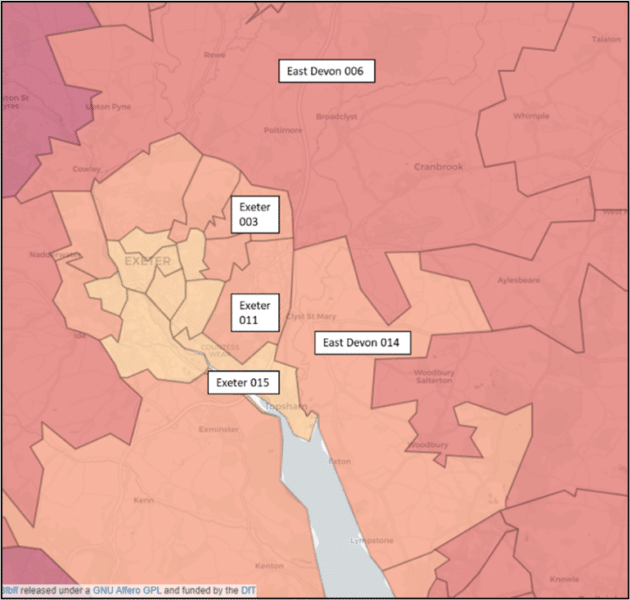
The propensity to cycle tool allows users to select results for whole regions, such as a county, Middle Super Output Areas (MSOA) or Lower Super Output Areas (LSOA). Figure 5 shows the MSOAs relevant to the Clyst Valley area which have been investigated with the Propensity to Cycle Tool.
Figure 5 MSOAs in the Clyst Valley
The Propensity to Cycle Tool outputs for each of the MSOA’s in the Clyst Valley are presented in Table 4. The relevant outputs for Devon as a county are also included for comparison. Figure 6 shows the outputs in graph form.
Table 4 Propensity to cycle tool outputs
| MSOA | Name | Total commuters (all modes) | Cyclists baseline | Drivers baseline | Government target (near market) | Go Dutch | Ebikes |
|---|---|---|---|---|---|---|---|
| Devon | Devon | 459060 | 3% | 65% | 5% | 12% | 21% |
| East Devon 006 | Broadclyst | 2894 | 3% | 78% | 5% | 11% | 19% |
| Exeter 003 | Pinhoe | 3414 | 6% | 61% | 9% | 20% | 30% |
| Exeter 011 | Middlemoor | 4842 | 6% | 61% | 9% | 20% | 30% |
| East Devon 014 | Clyst St Mary | 2601 | 4% | 56% | 7% | 17% | 25% |
| Exeter 015 | Topsham | 2645 | 8% | 57% | 12% | 25% | 33% |
| Clyst Valley Trail area | Clyst Valley Trail area | 16,396 | 5% | 63% | 8% | 19% | 27% |
Figure 6 Propensity to cycle tool outputs
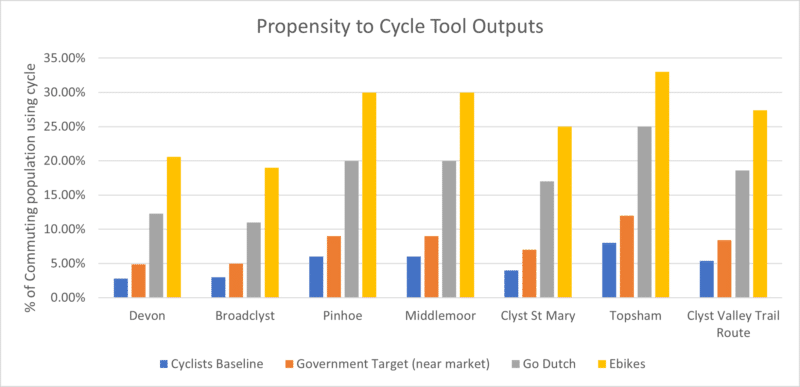
The Propensity to Cycle tool results estimate that in the majority of the MSOAs that make up the Clyst Valley, cycling interventions in most scenarios are likely to lead to an increased percentage of commuters travelling by cycle.
The results show that the percentage of commuters cycling in each scenario is likely to be higher than Devon overall (apart from in the Broadclyst MSOA). This suggests that the southern end of the Clyst Valley Trail is likely to see more cycling uplift with the proposed infrastructure interventions that the northern part.
Achieving the government target would result in 8% (1,300) of the total commuters living across the Clyst Valley Trail area cycling to work. Depending on where their workplace destination is, they may choose to use the Clyst Valley Trail.
Conclusion
The data presented in this report shows the current cycling flows across Devon and in the Clyst Valley. It reports the potential usage of pedestrian and cyclist activity of the Clyst Valley Trail once it is completed. This potential usage is based on data from existing counters on comparable routes across Devon’s multiuse network. In addition, data from the Propensity to Cycle Tool has been used to estimate the proportion of the total commuter cyclists.
As mentioned in the report, of the total trips on the network it is estimated that half of the trips will be made up of walking journeys. This estimation is based on usage of other off road sections of the Devon Multiuse trail network.
Considering the fact that key existing Multi-Use Trails in Devon have seen almost continuous increase in cycling flows over the past 10 years, it is reasonable to suggest that cycling demand in Devon is increasing.
We consider that delivering the Clyst Valley Trail multiuse route will bring us closer to achieving the government commuter cycling target, but will also benefit people walking, people using mobility aids, recreational cyclists and where possible equestrians. When the scheme is completed, we will monitor uptake in usage to assess the success of our scheme.