Devolution and Local Government Reorganisation (LGR)
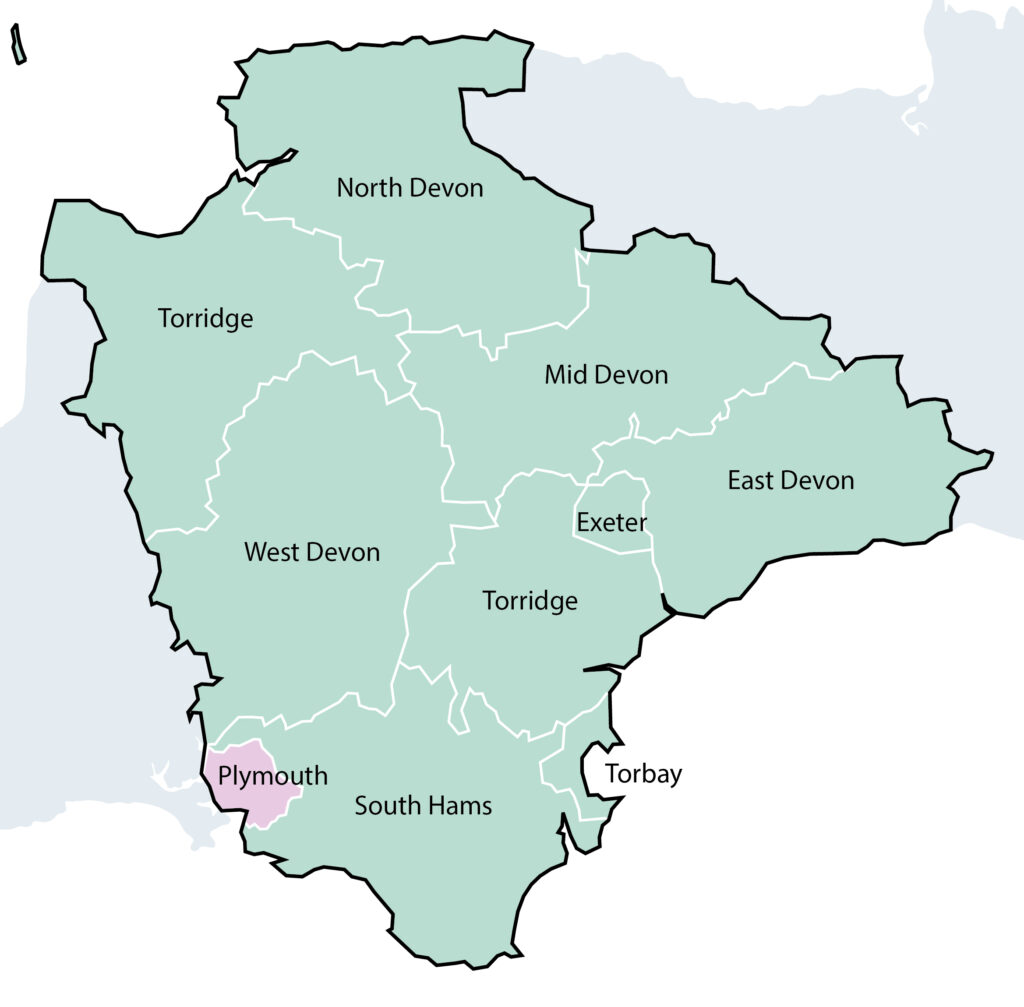
- Plymouth with existing boundary
- Devon – combining the areas of the current 8 districts and Torbay
| Indicator | Plymouth | Greater Devon | England |
|---|
| Population: Total | 268,736 | 972,893 | |
| Population aged 0-15 | 46,112 (17.2%) | 151,697 (15.6%) | 18.5% |
| Population aged 16-64 | 172,023 (64.0%) | 565,920 (58.2%) | 62.9% |
| Population aged 65+ | 50,601 (18.8%) | 255,276 (26.2%) | 18.7% |
| Population Change 2018-2023: Total | + 3,047 (+1.1%) | + 44,959 (+4.8%) | +3.2% |
| Population Change 2018-2023: 0-15 | -546 (-1.2%) | +1,105 (+0.7%) | +0.9% |
| Population Change 2018-2023: 16-64 | +612 (+0.4%) | +24,764 (+4.6%) | +2.7% |
| Population Change 2018-2023: 65+ | +2,981 (+6.3%) | +19,090 (+8.1%) | +6.9% |
| Area Size (sq. km) | 80 | 6,627 | |
| Population Density | 3,366 | 147 | 434 |
| Council Tax Base (all) | 123,273 | 466,757 | |
| Gross Value Added | £6.97 bn | £24.46 bn | |
| Gross Value Added per worker | £57,315 | £59,972 | £73,390 |
| VAT Reg Business | 6,280 | 42,820 | |
| VAT Reg Businesses per 100 people | 2.3 | 4.4 | 4.1 |
| Income deprived (%) | 14.8% | 10.8% | 12.9% |
| Annual Housing Completions vs Target | 25.1% (324/1,290) | 59.9% (4,353/7,272) | 62.1% |
| Average FT Salary to House Price Ratio | 6.7 (£31.6k/£210.6k) | 9.7 (£31.8k/£307.8k) | 8.3 (£35.1k/£290.0k) |