Devolution and Local Government Reorganisation (LGR)
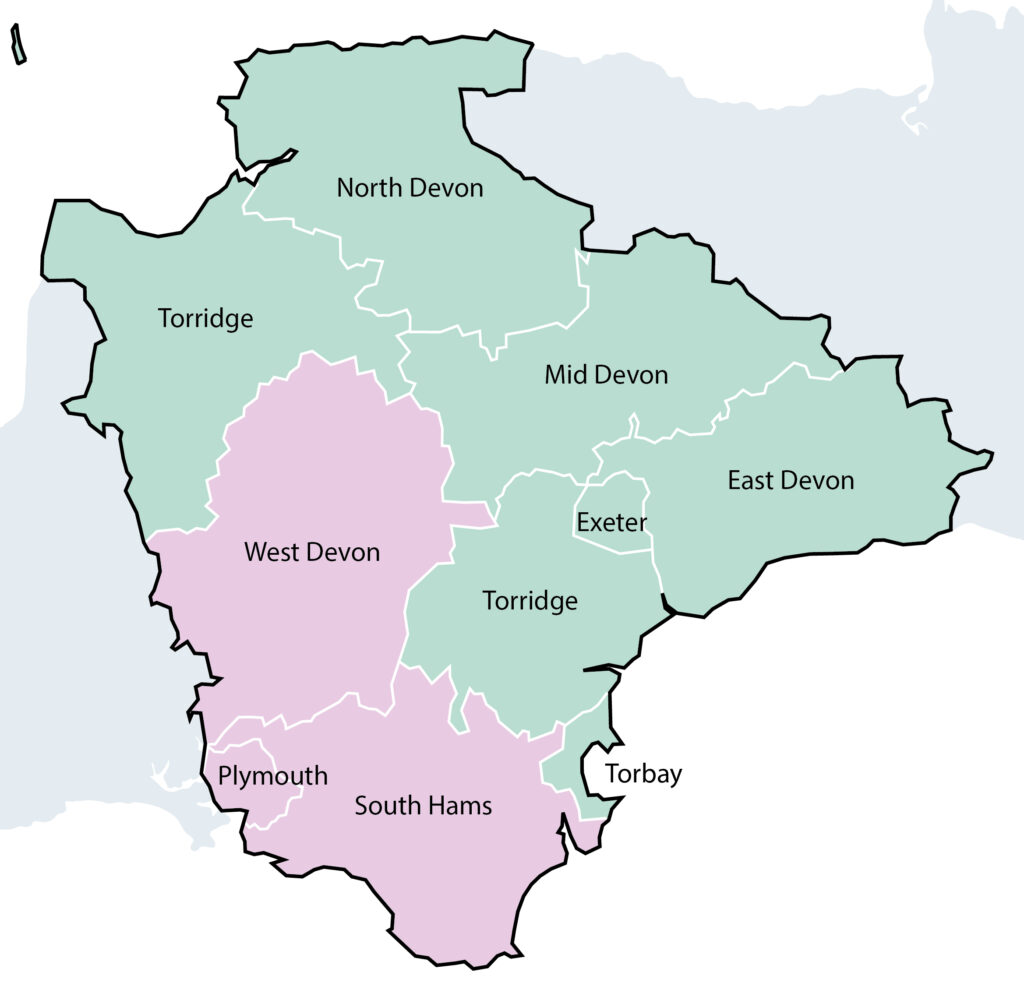
- South West Devon includes Plymouth, South Hams and West Devon – shown in
- North East Devon includes Exeter, East Devon, Torbay, Teignbridge, North Devon, Torridge and Mid Devon – shown in green.
| Indicator | North/East Devon | South/West Devon | England |
|---|
| Population: Total | 786,143 | 407,210 | |
| Population aged 0-15 | 129,091 (15.7%) | 68,718 (16.4%) | 18.5% |
| Population aged 16-64 | 482,232 (58.6%) | 255,711 (61.1%) | 62.9% |
| Population aged 65+ | 211,974 (25.7%) | 93,903 (22.4%) | 18.7% |
| Population Change 2018-2023: Total | +36,884 (+4.7%) | +11,122 (+2.7%) | +3.2% |
| Population Change 2018-2023: 0-15 | +640 (+0.5%) | -81 (-0.1%) | +0.9% |
| Population Change 2018-2023: 16-64 | +21,214 (+4.6%) | +4,162 (+1.7%) | +2.7% |
| Population Change 2018-2023: 65+ | +15,030 (+7.6%) | +7,041 (+8.1%) | +6.9% |
| Area Size (sq. km) | 4,581 | 2,126 | |
| Population Density | 180 | 197 | 434 |
| Council Tax Base (all) | 391,955 | 198,075 | |
| Gross Value Added | £21.03bn | £10.39bn | |
| Gross Value Added per worker | £60,541 | £57,111 | £73,390 |
| VAT Reg Business | 34,415 | 14,685 | |
| VAT Reg Businesses per 100 people | 4.2 | 3.5 | 4.1 |
| Income deprived (%) | 11.1% | 12.9% | 12.9% |
| Annual Housing Completions vs Target | 58.5% (3,462/5,919) | 46.0% (1,215/2,643) | 62.1% |
| Average FT Salary to House Price Ratio | 9.4 (£31.8k/£299.8k) | 8.2 (£31.9k/£261.0k) | 8.3 (£35.1k/£290.0k) |