Devolution and Local Government Reorganisation (LGR)
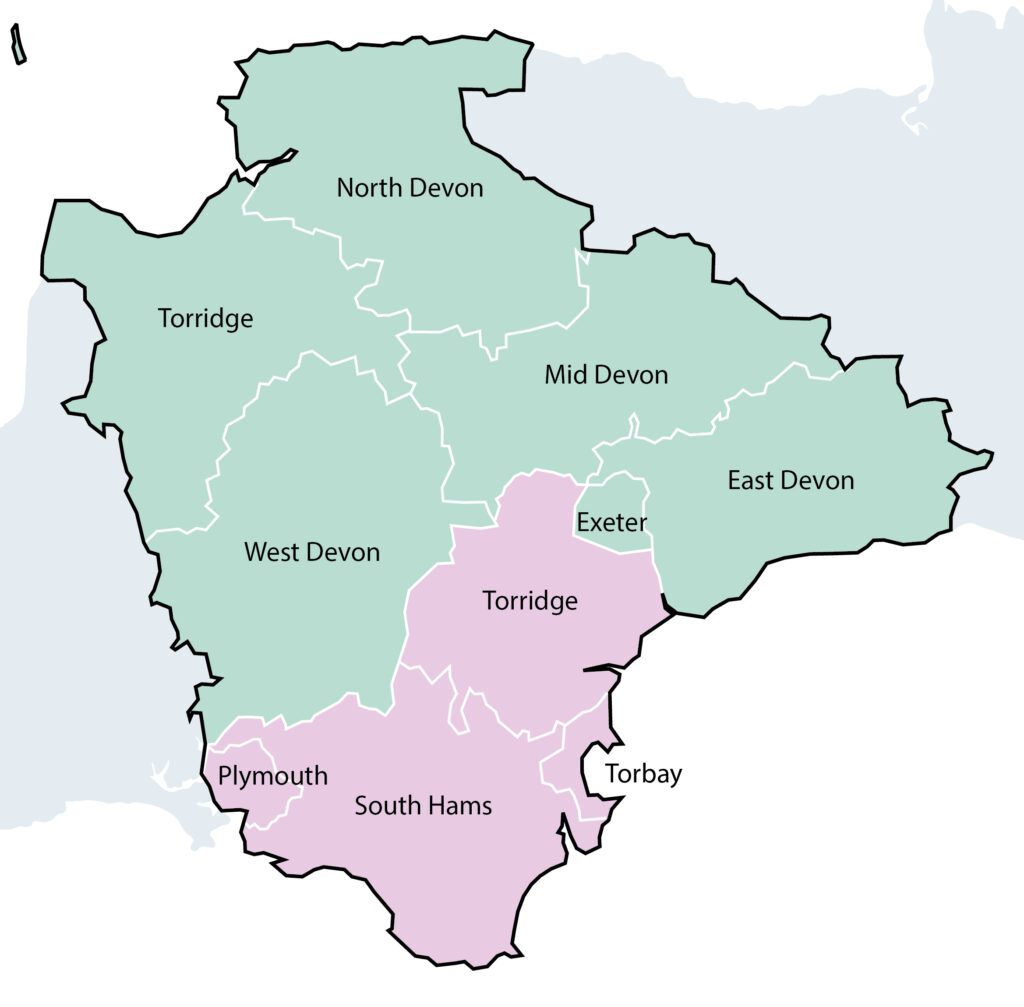
- South Devon, including Plymouth, Teignbridge, South Hams and Torbay – shown in green.
- North Devon, includes Exeter, East Devon, North Devon, Torridge, West Devon and Mid Devon – shown in blue.
| Indicator | North Devon | South Devon | England |
|---|
| Population: Total | 605,492 | 639,137 | |
| Population aged 0-15 | 94,153 (15.5%) | 103,656 (16.3%) | 18.5% |
| Population aged 16-64 | 357,906 (59.1%) | 380,037 (59.7%) | 62.9% |
| Population aged 65+ | 153,433 (25.3%) | 152,444 (24.0%) | 18.7% |
| Population Change 2018-2023: Total | +34,239 (+6.0%) | +13,767 (+2.2%) | +3.2% |
| Population Change 2018-2023: 0-15 | +1,196 (+1.3%) | -637 (-0.6%) | +0.9% |
| Population Change 2018-2023: 16-64 | +21,058 (+6.3%) | +4,318 (+1.1%) | +2.7% |
| Population Change 2018-2023: 65+ | +11,985 (+8.5%) | +10,086 (+7.1%) | +6.9% |
| Area Size (sq. km) | 5,004 | 1,703 | |
| Population Density | 121 | 374 | 434 |
| Council Tax Base (all) | 285,190 | 304,840 | |
| Gross Value Added | £16.65bn | £14.78bn | |
| Gross Value Added per worker | £65,121 | £53,984 | £73,390 |
| VAT Reg Business | 27,610 | 21,490 | |
| VAT Reg Businesses per 100 people | 4.6 | 3.4 | 4.1 |
| Income deprived (%) | 9.7% | 13.5% | 12.9% |
| Annual Housing Completions vs Target | 68.0% (2,946/4,332) | 40.9% (1,713/4,230) | 62.1% |
| Average FT Salary to House Price Ratio | 9.5 (£32.7k/£310.4k) | 8.5 (£30.9k/£264.3k) | 8.3 (£35.1k/£290.0k) |